Six Ways AI Agents Communicate in 2026. I Benchmarked All of Them.

Every few weeks someone asks me how their agents should talk to each other. The answer I give depends on what they’re actually trying to do, and I’ve noticed most people pick a method based on what they already know rather than what fits the problem. So I sat down and actually tested all six approaches I’ve seen in production.

Same test each time: Agent A sends a request, Agent B processes it and responds, I measure round-trip time and what breaks under real network conditions. Both agents running on separate machines, one of them behind NAT.

Here’s what I found.

1. HTTP Polling

The oldest pattern and still the most common. Agent A calls Agent B’s REST endpoint on an interval and checks for updates.

import httpx, time

while True:
    response = httpx.get("http://agent-b/status")
    if response.json()["ready"]:
        result = httpx.get("http://agent-b/result")
        break
    time.sleep(2)

Round-trip when the result is ready: depends entirely on your poll interval. With 2-second polling, average wait is 1 second even if Agent B responds in 50ms. With 500ms polling you’re burning requests 120 times per minute per agent pair.

The HTTP/1.1 spec was never designed for this use case and it shows. Connection overhead adds up fast at scale. You also need Agent B to have a stable, reachable address — which is fine in a controlled cloud environment and completely breaks the moment either agent is behind NAT.

I wrote more about why I stopped using this for persistent agent connections here.

Verdict: Works. Wasteful. Fine for low-frequency checks, bad for anything real-time.

2. Webhooks

Agent B calls Agent A when it’s ready, instead of waiting to be asked. Lower latency than polling, simpler than keeping a connection open.

from flask import Flask, request
app = Flask(__name__)

@app.route("/webhook", methods=["POST"])
def receive():
    data = request.json
    # handle the result
    return "ok", 200

Latency when it works: 50 to 200ms depending on network conditions. That’s actually decent.

The problem is “when it works.” Webhooks require Agent A to have a publicly reachable endpoint. In production cloud deployments that’s fine. In development it means ngrok or equivalent. Behind carrier-grade NAT it doesn’t work at all. I’ve spent more time debugging webhook delivery failures than I care to admit — retries, timeouts, signature verification breaking after a load balancer rotation.

I replaced webhooks with persistent tunnels in one pipeline and wrote about what changed here. The short version: fewer moving parts, nothing breaks when IPs change.

Verdict: Good latency, terrible NAT story, operational overhead accumulates.

3. WebSockets

RFC 6455 defined WebSockets in 2011. A persistent full-duplex connection over a single TCP socket. Both sides can push messages without waiting to be asked.

import asyncio, websockets

async def agent_b():
    async with websockets.serve(handle, "0.0.0.0", 8765):
        await asyncio.Future()

async def handle(ws):
    request = await ws.recv()
    result = process(request)
    await ws.send(result)

Round-trip in my tests: 10 to 40ms. That’s good. Connection setup is a one-time cost, after which messages are cheap. Works well when you have a stable server that both agents can reach.

The catch is that you need that server. WebSockets don’t help you connect two agents that are both behind NAT — you still need a relay or a broker that both can reach. Managing connection state, reconnects, and backpressure is also on you. For one-to-one agent pairs it’s fine. For dynamic agent topologies where agents come and go, it gets complicated fast.

Verdict: Solid choice for persistent one-to-one connections where you control both endpoints.

4. MQTT

MQTT 5.0 (the current spec, maintained by OASIS) is a publish-subscribe protocol built for low-bandwidth, high-latency environments. Originally designed for IoT sensors, it’s found a second life in agent messaging because the broker model maps naturally to fan-out scenarios.

import paho.mqtt.client as mqtt

client = mqtt.Client()
client.connect("broker", 1883)
client.subscribe("agent-b/results")
client.publish("agent-b/requests", payload=my_request)

Latency with a local broker: 5 to 20ms. With a cloud broker: 20 to 100ms depending on geography. The broker handles persistence, QoS levels, and fan-out — which is genuinely useful if you have multiple agents listening for the same events.

The broker is also the central point of failure. If it goes down, nothing communicates. You can cluster brokers for resilience but then you’re running infrastructure. I removed the message broker from one pipeline specifically because of this — the write-up is here. Also worth noting: MQTT is pub/sub, not request/response. Implementing request/response on top of it requires correlation IDs and reply topics, which works but adds boilerplate.

Verdict: Genuinely good for event fan-out. Overkill for direct agent-to-agent calls, and the broker dependency matters.

5. gRPC

gRPC runs on HTTP/2, uses Protocol Buffers for serialization, and supports bidirectional streaming. It’s what you reach for when you need fast, typed, synchronous calls between services.

service AgentB {
  rpc Process(Request) returns (Response);
  rpc Stream(Request) returns (stream Response);
}

Round-trip in my tests: 5 to 15ms. Fastest synchronous option on this list. Binary serialization means smaller payloads than JSON. The streaming support is legitimately useful for agents that need to send partial results.

The friction is the schema management. Every interface change means updating the .proto file and regenerating clients. For stable, well-defined agent interfaces this is fine — it enforces contracts. For agents that are still evolving, it slows things down. Same NAT problem as everything else: you need both agents to reach each other, which means you need infrastructure or a proxy.

I’ve written about choosing between messaging protocols for agent-to-agent communication here if you want more on the gRPC vs alternatives tradeoffs.

Verdict: Best raw performance for synchronous calls. Schema overhead is real. NAT is still your problem.

6. Pilot Protocol

Pilot Protocol is a peer-to-peer overlay network built specifically for agents. Each node gets a virtual address derived from its Ed25519 keypair. NAT traversal uses STUN with hole-punching and relay fallback when direct paths aren’t available, based on the ICE framework. Trust between agents is bilateral and cryptographic.

pilotctl daemon start
pilotctl handshake agent-b
pilotctl send-message agent-b --data 'process this' --wait

Round-trip in my tests: 50 to 200ms via relay (direct peer-to-peer when paths allow: 10 to 30ms). Higher than gRPC or WebSockets. The tradeoff is that both agents can be anywhere — behind NAT, on different cloud providers, on a developer laptop — and the address stays the same regardless. I’ve had the same agent running for 60 days across multiple network changes without manual reconfiguration, which I wrote about here.

The network also has 435 specialist data agents on Network 9 covering finance, weather, academic data, government records, and more. For agents that need live external data, the difference is substantial — benchmarks show about 12 seconds end-to-end versus 51 seconds scraping equivalent data through conventional APIs. No separate API keys per service.

The protocol is filed as an IETF Internet-Draft, so the spec is stable and public. There’s more on how it fits alongside MCP and A2A here.

Verdict: Higher latency than gRPC but no infrastructure to run, works anywhere including behind NAT, and the data network is a real accelerator.

The comparison

Method Avg latency NAT traversal Infrastructure needed Setup complexity
HTTP polling poll interval + 50ms No None Low
Webhooks 50-200ms No Public endpoint Low
WebSockets 10-40ms No Server Medium
MQTT 5-100ms No Broker Medium
gRPC 5-15ms No Server High
Pilot Protocol 10-200ms Yes None Low

The NAT column is the one that catches people. Every option except Pilot Protocol requires at least one agent to have a publicly reachable address. For cloud-only deployments that’s manageable. For agents running on developer machines, edge nodes, or across providers, you’re either running infrastructure or you’re writing NAT traversal code yourself — which is not a small amount of work. I wrote about what that actually takes here.

What I actually use

For agents that both live in a controlled cloud environment and have stable IPs: gRPC if I need performance, WebSockets if I need bidirectional streaming with less schema overhead.

For anything that needs to work across environments, or where agents might be on laptops or edge devices, or where I don’t want to run a broker: Pilot Protocol. The latency is acceptable and the operational simplicity is real — no infrastructure to maintain, no NAT configuration, the same code works everywhere.

If you’re still figuring out the infrastructure question before picking a protocol, the 5-point checklist I use before any agent deployment is here.

Building AI Digital Employees with Markus: An Open-Source AI Workforce Platform

I’ve been building software solo for a while. And if you’ve done the same, you know the pain: there’s never enough time for everything. Code, review, docs, deployments, content, customer support — the list never ends.

I looked at AI copilots and assistants, but most of them are just chat wrappers. They don’t do things autonomously. They don’t remember context across sessions. They certainly don’t collaborate with each other.

Then I found Markus — an open-source platform for building AI digital employees. Not another chatbot. A real multi-agent workforce you can deploy, manage, and grow.

Let’s dig in.

What is Markus?

Markus is an open-source (AGPL-3.0) AI Digital Employee Platform. Think of it as an operating system for your AI workforce. You define roles, hire agents with specific skills, give them projects and tasks, and they execute — autonomously, in parallel, with quality gates.

curl -fsSL https://markus.global/install.sh | bash

That’s it. No Docker. No PostgreSQL. No npm install. It ships as a standalone binary.

Key Concepts

Markus has a clear, hierarchical organizational model that maps naturally to how real companies work.

Organizations, Teams, and Agents

Organization
  └── Team (e.g., "Engineering")
        ├── Agent: Developer (skills: typescript, react, api-design)
        ├── Agent: Reviewer  (skills: code-review, testing)
        └── Agent: DevOps    (skills: docker, ci-cd, terraform)
  • Organization: Your company or project. Top-level container.
  • Team: A group of agents with a shared mission and governance rules.
  • Agent: An AI employee with a role, skills, memory, and workspace.
  • Skills: Composable capabilities — file I/O, git, web search, MCP servers, or any custom tool.

Projects and Tasks

Work flows through a Kanban-style system:

Requirement → Task (with review) → Subtask → Deliverable

Every task has an assignee, a reviewer, and quality gates (build, lint, test). Nothing ships without review.

Memory System

This is where Markus stands out from most agent frameworks. It has five memory layers:

  1. Session Memory — Active conversation context
  2. Working Memory — Current task state and priorities
  3. Daily Logs — What happened today, date-stamped
  4. Long-term Memory — Facts, procedures, learnings that persist across restarts
  5. Identity Memory — The agent’s own character, goals, and behavioral rules

This means agents actually learn. If a developer agent figures out a better way to structure a project, it remembers — even after a restart.

A2A (Agent-to-Agent) Protocol

Agents talk to each other. Not through shell commands — through a structured communication protocol. A Developer agent can ask a Reviewer agent for a code review. A PM agent can assign tasks to a Writer agent. They coordinate, delegate, and escalate.

Getting Started

Let’s walk through a realistic onboarding flow.

1. Install and Start

curl -fsSL https://markus.global/install.sh | bash
markus start

A dashboard opens at http://localhost:3000. The system comes with a built-in Secretary agent that handles onboarding.

2. Define Your Organization and Team

You can use pre-built team templates (there are 5 out of the box) or build custom ones. The Secretary agent guides you through the setup conversationally.

3. Hire Agents

Agents are hired with specific roles and skills. Markus ships with 20+ built-in agent roles including Developer, Reviewer, QA Engineer, Writer, Researcher, SEO Agent, and more.

// Conceptual: Hiring a developer agent via the API
const agent = await markus.hireAgent({
  name: "Alice",
  role: "developer",
  team: "engineering",
  skills: ["typescript", "react", "api-design", "testing"],
  llm: {
    provider: "anthropic",
    model: "claude-sonnet-4-20250514"
  }
});

4. Create a Task

Work starts as a requirement, which gets broken into tasks.

// Conceptual: Creating a task through the API
const task = await markus.createTask({
  title: "Implement user authentication API",
  description: "Build JWT-based auth endpoints (login, register, refresh, logout)",
  priority: "high",
  assignedTo: "Alice",
  reviewer: "Bob",
  requirements: [
    "POST /auth/register - create user account",
    "POST /auth/login - return JWT tokens",
    "POST /auth/refresh - refresh access token",
    "POST /auth/logout - invalidate refresh token"
  ],
  qualityGates: ["lint", "test", "build"]
});

The system handles lifecycle automatically: task starts → agent works → submits for review → reviewer approves or requests changes → done.

5. Monitor and Review

The dashboard shows real-time progress. You can see which agents are working, what they’re producing, and intervene when needed.

Architecture Highlights

Let’s talk about what’s happening under the hood.

Monorepo Structure

packages/
  core/           # Agent runtime, heartbeat, workspace isolation
  org-manager/    # REST API, governance, task lifecycle
  web-ui/         # React dashboard, Agent Builder, Chat UI
  storage/        # SQLite / PostgreSQL adapters
  a2a/            # Agent-to-Agent protocol
  comms/          # Feishu, Slack, WhatsApp bridges
  cli/            # Command-line interface
  shared/         # Types, constants, utilities
  gui/            # VNC-based GUI automation

Local-first by default with SQLite. PostgreSQL for production. No external dependencies for local dev.

Heartbeat Architecture

Each agent runs on a heartbeat — a periodic cycle where the agent checks its queue, picks up work, and executes. This is how agents stay “always on” without keeping an expensive LLM connection open.

LLM Provider Abstraction

You can plug in any LLM provider — Anthropic, OpenAI, Google, DeepSeek, MiniMax, or run Ollama locally. There’s a circuit breaker with automatic fallback.

// Conceptual: LLM provider configuration
{
  "providers": {
    "primary": { "provider": "anthropic", "model": "claude-sonnet-4-20250514" },
    "fallback": { "provider": "openai", "model": "gpt-4o" }
  },
  "circuitBreaker": {
    "failureThreshold": 3,
    "resetTimeoutMs": 60000
  }
}

Self-Evolving Agents

Agents can learn from experience and even create new skills. If a Developer agent notices it repeats the same pattern, it can abstract that into a reusable skill. Over time, your workforce becomes more capable without manual intervention.

Use Cases

Solo Founder Shipping Features Overnight

Describe a feature to the Secretary agent. It spawns a PM agent who breaks it into subtasks. A Developer agent writes code. A Reviewer agent checks for issues. By morning, it’s merged.

Content Pipeline That Never Stops

A Researcher agent scans 200+ sources for trends. A Writer agent produces articles. An Editor agent refines tone. An SEO agent optimizes. All posted to X/Twitter, LinkedIn, Zhihu, Xiaohongshu — automatically.

Incident Response in Minutes

Monitor flags an anomaly. An Analyst agent correlates logs. A Triage agent classifies severity. A Developer agent pushes a hotfix. A Reviewer agent approves in under 3 minutes.

Why Open Source Matters

  • You own your data — local-first SQLite, no data leaves your infrastructure
  • No API tax — bring your own LLM API keys
  • Extensible — add custom skills, new agent roles, custom bridges
  • Community-driven — 20+ roles and growing, contributed by real users

Getting Involved

  1. Star the repo — github.com/markus-global/markus
  2. Try it — curl -fsSL https://markus.global/install.sh | bash
  3. Join the community — the project is actively developed with real users shipping real work

I’ve been running Markus for a few weeks now. The “describe and approve” workflow takes some getting used to — it feels weird to not micromanage. But the productivity boost is real. My solo output now looks like what a small team would ship.

Give it a shot. Your future AI employees are waiting to be hired.

I built a tool that detects broken security headers, missing robots.txt, and WP_DEBUG=true — then opens a PR to fix them automatically

Every agency I’ve talked to has the same story.

Client calls on a Friday. Site is down or flagged by Google Search Console. You SSH in, find WP_DEBUG = true in production, turn it off, deploy, done. Twenty minutes gone. Next week, different client, same thing.

I run a small web agency tool called SiteBrief — it monitors uptime, SSL, PageSpeed, SEO, and security headers across client sites. After six months of watching the same issues appear on the same types of sites, I built DevLab: a section that not only detects problems but generates the fix and opens a GitHub PR (or GitLab MR) for your review.

The workflow

Detect → Explain → Preview fix → Open PR → You approve

  1. Detect — SiteBrief continuously scans for security header gaps, SEO problems, PageSpeed issues, WordPress misconfigs, broken crawl settings
  2. Explain — every issue gets a plain-English description, severity level, and a confidence score (more on that below)
  3. Preview fix — click “Preview fix” and you see the exact file, the exact change, and what it will do — before anything happens
  4. Open PR — confirm in the modal, SiteBrief opens a pull request on your repo with a descriptive title, full context in the body, and a dedicated fix branch
  5. You approve — review the diff on GitHub/GitLab as you normally would. Nothing merges automatically.

Confidence scores

This was the part I spent the most time thinking about. “AI generates fixes” sounds scary. The honest answer is: some fixes are deterministic (swap true for false in one line), others are educated guesses (write an SEO title for a site you’ve never seen).

So every fix has a confidence score:
Issue Fix Confidence
WP_DEBUG = true in production define(‘WP_DEBUG’, false) in wp-config.php 95%
robots.txt missing Valid file with User-agent: * / Allow: / + Sitemap URL 90%
Missing security headers HSTS, X-Frame-Options, CSP, X-Content-Type-Options 88%
Missing viewport / canonical Correct meta tag added 85%
No cache headers (PageSpeed) Cache-Control: max-age=31536000 for static assets 75%
Missing SEO title / description Placeholder based on site name — needs your review 62%

Green (≥85%) = safe to merge after a quick look. Amber (≥70%) = test on staging. Orange (<70%) = treat as a starting point, edit before merging.

Auto-detecting the right file
One thing I didn’t want to do: assume everyone is on Netlify.

When DevLab generates a security header fix, it reads your repo and tries candidate files in order:

netlify.toml → adds a [[headers]] block
.htaccess → adds Header always set inside mod_headers
nginx.conf (or nginx/default.conf) → injects add_header into the server block
For SEO fixes it detects the framework:

Next.js App Router → edits app/layout.tsx using the metadata export
Plain HTML → injects tags into

Why I built the preview step
My first instinct was to make “Generate PR” a single button. Ship it, done.

Then I showed it to three agency owners. All three asked: “But what exactly is it going to change?” That was the signal. Nobody wants a black box touching client repos.

So now the flow is:

Click “Preview fix”
Modal shows: action description, exact file path, confidence bar with color coding, a safety note (“this adds headers to netlify.toml — it will not touch your application code”), and the “Nothing merges automatically” guarantee
Click “Open PR” to proceed — or just close the modal
The PR opens on a dedicated branch (sitebrief/fix-security-headers style), so it’s isolated and easy to close if you change your mind.

One-click rollback
If you open a PR and then decide against it, there’s a Close button directly in the DevLab history panel. It calls GitHub’s PATCH /pulls/{number} (state: closed) or GitLab’s PUT /merge_requests/{iid} (state_event: close) and marks the fix as rolled back in our records.

No need to go to GitHub just to close a PR.

What’s next
Short-term:

Staging branch deploys — open the fix PR against a staging branch, not main
Dependency security updates — scan package.json / composer.json, PR with safe version bumps
Scheduled digest — weekly email: all issues + open fix PRs across your portfolio

If you run a dev shop with multiple client sites and you’re tired of playing whack-a-mole with the same misconfigs every month — that’s exactly who DevLab is for.

Happy to answer questions about the implementation, the PR flow, or how the file detection works.

SiteBrief is in early access — sitebrief.io

https://sitebrief.net/

NIST Just Exposed the Age Estimation Number Vendors Don’t Want You to See

NIST’s latest biometric age estimation report highlights a shift that should fundamentally change how we build and deploy facial analysis systems. For years, the industry has chased a single, aggregate accuracy number. But the newest data from the National Institute of Standards and Technology (NIST) suggests that the “headline” accuracy is becoming less important than the demographic distribution of error.

For developers working with computer vision and biometrics, the most critical number in the report is 0.017—the lowest false positive rate recorded in the Challenge 25 age assurance scenario. However, the technical takeaway isn’t just about achieving lower false positives; it’s about the Mean Absolute Error (MAE) across different demographic groups.

The Problem with Aggregate Accuracy

In most machine learning contexts, we celebrate a 95% or 98% accuracy rate. But in biometric facial analysis, a high aggregate accuracy can act as a mask for systematic failures in specific subpopulations. If a model is 99% accurate on 90% of the population but fails 30% of the time on the remaining 10%, that isn’t a “highly accurate” model—it’s a liability.

The May 2026 NIST update forces a transition from looking at “global” accuracy to looking at “disaggregated” performance. We are seeing a move toward measuring how much the performance gap shrinks between gender, ethnicity, and regional demographics. For instance, the report highlights that the most sophisticated models are now pushing their error rates for historically underrepresented groups below the 3.5-year threshold. This isn’t just better training; it’s a shift in how the weights are being optimized within the neural networks to prioritize consistency over a raw average.

Why “Know Your Algorithm” is a Technical Mandate

NIST’s guidance is clear: “Know your algorithm.” This is a direct challenge to developers who treat biometric models as black-box APIs. When you are deploying facial comparison or estimation tools, you need to understand the Euclidean distance analysis and the underlying training data distribution.

At CaraComp, we focus on facial comparison—the side-by-side analysis of specific images—rather than broad-scale crowd scanning. The technical reason for this is grounded in the same reality NIST is highlighting: accuracy depends on the context of the data.

If you are developing software for investigators or forensic professionals, you can no longer afford to ignore demographic variance. A system that systematically underestimates ages for a specific demographic could lead to catastrophic errors in a case. For developers, this means the procurement and testing phase must involve stress-testing models against the “demographic extremes” rather than just checking the global MAE.

Benchmarks vs. The Real-World Deployment Gap

The gap between a NIST benchmark and a real-world investigator’s desktop is massive. Benchmarks typically use controlled, high-quality images. In the field, we deal with:

  • Sub-optimal lighting (low lux environments)
  • Severe facial occlusion (hats, glasses, masks)
  • Extreme camera angles and perspective distortion

The NIST IR 8525 technical report provides the methodology for how mean error calculations work across these subgroups. Developers should be looking at these methodologies to build their own internal validation pipelines. If your model hasn’t been validated against demographic cues—where skin texture changes and facial structures evolve differently across populations—it isn’t ready for professional investigative use.

As age assurance and facial analysis move from “cool tech” to legal requirements under frameworks like the UK’s Online Safety Act, the ability to explain the distribution of your model’s error will be the difference between a reliable tool and a legal risk.

When you are evaluating a new biometric model for your tech stack, do you prioritize the highest overall accuracy score or the smallest performance gap between demographic subgroups?

The 4L’s of Logging — The New Standard for the AI Era

Use cases enabled by long-term retention

Authored by Noel Ruane & Trevor Parsons

Traditionally, the world of logging had 3L’s — low cost, low latency, and large scale — and the accepted wisdom was that you’d have to compromise by choosing two of the three.

Until recently, the logging market bore this out. Solutions fell into one of three categories:

  • Expensive and fast — Datadog, ELK-type solutions
  • Slow and cheap(er) — index-free solutions like Grafana Loki (still relatively expensive when you actually search)
  • Tweeners — expensive, relatively slow, not great at scale — think CloudWatch, Google Cloud Logging

Anyone who’s ever hired builders knows the iron rule: fast, cheap, or quality — pick two.

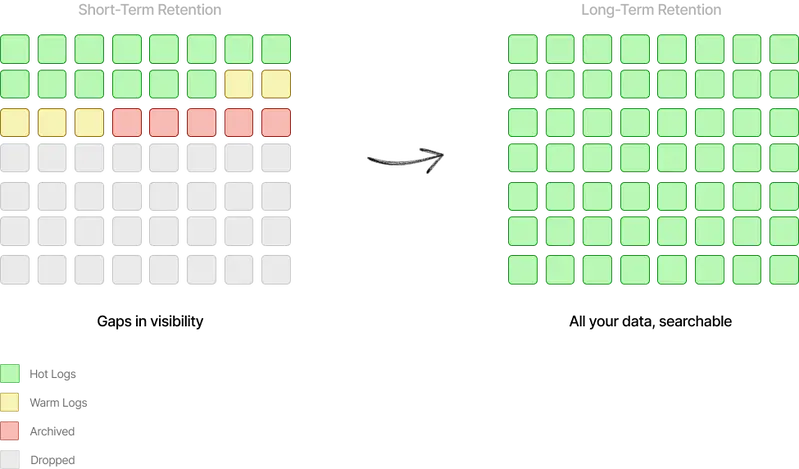
But the world has changed with the arrival of AI. As everyone builds and innovates around LLMs and agents, achieving all three L’s has become more essential than ever. And AI has added a fourth requirement to the list: long-term retention.

3 Becomes 4: What Long-Term Retention Opens Up

With a short retention window — 3, 15, or 30 days, as most solutions provide — logs are accessible only for outages and system issues severe enough to warrant immediate attention.

Long-term retention opens up an entirely new set of use cases.

Use cases enabled by long-term retention

A common example: comparing customer API request latencies or conversion metrics month-on-month, looking at seasonality effects, or preparing data for a customer QBR. You might want to analyze customers in aggregate to spot trends, or drill into a specific customer’s history.

Long-term data analysis example

Support issues can be recent or ongoing over months. Being able to look beyond a few days of data is often the difference between resolving a customer issue properly and leaving it half-answered.

In an AI world where agents can interrogate your data and solve problems at a completely different scale, long-term hot retention is essential — not the cumbersome, costly process of rehydrating logs from archives that most providers offer. The common workaround of dumping logs to S3 and spinning up Athena is another great example of the kind of toil that shouldn’t exist in modern logging.

The importance of long-term hot data is borne out by our own customers: the longer the data retention, the more use cases open up, the longer the time periods searched, and the more value customers extract from their data. This value will only increase as agents become more powerful.

Retention vs. value curve

The 4L’s Set a New Standard for the AI Era

Microsoft’s Satya Nadella put it well: AI is at the intersection of where intelligence meets data. If you don’t have the data, you can’t point AI at it. The new requirements for data in the AI era map directly to the 4L’s:

  • Large Scale — data that is always and easily accessible
  • Long-Term Retention — data retained so AI can analyze it and take action on it
  • Low Cost — storage and search must be cost-efficient as volumes see exponential growth
  • Low Latency — fast search and querying

As Bessemer Venture Partners notes in their Roadmap for AI Infrastructure, the volume of unstructured data is projected to reach 612 zettabytes by 2030, driven by ML/AI and synthetic data generation. Log data is one specific type where this applies acutely.

Here’s why logging requirements are intensifying in the AI era:

Systems of action are replacing systems of record. As AI-native apps don’t just store data but act on it, having log data accessible and hot means AI models can actually do something meaningful with it. The era of retaining logs for 30 days and locking them in cold storage is ending.

AI-led Root Cause Analysis. We’re already seeing AIs perform RCA using log data to help teams solve problems faster. BrontoScope, for example, automatically runs an investigation that assesses how widespread an error is — figuring out what queries to run, assessing results, running further queries, and delivering an immediate assessment with recommendations. It can save anywhere from minutes to hours per incident. As MCP becomes standard, log data will be analyzable with additional context from other systems — replicating what engineers do manually today when piecing together evidence.

LLMs are non-deterministic. Given the unpredictable nature of LLMs, logs will play an even more important role in understanding what happened — whether from a support, debugging, audit, security, or compliance perspective. The same action can deliver different results, making logs essential for showing exactly what occurred. (See our guide to collecting Ollama logs to get started.)

Regulation. EU AI Act Article 19, for example, will require logs of certain higher-risk AI systems to be retained for at least 6 months from 2026.

A Purpose-Built Adaptive Technology for Log Data

How do you actually achieve all 4L’s? The short answer: treat logs as a first-class citizen and build a purpose-built data store for them.

Until now, vendors have always repurposed existing datastores for logging:

  • Elasticsearch — at the core of most logging solutions for two decades. Super fast because it indexes everything, but super expensive due to data bloat and operational complexity.
  • ClickHouse — more recently vendors have turned to ClickHouse. Great for metrics, good for some logs — but only if you know the shape of your data in advance, which is a non-starter for a general-purpose logging platform. (Full write-up: Why ClickHouse fails as a general-purpose logging solution)
  • Snowflake — vendors like Observe have turned to Snowflake to address the cost problem, but customers regularly report search latency issues and burning through CPU credits when searching large data volumes.

The key learning from two decades in this space: not all log data should be treated equally. Don’t just “index everything” (inverted indexes) or at the other extreme “index nothing” (index-free solutions). Instead, take a more thoughtful approach — let the system adapt and optimize based on the shape of your data and the queries you run.

These optimizations operate at every layer:

Indexing: We combine multiple patent-pending adaptive compact indexes. The platform automatically decides which to apply based on data and query patterns. Techniques include Bloom filters, summary indexes, partition indexing, automatic log-to-metric conversion, and additional patent-pending technologies.

Storage: Our storage tier routes data to the most appropriate structure based on its shape and how it will be searched — columnar store, specialized data structures, high compression, partial decoding, and storage tier coordination.

Search: Specialized algorithms applied depending on the query being run, highly parallelized to operate at any scale.

For deeper reading: Why Bronto is so fast at searching logs, or the Log Management Cost Trap series — Part 1: Ingestion, Part 2: Storage, Part 3: Search.

No Maintenance Required

One important point often overlooked: we see vendors trying to solve the cost problem by deploying within an organization’s cloud (BYOC), using the customer’s hardware to reduce costs. This requires deploying a logging platform into your environment and having the vendor manage it there. Unless you have tight data regulations, this feels like an overly complex backward step.

Bronto is built on a modern cloud multi-tenanted architecture. No setup, no maintenance, no management required by the customer. We take advantage of compute/storage separation and independently scaling services.

AI = the Intersection of Intelligence and Data

If your current provider is building AI capabilities on top of an old, repurposed, or expensive logging platform — one with 2 L’s instead of 4 — you won’t be able to take full advantage of the AI revolution.

The 4L’s aren’t a nice-to-have. In the AI era, they’re the baseline.

See the 4L’s in Action

Puppet Core 8.19 and PDK 3.7: Security Updates, Dependency Changes, and Windows Fixes

Puppet Core 8.19.0 focuses largely on security hardening, with some dependency cleanup and a small but important fix for Windows user management.

If you already run Puppet Core 8, this release is primarily about keeping your runtime secure and predictable, rather than introducing new workflows or configuration changes.

➡️ Full details: Puppet Core 8.19.0 release notes

PDK 3.7.0 was also released to improve performance on Windows, update dependencies, and provide other updates for security and known issues.

➡️ Full details: PDK 3.7.0 release notes

CSV gem dependency removed

Puppet Core no longer depends on the CSV Ruby gem.

  • Removes an external dependency from the Puppet runtime
  • Reduces overall dependency surface area
  • Simplifies installation and long-term maintenance

This change does not alter Puppet DSL behavior or require configuration changes.

Security updates

Puppet Core 8.19.0 updates several bundled runtime components to address recently disclosed security vulnerabilities. These updates apply automatically when you upgrade.

  • Ruby updated to 3.2.11 (CVE-2026-27820)
  • OpenSSL updated to 3.0.20 (CVE-2026-28387, CVE-2026-28388, CVE-2026-28389, CVE-2026-28390, CVE-2026-31789, CVE-2026-31790)
  • libxml2 updated to 2.15.3 (CVE-2026-6732)
  • curl updated to 8.20.0 (CVE-2026-6253, CVE-2026-6276, CVE-2026-6429, CVE-2026-7009, CVE-2026-7168)
  • net-imap updated to 0.4.24 (CVE-2026-42245, CVE-2026-42246, CVE-2026-42256, CVE-2026-42257, CVE-2026-42258)
  • erb updated to 6.0.4 (CVE-2026-41316)

ℹ️ Important note for net-imap users

If you use net-imap directly in custom Ruby code, the updated version enforces stricter argument validation. Check the release notes for some details on how to manage this gem if you cannot use the upgraded version of net-imap.

Windows user passwords now allow colons

When managing user resources on Windows, Puppet Core no longer rejects passwords containing colons (:).

  • Affects Windows platforms only
  • Behavior on other platforms is unchanged

This prevents unnecessary failures when managing Windows accounts with valid password formats.

Installation safeguards for Ruby versions

Puppet Core now prevents installation on unsupported Ruby versions.

  • Puppet Core 8 enforces a maximum supported Ruby version of 3.x
  • Prevents installation attempts using unsupported versions (such as Ruby 4)
  • Protects against installation failures like can't modify frozen Hash

This applies when installing Puppet Core via bundler or gem commands.

PDK 3.7.0 changes

This version of PDK was updated to help prevent security issues and reduce test failures, and made macOS 15 downloads available.

  • Rexml updated to version 3.4.4 to address CVE-2025-58767
  • macOS 15 downloads now available
  • Windows performance has been improved
  • YAML file validation issues should be resolved
  • Several puppet_forge gems and dependencies were updated

Should you upgrade?

Upgrading to Puppet Core 8.19.0 is recommended for Puppet Core 8.x users if:

  • You want current security fixes for bundled runtime dependencies
  • You manage Windows users with complex passwords
  • You want to avoid accidental installation on unsupported Ruby versions

Want to get started? Here are the install/upgrade guides:

For full details and CVE listings, see the release notes:

➡️ Puppet Core 8.19.0 release notes
➡️ PDK 3.7.0 release notes

10 Linux Commands That Made the Terminal Less Scary for Me

I still remember the exact moment I opened the Linux terminal for the first time.

Black screen. Blinking cursor. Absolute silence.

No icons, no buttons, no “click here to continue.” Just this tiny blinking thing waiting for me to type something — anything — and I had absolutely no idea what to say to it.

My first reaction, honestly? I closed it.

Then I opened it again because I felt embarrassed closing it, even though I was alone.

I ended up doing what every beginner does: copying random commands from Stack Overflow without really understanding what they did. Sometimes things worked. Sometimes I’d accidentally delete a file I needed. Once I somehow broke my entire home directory setup and had to reinstall things.

But here’s what I eventually figured out — Linux wasn’t hard because it was complicated. It was hard because it was unfamiliar. Once a few commands started making sense, the whole thing clicked differently.

If you’re a CS student, a beginner dev, or someone just getting into backend or DevOps, here are the 10 commands that genuinely made the terminal less terrifying for me.

First, Why Does Linux Even Matter?

Honestly, for a while I thought Linux was one of those “nice to have” skills that senior devs recommend but you can probably skip.

You can’t really skip it.

Servers run Linux. Cloud infrastructure runs Linux. Docker, DevOps pipelines, most backend environments — Linux is just quietly everywhere. At some point it stops being optional and becomes part of your actual workflow.

The good news is you don’t need to learn hundreds of commands to feel comfortable. You just need a solid handful to start.

1. pwd — “Wait, Where Am I?”

The terminal doesn’t show you where you are by default. That’s confusing at first.

pwd

This prints your current working directory — basically your location in the file system. It stands for print working directory.

I used this constantly when I was learning. Still use it more than I’d like to admit.

2. ls — See What’s Around You

Want to see what files and folders are in your current location?

ls

Want more details like file sizes and permissions?

ls -l

Want to also see hidden files (files that start with a dot)?

ls -la

ls becomes muscle memory pretty fast. You’ll type it without thinking after a week.

3. cd — Actually Move Around

Navigation. This one’s essential.

cd Documents

Go back one level:

cd ..

Jump straight to your home directory:

cd ~

Once you get used to cd, clicking through folders in a file manager starts feeling weirdly slow. It’s one of those small things that makes the terminal feel worth it.

4. mkdir — Create a Folder Without the Right-Click

mkdir my-project

That’s it. New folder, done.

No right-clicking, no naming dialog box, no confirmation window. Just instant. Linux really does value speed and efficiency, and mkdir is a small example of that.

5. touch — Create an Empty File

Need a new file quickly?

touch index.html
touch app.py

It creates an empty file with that name. Nothing fancy, but when you’re setting up a project structure, this saves you a surprising amount of time.

6. cp and mv — Copy, Move, and Rename

Copy a file:

cp notes.txt notes-backup.txt

Move a file to a different folder:

mv notes.txt ~/Documents/notes.txt

Rename a file (it’s the same command, just staying in the same place):

mv old-name.txt new-name.txt

The rename thing tripped me up for a bit — I kept looking for a separate rename command. Turns out mv just does it.

7. rm — Delete Things (Carefully)

Delete a file:

rm file.txt

Delete a folder and everything inside it:

rm -r foldername

Important heads-up: Linux usually won’t ask if you’re sure. It just deletes. No trash bin, no undo.

This is how beginners learn to be careful. Usually after losing something they needed.

If you want it to prompt you before deleting, you can use rm -i, but honestly most people just learn the habit of double-checking before they run it.

8. cat — Read a File Without Opening an Editor

cat notes.txt

This just prints the file contents straight into your terminal. Super useful for quickly checking configs, reading log files, or just seeing what’s in something without bothering to open a text editor.

It’s one of those commands that seems almost too simple at first, then you realize you’re using it constantly.

9. grep — Search Inside Files

This one felt like a superpower once I actually understood it.

grep "error" logs.txt

This searches through logs.txt and shows you every line that contains the word “error.”

Once you start debugging real applications or reading through server logs, grep becomes one of your most-used tools. You can search through hundreds of lines instantly instead of scrolling through everything manually.

You can also combine it with other commands using pipes, but that’s a rabbit hole for another day.

10. history — Your Terminal Remembers Everything

Forgot a command you typed earlier?

history

This shows your command history. Every command you’ve run, listed out.

You can also press the Up arrow to cycle through recent commands one by one, which I use constantly.

history has saved me more times than I can count — especially when I’ve run some complex command that worked, and then immediately forgot what I typed.

🎁 Bonus: man — The Manual That’s Actually Built Into the Terminal

This one I wish someone had told me about on day one.

Every time I didn’t understand what a command did or what flags were available, I’d go Google it. That works fine, but there’s a faster option that’s always right there:

man ls
man grep

man stands for manual. It opens the official documentation for whatever command you pass it — right inside the terminal, no browser needed.

So instead of searching “ls command options linux,” you can just type man ls and get the full breakdown: what the command does, every available flag, examples, all of it.

Use the arrow keys to scroll, and press q to quit and go back to your terminal.

Fair warning: man pages are pretty dense and not exactly written for beginners. But once you get used to the format, it’s genuinely useful — especially when you’re working on a remote server with no internet access and need to look something up.

It’s also just a good habit. Gets you comfortable reading documentation instead of always reaching for a tutorial.

What the Terminal Actually Teaches You

When I started, I thought learning Linux was about memorizing commands. The more time I spent in the terminal, the more I realized it’s teaching you something else.

It teaches you how computers actually work. Files, permissions, processes, how things are structured under the hood. GUI applications hide all of this. The terminal just shows it to you directly.

You don’t need to become an expert overnight. Just open the terminal, use it a little every day, and experiment. Break things, fix them, look stuff up. It gets less intimidating pretty quickly.

Everyone who looks comfortable in the terminal today was once staring at that same blinking cursor thinking, “I have no idea what I’m doing.”

The cursor was just waiting for a first command.

What was your first terminal experience like? Was there a command that finally made things click for you? Drop it in the comments — I’d love to know.

Trace Continuity vs Mem0 vs Zep: AI Memory Governance Compared

Mem0 and Zep are solid memory retrievers. But neither solves governance. Here’s the technical breakdown of what that gap means if you’re building AI agents in regulated environments.

The question developers are actually asking in 2026

The AI memory market has consolidated. Mem0 and Zep are the two best-known players. Well-funded, well-documented, widely used.

But there’s a different question under the surface in enterprise evaluations: “What happens to the data?”

  • Who has access to what agents remember?
  • Can we prove we deleted a user’s data when they asked?
  • Is PII getting stored in our AI memory layer without us knowing?
  • Can our compliance team audit what the agent knew and when?

Mem0 and Zep don’t have great answers to those questions. That’s not a knock — it’s a design choice. They built memory retrieval infrastructure. Governance was not the problem they were solving.

This comparison is for developers evaluating all three options with compliance in the picture.

The short version

Trace Continuity Mem0 Zep
Best for Regulated industries, compliance-first teams Fast onboarding, broad ecosystem Temporal reasoning, knowledge graphs
PII auto-redaction ✅ Pre-storage, 15+ types ❌ Not a feature ❌ Not a feature
Retention policies ✅ Configurable TTL, auto-expiry ❌ Not available ❌ Not a feature
Audit logging ✅ Every read/write/delete ❌ None ❌ None
Multi-tenant isolation ✅ Architecture-level ⚠️ Namespace-level ⚠️ Application-level
GDPR deletion proof ✅ Immutable deletion record ❌ Manual ❌ Manual
Free tier ✅ Generous ✅ 10K memories ⚠️ 1,000 credits (minimal)

Memory storage: all three solve the same retrieval problem

Mem0

Mem0’s core is a vector store with an extraction layer. When you call client.add(), it runs the conversation through an LLM that extracts key facts, stores them as embeddings, and resolves conflicts. client.search() retrieves by semantic similarity.

const client = new MemoryClient({ api_key: process.env.MEM0_API_KEY });
await client.add("User prefers concise responses and hates jargon", { user_id: "alice" });
const memories = await client.search("communication style", { user_id: "alice" });

Excellent for personalization. The ecosystem breadth — 21 framework integrations, MCP server, AWS Bedrock, LangChain, CrewAI — is unmatched. Graph memory (Pro tier, $249/mo) is the most-cited developer complaint.

Zep

Zep’s differentiator is Graphiti — a temporal knowledge graph where every fact has a validity window. “Alice is the project lead” becomes a node with a start time. When Alice steps down, the old fact is invalidated (not deleted). This enables temporal reasoning: “What did the agent know about Alice’s role last quarter?”

await zep_client.thread.add_messages(thread_id, messages=[
    Message(name="Alice", role="user", content="I'm stepping down as project lead next month.")
])
context = zep_client.thread.get_user_context(thread_id="thread_id", mode="basic")

Zep scores 63.8% on LongMemEval vs Mem0’s 49.0% — a real gap for temporal reasoning tasks. Trade-off: Community Edition deprecated April 2025, self-hosting now requires Graphiti + graph database operational overhead.

Trace Continuity

Trace Continuity stores memories as text with semantic search for retrieval. The focus is what happens to data before and after storage: who redacted what, who accessed what, when things expire.

const response = await fetch('https://tracecontinuity.com/v1/memories', {
  method: 'POST',
  headers: { 'Authorization': `Bearer ${process.env.TCL_API_KEY}`, 'Content-Type': 'application/json' },
  body: JSON.stringify({
    content: "Patient John Smith (SSN 078-05-1120) prefers morning appointments.",
    agent_id: "intake-bot",
    ttl_days: 365
  })
});
// What gets stored: "Patient [REDACTED] prefers morning appointments."
// Governance events logged: PII_REDACTED (SSN), PII_REDACTED (name)
// TTL set: auto-expires after 365 days

One API call. Every governance action happens automatically.

The governance gap: what neither competitor solves

PII redaction

In a healthcare or fintech context, your AI agents receive inputs that may contain SSNs, credit card numbers, email addresses, dates of birth, names — and that context gets stored as memory.

Neither Mem0 nor Zep runs a PII scan before storage. If your agent passes “Patient DOB: 1978-04-15, SSN: 078-05-1120” to Mem0’s add(), that data enters the vector store as-is.

Trace Continuity runs PII redaction as part of the write path — before anything touches storage. The original text never reaches the database.

Retention policies

Neither Mem0 nor Zep has configurable retention policies as a product feature. You can delete memories manually, but there’s no “expire memories after 90 days” capability built in.

Trace Continuity enforces TTL at the infrastructure layer. Set ttl_days: 90 and the memory auto-purges. Per-tenant policies can enforce maximum retention regardless of what individual agents specify.

Audit logging

With Mem0 or Zep, the answer to “show me every time an AI agent accessed patient memory records last quarter” is: “We don’t have that.”

With Trace Continuity, every read, write, and delete generates an immutable governance event: agent ID, tenant, timestamp, action type, what was redacted.

Multi-tenant isolation

Mem0 uses namespace-level isolation (user_id or app_id parameters). If the application layer passes the wrong user ID — memories can leak across tenants.

Trace Continuity enforces isolation at the architecture layer. The API key itself is scoped to a tenant. A mismatch returns a 403 — not a filtered result, a hard rejection.

The code comparison

Mem0 — writing memory:

await client.add([{ role: "user", content: userInput }], { user_id: userId });
// Stored as-is. No PII scan. No TTL. No audit record.

Zep — writing memory:

await zep.thread.add_messages(thread_id, messages=[Message(role="user", content=user_input)])
# Stored in temporal knowledge graph. No PII scan. No TTL. No audit record.

Trace Continuity — writing memory:

const res = await fetch('https://tracecontinuity.com/v1/memories', {
  method: 'POST',
  headers: { 'Authorization': `Bearer ${apiKey}`, 'Content-Type': 'application/json' },
  body: JSON.stringify({ content: userInput, agent_id: agentId, ttl_days: 90 })
});
// PII scanned and redacted before storage.
// TTL set: auto-purge after 90 days.
// Governance event logged: who wrote what, when, what was redacted.
// Tenant isolation enforced at the API key layer.

The code differences reflect the architecture. You can’t bolt these capabilities onto Mem0 or Zep in application code and get the same guarantee — the guarantee comes from the infrastructure running before your code can make mistakes.

When to use each

Choose Mem0 if: You need the fastest path to production, building a consumer product with no regulated data, need ecosystem breadth (LangChain, CrewAI, AWS Bedrock, Vercel AI). ~52K GitHub stars. The default choice when governance isn’t a constraint.

Choose Zep if: Temporal reasoning is core to your use case — facts that change over time, validity windows, superseded facts. Research tools or knowledge graph applications. LongMemEval advantage (63.8% vs 49.0%).

Choose Trace Continuity if: Building in healthcare, fintech, HR tech, legal, insurance, or government. Your compliance team is involved. You need PII handled before storage — not cleaned up afterward. You’ve been asked “how do we handle memory deletion requests?” by a lawyer or auditor.

Pricing summary

Trace Continuity Mem0 Zep
Free 500 memories, full governance 10K memories 1,000 credits
Entry paid $99/mo $19/mo (no graph) Usage-based
Graph memory Vector + semantic $249/mo (Pro) Included (Graphiti)
BAA available ✅ Enterprise ✅ Enterprise ✅ Enterprise

Governance is included at every Trace Continuity tier, not sold separately.

Bottom line

Mem0 = best-in-class general-purpose memory with minimal setup friction. Dominates on ecosystem and ease of use.

Zep = best-in-class for temporal knowledge graphs. When you need to model how facts evolve over time.

Trace Continuity = built for the question neither competitor was designed to answer: what happens to the data? If your answer to that question affects your company’s legal and compliance posture, it’s the right infrastructure.

Try the Playground to test PII redaction in 30 seconds — no API key required. Or get started free →.

Originally published on Trace Continuity Labs

Claude-ITect-Skills

I’ve been trying to make a personalized skill pack (but it’s all timey-whimey) and would love to hear from everyone’s feedback. I am trying to make this skill pack customize itself to the project you place it in. When you install, then run the /audit command, it executes a series of commands in the background (and foreground), to update itself and your other skills to be aligned with your actual project goals and ensure you have what you need. There are other personality features as well but let’s not give it away here….spoilers!

GitHub logo

jchildree
/
Claud-itect-Skill

A curated skill pack for Claude Code. Installs 48 skills, 4 agent definitions, caveman session hooks into any project in one command, and thefuck fixes any mistakes that occur….when you need it.

v2_watermarked-b7140b17-61e1-49ca-91d1-951ab140b39b

Claude-ITect-Skill

A personalized curated skill pack for Claude Code. Installs 48 skills, 4 agent definitions, caveman session hooks into any project in one command, and thefuck fixes any mistakes that occur….when you need it. But the real magic happens during setup. So give it a shot, and let me know what could be better!

After installation start with running:

  • audit

Prerequisites

Install

Windows

  1. Open PowerShell (search “PowerShell” in the Start menu).
  2. Navigate to your project:
    cd "C:pathtoyourproject"
  3. Run the installer — replace the path with wherever you saved the skill pack:
    powershell -ExecutionPolicy Bypass -File "C:pathtoClaude-ITect-Skill-2install.ps1"

    To install into a specific project instead of the current directory:

    powershell -ExecutionPolicy Bypass -File "C:pathtoClaude-ITect-Skill-2install.ps1" -ProjectPath "C:pathtoyourproject"
Flag Effect
-Force Overwrite skills that already exist
-SkipHooks

…

Authentication Looks Easy – Until You Build It for Real Users

Most authentication systems don’t fail because developers can’t implement login. They fail because production security is very different from tutorial security.

What I learned after moving beyond tutorial-style authentication systems.

Every developer thinks authentication is easy.

Until they build it for real users.

The tutorials make it feel simple:

  • create JWT,
  • verify token,
  • protect routes,
  • done.

And technically?

That works.

But production authentication is not just about making login functional.

It’s about:

  • managing trust,
  • controlling sessions,
  • handling compromise,
  • preventing abuse,
  • and designing systems that remain secure after things go wrong.

That’s the part most tutorials never teach.

And that’s where most authentication systems quietly fail.

“A login system that works is not the same thing as a secure authentication system.”

The Tutorial Trap

Most developers learn authentication from tutorials.

Which makes sense.

Tutorials are optimized for:

  • simplicity,
  • speed,
  • and getting something working quickly.

But production systems operate under completely different constraints.

Real authentication systems need to handle:

  • stolen tokens,
  • leaked sessions,
  • password reset abuse,
  • brute force attacks,
  • session revocation,
  • suspicious devices,
  • and compromised accounts.

Tutorial authentication teaches:

“How to sign users in.”

Production authentication asks:

“What happens after trust is compromised?”

That is a completely different mindset.

Storing JWTs in localStorage

This is still one of the most common mistakes in modern web applications.

And it usually happens because localStorage feels convenient.

You login.

Store the token.

Read it later.

Simple.

The problem is that anything running JavaScript on your page can access it.

That includes:

  • malicious scripts,
  • compromised third-party libraries,
  • XSS vulnerabilities,
  • browser extensions,
  • or injected analytics code.

If attackers gain JavaScript execution inside your application, they can silently extract authentication tokens and impersonate users.

The application still appears normal.

The user never notices.

That’s what makes it dangerous.

A safer approach is using httpOnly cookies.

These cookies:

  • cannot be accessed by JavaScript,
  • are automatically handled by the browser,
  • and significantly reduce token theft risks from XSS attacks.

Yes, this introduces CSRF considerations.

But modern protections like:

  • SameSite,
  • secure cookies,
  • and CSRF tokens

make this a far safer tradeoff.

“Most authentication systems are not broken in obvious ways. They’re broken in ways teams discover only after incidents happen.”

Logout That Doesn’t Actually Log Users Out

This is one of the most misunderstood parts of JWT authentication.

A user clicks logout.

The frontend removes the token.

The UI redirects to the login page.

Everything looks correct.

Except the token itself may still be completely valid.

Because JWTs are stateless.

The server usually doesn’t “remember” them.

It simply validates the signature and expiration.

Which means:

  • stolen tokens can continue working,
  • copied sessions remain usable,
  • and logout often becomes a frontend illusion.

JWT solves authentication verification.

It does not automatically solve:

  • session revocation,
  • logout control,
  • or session management.

Production systems usually fix this using:

  • short-lived access tokens,
  • refresh token rotation,
  • token revocation,
  • or server-side session tracking.

Real logout means:

the session is no longer trusted by the server.

Not just hidden from the UI.

Refresh Tokens Are Often Implemented Without Understanding the Security Model

Many developers use refresh tokens mechanically.

Access token expires.

Refresh token generates a new one.

Done.

But the important question is:

what happens if the refresh token itself gets stolen?

If refresh tokens live for 30 days and there’s no revocation mechanism, attackers may retain access for an entire month without detection.

That’s why mature systems use refresh token rotation.

Every refresh:

  • issues a new refresh token,
  • invalidates the previous one,
  • and tracks suspicious reuse attempts.

This limits damage during token compromise and creates visibility into abnormal behavior.

Authentication systems should not just validate trust.

They should monitor trust.

“Forgot Password” Is a Massive Attack Surface

Password reset systems are often treated like convenience features.

They are not.

They are one of the most security-sensitive flows in any application.

And weak implementations are everywhere.

Common Problems

Reset tokens that live too long

Password reset links should expire quickly.

Not tomorrow.

Not next week.

Usually:

  • 15 minutes,
  • maybe 30.

Anything longer unnecessarily increases risk.

Reusable reset tokens

A password reset token should work once.

Only once.

If reset tokens remain reusable, they become persistent backdoors.

After a successful password reset:

  • the token should immediately expire,
  • active sessions should be revoked,
  • and refresh tokens should become invalid.

User enumeration vulnerabilities

Many systems accidentally reveal whether an account exists.

Responses like:

  • “Email not found”
  • “User does not exist”

allow attackers to discover registered accounts.

Production systems should always respond generically:

“If an account exists, a reset link has been sent.”

Regardless of whether the user actually exists.

“Most security problems begin where tutorials end.”

OTP Systems Are Harder Than They Look

OTP authentication appears simple.

Generate code.

Send code.

Verify code.

Done.

Except production OTP systems need to handle:

  • brute force attempts,
  • replay attacks,
  • abuse prevention,
  • expiration handling,
  • and delivery risks.

Without rate limiting, attackers can automate OTP guessing surprisingly quickly.

That’s why production systems need:

  • retry limits,
  • verification throttling,
  • expiration windows,
  • and lockout rules.

OTP reuse is another common issue.

Once an OTP is successfully verified:

it should immediately become invalid.

Not later.

Immediately.

And while SMS OTP is common, it’s also vulnerable to SIM swap attacks.

For higher-security systems:

  • authenticator apps,
  • TOTP,
  • and hardware security keys

are significantly safer options.

Session Tracking Should Be a First-Class Feature

Many applications have no visibility into active sessions.

Users cannot:

  • view logged-in devices,
  • revoke suspicious sessions,
  • monitor account activity,
  • or control session access.

That’s not just missing functionality.

It’s missing security visibility.

Production systems should track:

  • session IDs,
  • devices,
  • timestamps,
  • IP addresses,
  • refresh token mappings,
  • and revocation state.

This enables:

  • device-level logout,
  • anomaly detection,
  • suspicious session monitoring,
  • and better account recovery flows.

Purely stateless authentication sounds elegant.

Until you need actual control.

The Biggest Missing Layer: Security Thinking

Most authentication failures are not caused by poor coding skills.

They happen because developers design for the happy path.

Users login.

Users logout.

Users reset passwords.

Everything works.

But attackers don’t follow happy paths.

Real authentication design starts with uncomfortable questions:

  • What happens if tokens get stolen?
  • What happens if someone brute forces OTP verification?
  • What happens if refresh tokens leak?
  • What happens if sessions never expire?
  • What happens if attackers abuse password reset endpoints?

If those questions were never considered during system design, the application probably has dangerous gaps.

security

backend

webdev

authentication

jwt

“Authentication is not just about verifying identity. It’s about controlling trust securely over time.”

Closing Thoughts

Authentication is one of the few engineering areas where users pay the price for developer shortcuts.

A broken UI might frustrate users.

A broken authentication system can compromise identities, expose sensitive data, and permanently damage trust.

And the dangerous part is that insecure authentication often appears perfectly functional.

The login works.

The JWT validates.

The session continues.

Everything looks fine.

Until it isn’t.

The good news is that secure authentication practices are already well understood:

  • short-lived access tokens,
  • refresh token rotation,
  • secure cookie handling,
  • session revocation,
  • OTP rate limiting,
  • reset token expiration,
  • and security event logging.

None of this is exotic engineering.

It simply requires treating authentication as a real security system instead of a checklist item before building “real features.”

“Authentication is not a feature. It is a long-term trust contract between your system and your users.”

The difference between tutorial authentication and production authentication is the difference between building a demo and building something people can safely trust with their identity.