I Built a Free Stock Market Game You Can Play Right Now — No Login, No Download

What if you could play the stock market like a game without risking a single dollar?

That is exactly what I built. It is a free online stock market game that runs right in your browser — no login, no download, no signup wall.

Just open it and start trading: vinish.dev/stock-market-game-online

The Concept

The idea is simple.

You start with virtual cash and your goal is to grow your portfolio by buying and selling stocks.

Prices move, the market shifts, and you have to make decisions fast. It feels a lot like a strategy game, except everything is based on how real stock markets actually work.

Why It Feels Like a Game

Most finance simulators feel like homework.

This one does not.

Here is what makes the experience feel more like gameplay:

  • You start fresh every session with a set amount of virtual money
  • Stock prices move dynamically so the market is always changing
  • You can buy and sell with a single click — no complex order forms
  • Your portfolio value updates in real time as prices shift
  • There is a competitive angle — you can challenge yourself to beat your previous best

“The stock market is a device for transferring money from the impatient to the patient.” — Warren Buffett

The game actually teaches you that lesson firsthand. Rush in without a plan and your portfolio tanks. Think strategically and you start to see real gains.

Who Is This For

This game is a good fit for a few different types of players:

Player Type Why They Will Enjoy It
Gamers curious about finance Learn how stocks work through actual gameplay
Beginners afraid to invest real money Practice without any financial risk
Students studying economics Hands-on simulation with no setup required
Competitive types Try to beat your high score each session
Anyone who is just bored It is genuinely fun to watch your virtual money grow

How to Play

Getting started takes about 10 seconds.

  1. Go to vinish.dev/stock-market-game-online
  2. You get a starting amount of virtual cash automatically
  3. Browse the available stocks and their current prices
  4. Buy shares in the ones you think will go up
  5. Sell when the price rises to lock in your profit
  6. Watch your portfolio value in real time

No tutorials, no lengthy onboarding. You figure it out by playing, which is the best way to learn anything.

What You Actually Learn While Playing

The game sneaks in some real finance knowledge while you are just having fun.

After a few sessions you start to naturally understand:

  • What a portfolio is and how diversification helps
  • Why timing matters when buying and selling
  • How market volatility can work for you or against you
  • The difference between a gain and a loss on paper vs locking it in
  • Why patience usually beats panic selling

It is surprisingly educational without ever feeling like a lecture.

The Best Part: No Login Required

A lot of browser games hit you with an account wall before you can even see what the game looks like.

This one has zero friction.

You land on the page and you are already playing. No email address, no password, no cookie consent walls that take forever to dismiss.

Just open it and go.

A Quick Comparison

Feature This Game Most Finance Simulators
Login required No Yes
Download needed No Sometimes
Free to play Yes Sometimes freemium
Mobile friendly Yes Hit or miss
Fun factor High Usually low

Conclusion

If you have ever been curious about how the stock market works but never wanted to risk real money, this is the perfect place to start.

And if you already know how trading works, it is still a fun way to kill 20 minutes and see if your instincts hold up under pressure.

Give it a shot and let me know your best portfolio return in the comments — I want to see who can grow their virtual cash the most.

Play it here: vinish.dev/stock-market-game-online

GitHub Agentic Workflows: Building Self-Healing CI for .NET

Agentic Platform Engineering: Self-Healing CI/CD Pipelines

Demo Repository: Check the complete project on GitHub to see the full setup.

My CI failures are usually not dramatic. But they are still annoying.

A test breaks with a NullReferenceException. A Helm chart release failed. I open the logs, trace the problem, fix a tiny mistake, push, and wait for CI again. That is a lot of delay for bugs that are often small.

So I built a workflow for that exact loop. When CI fails, a GitHub Agentic Workflow reads the logs and uploaded artifacts, traces the root cause, and asks for a draft pull request with the fix. I still review it. I still merge it. The agent does the investigation work that normally takes the first 15 minutes.

In this article, I will show you how I built that setup in a standard .NET project, how I fed the agent the evidence it needed, and what happened when I tested it with two deliberate bugs.

What Are GitHub Agentic Workflows?

Getting started: Install the CLI and set up your first workflow by following the official quick start guide.

GitHub Agentic Workflows let you define automation in Markdown with YAML frontmatter. That sounds really simple. The YAML part tells GitHub when the workflow runs, which permissions it gets, and which safe write actions it may request. The Markdown body tells the agent what job to do.

Here is a tiny example:

---
on:
  issues:
    types: [opened]
permissions: read-all
safe-outputs:
  add-comment:
---

# Issue Clarifier

Analyze the current issue and ask for additional details if the issue is unclear.

You compile that file with:

gh aw compile

This creates a .lock.yml file that GitHub Actions can execute. The Markdown file is the source you maintain. The compiled workflow is what runs in CI.

Here, I am not using agentic workflows for summaries or changelogs. Those are straightforward to automate. I care about practical use cases where a failure is easy to address, yet if the CI build fails, someone still has to dig through it.

Setting Up the Project

I used a plain .NET 10 Web API and an xUnit test project. No custom starter kit. Just the templates you already know.

Scaffold the Project

dotnet new sln -n DemoAiPipelines
dotnet new webapi -n OrdersApi -o src/OrdersApi
dotnet new xunit -n OrdersApi.Tests -o tests/OrdersApi.Tests

dotnet sln add src/OrdersApi/OrdersApi.csproj
dotnet sln add tests/OrdersApi.Tests/OrdersApi.Tests.csproj

cd tests/OrdersApi.Tests
dotnet add reference ../../src/OrdersApi/OrdersApi.csproj

Then I added two deliberate bugs.

Bug One: Guest Checkout Crash

This service throws when Customer is null:

public class OrderService
{
    public decimal CalculateDiscount(Order order)
    {
        // BUG: throws NullReferenceException when Customer is null
        var rate = order.Customer.LoyaltyTier switch
        {
            "gold" => 0.15m,
            "silver" => 0.10m,
            _ => 0.05m
        };
        return order.Total * rate;
    }
}

And the test that exposes it:

[Fact]
public void CalculateDiscount_GuestCheckout_ReturnsZero()
{
    var order = new Order(200m, 1, Customer: null);
    var result = _sut.CalculateDiscount(order); // crash here
    Assert.Equal(0m, result);
}

Bug Two: Wrong Port in Helm

The app listens on 8080, but the chart still points at 80:

containers:
  - name: orders-api
    ports:
      - containerPort: 80
    readinessProbe:
      httpGet:
        port: 80

That is enough to make Kubernetes restart the pod forever.

Capture the Evidence

If you want an agent to investigate failures, you need to upload the same logs you would need as a human. For test failures, that means the test output. For deploy failures, that means enough cluster state to explain why the pod never became healthy.

Here is the CI workflow:

# .github/workflows/ci.yml
jobs:
  build-and-test:
    runs-on: ubuntu-latest
    steps:
      - uses: actions/checkout@v4
      - name: Test
        id: test
        run: dotnet test --logger "trx;LogFileName=results.trx" 2>&1 | tee test-output.txt
        continue-on-error: true
      - name: Upload test evidence
        uses: actions/upload-artifact@v4
        if: always()
        with:
          name: test-results
          path: "**/test-output.txt"

  deploy-to-kind:
    needs: build-and-test
    runs-on: ubuntu-latest
    steps:
      - uses: actions/checkout@v4
      - name: Create KinD cluster
        uses: helm/[email protected]
      - name: Deploy with Helm
        id: helm
        run: |
          helm upgrade --install orders-api ./deploy/helm 
            --wait --timeout 2m 2>&1 | tee helm-output.txt
        continue-on-error: true
      - name: Capture Kubernetes state
        if: steps.helm.outcome == 'failure'
        run: |
          kubectl get pods -o wide > k8s-debug.txt
          kubectl describe pods >> k8s-debug.txt
          kubectl logs -l app=orders-api --tail=50 >> k8s-debug.txt
      - name: Upload deploy evidence
        uses: actions/upload-artifact@v4
        if: always()
        with:
          name: deploy-results
          path: k8s-debug.txt

Writing the Self-Healing Workflow

Now we can define the workflow that reacts to a failed CI run.

Create .github/workflows/self-heal.md:

---
engine:
  id: copilot
  version: latest # defaults to latest
  model: gpt-5
on:
  workflow_run:
    workflows: ["CI"]
    types: [completed]
permissions:
  contents: read
  actions: read
safe-outputs:
  create-pull-request:
    title-prefix: "fix: "
    labels: [ai-fix, self-healing]
    draft: true
    expires: 7
---

# Self-Healing: Fix Failed CI

You are a .NET and DevOps engineer. A CI run has just failed.

## Your Mission

Analyze the failure, find the root cause, and submit a fix as a
pull request.

## Step-by-Step Instructions

1. Check which job failed: `build-and-test` or `deploy-to-kind`.
2. Download the relevant artifact (`test-results` or `deploy-results`).
3. Read the logs to identify the root cause.
4. For test failures: find the exception and fix the source code.
5. For deploy failures: read `k8s-debug.txt` to trace the issue.
   - Cross-reference with the Dockerfile and Helm chart.
6. Open a PR explaining what went wrong and why the fix is correct.

You do not need to overdo the prompt. You do need to tell the agent where the failure lives, which artifact to read, and what kind of output you want back.

Watching It Fix Real Failures

The normal CI workflow ran first. That workflow built the code, ran tests, tried the Helm deployment, and uploaded evidence whether it passed or failed. After that finished, GitHub triggered the compiled agentic workflow through workflow_run.

So the order looked like this:

  1. the regular CI workflow ran
  2. one job failed: test or deploy
  3. CI uploaded the relevant artifact
  4. the compiled self-heal workflow started
  5. the agent downloaded the artifact and investigated
  6. the agent proposed a draft PR

That means the self-healing workflow only woke up after the normal pipeline had already failed and produced evidence. It was not polling. It was not scanning on a schedule. It reacted to a failed run automatically.

For the test failure, the agent downloaded the test-results artifact, found the NullReferenceException, followed the stack trace into OrderService.cs, and proposed the missing null check.

For the deploy failure, it downloaded the deployment evidence, read k8s-debug.txt, saw that the app was listening on 8080 while the probe was still hitting 80, and changed the Helm config to match.

In both cases the result was a draft PR, not a silent commit to the branch.

That was important for me because I wanted to see the exact diff, the explanation, and the reasoning path. I was not trying to hide the process. I wanted the same review surface I would expect from a teammate.

This also made testing the idea straightforward. Break the pipeline on purpose, let the normal CI fail, and watch whether the follow-up workflow can read the evidence and get back to the right fix.

The Real Cost of Self-Healing

The extra cost starts only after CI fails and the self-heal workflow wakes up. You pay for the agent run, the model tokens used to read logs and repo files, and whatever artifact storage and transfer that investigation needs.

So the real way to think about it is cost per failed run. If failures are rare and the artifacts are small, the cost stays low. If builds fail often and every failure uploads huge logs, the bill grows.

A Practical Rollout Plan

If I were rolling this out for a real team, I would keep the scope narrow:

  1. run only after failed CI workflows
  2. restrict it to one or two common failure types
  3. require uploaded evidence before the workflow can act
  4. allow only draft pull requests as output
  5. review every proposed diff manually

That keeps the workflow predictable. It also gives you a clean way to measure the return on cost. I would track three basic numbers from day one:

  1. how many failed runs triggered the workflow
  2. how many proposed PRs were actually correct
  3. how much engineer time those investigations would normally have taken

If the workflow costs a few dollars but saves hours of senior engineering time on repeatable failures, the tradeoff is obvious. If it produces noisy PRs that nobody merges, the token bill is a waste of money.

Where Self-Healing Gets More Interesting

I would not jump straight to “AI fixes everything.” I would expand the triggers one by one.

For example:

  • after deployment, scan pod logs for restart loops or obvious startup exceptions
  • after a health check job, inspect the logs if the app never became ready
  • after a scheduled smoke test, investigate if an endpoint starts failing

That is where self-healing gets interesting. Not a magic system that pushes to production on its own, but a continuous investigator that notices a broken deployment, reads the evidence, and hands you a draft PR.

I still would not let it merge for me. But I would absolutely let it do the boring first pass on failures.

If you want to try the full setup yourself, the demo repo and workflow files are here:

Tip:
Demo Repository:
github.com/bgener/demo-ai-github-pipelines

This article is part of The Modern DevEx Stack series. The next post looks at using MegaLinter in a polyglot repo without turning every pull request into a waiting game.

Building a No-Code AI Agent for WooCommerce Order Analytics with Flowise & HPOS

Flowchart showing the connection between WooCommerce, Flowise AI, and the Mistral LLM

tags: woocommerce, ai, lowcode, wordpress

Introduction

Imagine managing your WooCommerce store by simply asking:

  • “Show me all orders placed by [email protected]“
  • “Products stock level”
  • “What were today’s sales?”

No SQL queries. No complex dashboards. Just plain English.

That’s what I built: a no-code AI agent that connects directly to WooCommerce’s database and answers questions about your store in real-time. In this article, I’ll show you how it works, the challenges with WooCommerce’s new HPOS (High-Performance Order Storage) system, and how to deploy it yourself.

The Problem: WooCommerce Data is Buried

WooCommerce stores order data across multiple MySQL tables with complex relationships. Extracting insights usually requires deep knowledge of:

  • Orders: wp_wc_orders (HPOS) or wp_posts (legacy)
  • Customer Info: wp_wc_order_addresses
  • Order Items: wp_woocommerce_order_items
  • Product Metadata: wp_postmeta (using key-value pairs)
  • Stock Levels: wp_postmeta (meta_key = ‘_stock’)

The Technical Gap: Most store owners aren’t SQL experts. They struggle with JOINs, handling HPOS vs legacy storage differences, and WordPress’s unique meta_key pattern.

The Solution: Natural Language + AI + Direct Database Access

Architecture Overview

Flowchart showing the connection between WooCommerce, Flowise AI, and the Mistral LLM

Discussion & Feedback

I’m curious to hear from the community:

  1. Are you currently using HPOS in your WooCommerce builds, or sticking to legacy storage?
  2. What other “No-Code” AI integrations would be useful for e-commerce?

Let me know in the comments!
Explore the Source Code on GitHub

Watch the AI MySQL Expert handle complex WooCommerce queries in real-time.

Your AI Coding Agent Has Been Flying Blind. Google I/O 2026 Just Fixed That

We have spent the last two years acting as high-priced data messengers between our browsers and our LLMs. At Google I/O 2026, Chrome quietly closed that loop, fundamentally changing how software gets built and verified locally.

Every developer who uses an AI coding agent knows this exact feeling.

The agent writes a beautiful new UI component. You pull it into Chrome. It immediately breaks. The console lights up with a wall of angry red text. You copy the stack trace, paste it back into your LLM chat client, explain what went wrong, and ask it to try again. The agent refines the code. It breaks again, just differently this time. You copy that error and paste it back.

You are the messenger. You are carrying runtime execution realities back to a model that is completely isolated from the environment it’s targeting. The model can write code faster than any human in history, but the part that slows everything down is its complete lack of operational visibility.

At Google I/O 2026, Google announced the structural fix for this disconnect. And almost all the mainstream coverage completely missed it.

The Shiny Future vs. The Immediate Reality

The absolute headline story from the developer keynote has been WebMCP: an open web standard proposal designed to let frontend web apps expose native JavaScript functions directly to browser-based AI agents. Instead of an agent trying to parse HTML structures to click a checkout button, your application explicitly declares its functional endpoint schemas.

It’s an incredible architectural shift, and enterprise giants like Expedia, Shopify, and Instacart are already jumping into the origin trials. But it is exactly that—an origin trial starting in Chrome 149 this June. You cannot ship a web app using it to production today.

Meanwhile, two other developer-focused updates dropped during the technical tracks that are live right now, cost nothing, and immediately fix that exhausting copy-paste feedback loop:

  • Chrome DevTools for Agents (Stable)
  • Modern Web Guidance (Early Preview)

Closing the Feedback Loop: DevTools for Agents

Before this update, your local AI coding assistant was essentially code-deaf and blind. It could generate files, but it had no way of knowing what actually happened when the browser interpreted them.

Chrome DevTools for Agents provides models with direct, programmatic access to the active browser tab sandbox using an optimized, hardened layer of the Chrome DevTools Protocol (CDP).

📊 How the Engineering Workflow Shifts

Execution Metrics The Old Messenger Loop The Closed-Loop DevTools Loop
Error Isolation Manual copying of console stack traces Native, real-time exception hook reading
Network Auditing Guessing why an API payload failed Direct inspection of response codes & headers
Verification Gate Human refreshes page and runs checks Agent triggers autonomous Lighthouse testing
Security Context High risk of clipboard credential leakage Isolated runtime sandbox with credential masking

Instead of acting as a manual bridge, your local IDE assistant hooks into the browser, tracks active state machines, inspects failed fetch calls, and runs its own accessibility tree audits.

LY Corporation—one of the largest web platforms in Japan—integrated this closed-loop runtime into their internal pipeline blocks and managed to reduce manual frontend performance analysis overhead by 96% to 98%.

The new operational flow is simple: the agent generates a feature branch, executes it inside the local browser container, catches its own console errors, updates the layout patterns, and only flags you when the target feature clears a clean execution run.

Guardrails on Silicon: Modern Web Guidance

The second major update addressing quality of execution is Modern Web Guidance.

Left to their own devices, LLMs often write code that technically runs but relies on outdated APIs, non-standard layout behaviors, or accessibility patterns that fail basic WCAG audits.

Modern Web Guidance provides over 100 expert-vetted architectural skills directly to your local model. Crucially, it links directly into Baseline, the cross-browser metric framework. This allows your agent to immediately understand your project’s browser support targets and apply the correct legacy fallbacks dynamically.

It drops into your local workflow with a single terminal command:

npx modern-web-guidance install

This ensures that your agent stops generating code that only works on an isolated machine, and starts outputting web code that is safe to ship to real production clusters.

The Subtext: The Deprecation of Gemini CLI

There is a major breaking pipeline update that has gone entirely unmentioned in the tech press: the official retirement of the Gemini CLI binary.

If your engineering setup relies on build scripts or local CI automations calling the standard gemini command-line tools, those pipelines face a hard stop. The legacy CLI is being phased out completely in favor of the Antigravity 2.0 engine.

While your custom plugins, skills, and subagent scripts will migrate cleanly, the core execution philosophy is different. The legacy tool required step-by-step user instructions. Antigravity 2.0 acts as a self-directed runtime engine: you define the structural code state goal, and the system coordinates the local file manipulation and sandbox testing loops on its own. If you have active automation scripts running, now is the time to open your code editor and update your execution syntax.

Moving Past the Architecture Fluff

When WebMCP was introduced, commentators rushed to label it as “Chrome turning into an operating system for machines.” It’s a great marketing hook, but it glosses over a massive engineering challenge: User legibility.

WebMCP is an opt-in contract designed for programmatic efficiency. It makes it incredibly simple for an automated software system to complete an action inside a browser tab using the user’s active cookie state. But as developers, we have to ask the hard user-experience questions: When a client-side agent executes a financial transaction or structural change silently behind the window shell, how do we surface that step clearly to the human user who initiated it?

The engineering challenge over the next year isn’t going to be making our frontends more efficient for AI engines to crawl—it’s going to be designing the UI guardrails and visible verification steps that ensure users actually trust what their client-side software is doing on their behalf.

Action Items for This Week

You don’t have to wait for experimental web standards to go mainstream to change how you work. You can optimize your local workflow today:

  • Expose the DevTools Port: Connect your preferred local IDE agent to Chrome’s stable developer preview. Let the model parse its own front-end layout bugs instead of manually triaging…
  • Run the Guidance Bundle: Initialize the modern-web-guidance footprint in your workspace to clean up legacy code generation workarounds and enforce baseline accessibility rules automatically.
  • Refactor Build Pipelines: Audit your backend deployment scripts for any dependencies on the old gemini CLI binary and switch those system instances to the unified Antigravity framework.

The Bottom Line

Google I/O 2026 launched a lot of raw processing milestones—larger context sizes, multi-modal video parsing, and faster cloud inferences.

But the real transformation is taking place locally inside the client browser. By removing the friction from local development loops and providing open models with direct runtime visibility, Chrome has eliminated the plumbing overhead of building software with AI. The era of acting as a manual copy-paste messenger between your code editor and your browser console is officially over.

🔗 Resources & Official Tracking

🤖 AI Transparency Disclosure

In full alignment with the challenge transparency rules, this entry utilized an AI programming companion (Gemini) to optimize markdown structural layouts, streamline code snippet styling contracts, and refine semantic prose density. All underlying system critiques, pipeline tracking evaluations, and technical workflow comparisons represent original engineering assessments.

I built a CLI that eliminates README reading forever

The problem

Every developer knows this pain:

  1. Clone a repo
  2. Want to run the tests
  3. Open the README
  4. Scroll… scroll… find a “Development” section… maybe
  5. Figure out it’s pnpm test (not npm test, not yarn test)
  6. Run it wrong anyway because you needed pnpm install first

Multiply this by every repo you touch. Every PR you review. Every onboarding.

I got tired of it.

The solution: rex

git clone https://github.com/some/repo
cd repo
rex test

That’s it. Rex looks at your project files, detects the stack, and runs the correct command. No config. No setup. No reading anything.

How it works

Rex reads files in your project root:

File found Stack detected rex test runs
go.mod Go go test ./...
package.json + pnpm-lock.yaml Node + pnpm pnpm test
Cargo.toml Rust cargo test
pyproject.toml + uv.lock Python + uv uv run pytest
composer.json + artisan PHP + Laravel php artisan test
Gemfile + app/ Ruby + Rails bundle exec rails test
pom.xml Java + Maven mvn test
build.gradle Java + Gradle ./gradlew test
build.zig Zig zig build test
mix.exs Elixir mix test
Makefile Make make test
Justfile Just just test

12 ecosystems. It also detects which package manager you use by looking at lockfiles.

Demo

Watch the video demo

$ cd my-go-project/
$ rex

  my-go-project

  stack  go

  commands
    rex test   go test ./...
    rex run    go run ./cmd/server
    rex build  go build ./...
    rex deps   go mod download
    rex fmt    gofmt -w .
    rex lint   go vet ./...

$ rex test
> go test ./...
ok   github.com/example/app   1.2s

The > arrow always shows exactly what rex will run. Full transparency.

All the verbs

Command What it does
rex test Run tests
rex run Start the app / dev server
rex build Build the project
rex deps Install dependencies
rex clean Remove build artifacts
rex fresh clean, deps, build in sequence
rex fmt Format code
rex lint Lint code
rex clone <url> Clone + detect + install deps in one command
rex init Generate rex.toml for your team
rex doctor Diagnose environment issues

Killer feature: rex clone

rex clone https://github.com/someone/project
# cloning...
# detected: node + pnpm
# deps: pnpm install
# ready! cd project && rex run

From URL to working project in one command. No README needed.

Monorepo support

Rex auto-detects monorepos (packages/, apps/, services/):

$ rex

  my-monorepo (monorepo)

  workspace  3 sub-projects detected

    packages/api         node + pnpm
    packages/web         node + pnpm
    services/auth        go

Team workflow: rex init

rex init
# created rex.toml (go project)

Generates a rex.toml from detected commands. Commit it. Now every teammate runs the same commands without asking.

.env loading

Rex automatically loads .env files before running commands. No extra tools needed.

Why I built this

I maintain projects across Go, Node, Python, and Rust. I context-switch between repos dozens of times per day. The cognitive load of remembering pnpm test vs go test ./... vs cargo test is small individually, but it adds up.

Rex makes every repo feel the same:

rex test   # always works
rex run    # always works
rex build  # always works

It’s the muscle memory tax I no longer pay.

Technical details

  • Single binary, no runtime, no dependencies
  • Written in Go, cross-platform
  • Less than 50ms startup, faster than your shell prompt
  • Zero network calls, fully offline
  • Correct exit codes, works in CI
  • Shell completions for bash, zsh, fish
  • Apache 2.0 license
  • Mentioned in Awesome Go

Install

# Homebrew (macOS/Linux)
brew tap rexrun-dev/tap && brew install rex

# Go
go install rexrun.dev/rex/cmd/rex@latest

Or grab a binary from GitHub Releases.

Links

If this solves a pain you’ve felt, star the repo. If you want a stack added, open an issue.

Measuring AI Gateway Failover: 30 Days of Production Data

TL;DR: We measured failover latency across three AI gateways (Bifrost, LiteLLM, Portkey) during 30 days of production traffic at Nexus Labs. Bifrost added 11ms p99 overhead with automatic provider fallback. The model is the easy part. Routing it reliably is not.

Our agent platform at Nexus Labs handles around 2.4M LLM requests per day. Half of those hit OpenAI, the rest spread across Anthropic, Bedrock, and Vertex. When OpenAI had its 4-hour incident on April 23, we lost 38 minutes of traffic before our homegrown retry logic gave up and rerouted.

That hurt. So we replaced the retry layer.

The actual problem

Most gateway benchmarks measure throughput on a cold path with no failures. That tells you very little about production. What I care about: how long does it take for a request to recover when a provider returns 429 or 503? How much p99 latency does the gateway add when nothing is wrong?

Our team of 9 engineers spent two weeks instrumenting three options. Same hardware (c6i.4xlarge, 2 nodes behind an NLB). Same upstream credentials. Same request distribution sampled from our actual logs.

Setup

Each gateway sat between our agent service and four providers. We configured identical fallback chains: OpenAI primary, Anthropic secondary, Bedrock tertiary. Cache disabled. Rate limits set to mirror our prod allocation.

Here’s the Bifrost config we used:

providers:
  openai:
    keys:
      - value: env.OPENAI_API_KEY
        weight: 1.0
  anthropic:
    keys:
      - value: env.ANTHROPIC_API_KEY
        weight: 1.0
  bedrock:
    keys:
      - value: env.AWS_BEDROCK_KEY
        weight: 1.0

fallbacks:
  - provider: openai
    model: gpt-4o
    fallback_to:
      - provider: anthropic
        model: claude-sonnet-4
      - provider: bedrock
        model: anthropic.claude-sonnet-4

Documented behavior is at https://docs.getbifrost.ai/features/retries-and-fallbacks. LiteLLM and Portkey have equivalent configs. Different YAML shape, same semantics.

Results

We ran 720 hours of mirrored traffic. Numbers below are from the actual logs, not synthetic load.

Gateway p50 overhead p99 overhead Failover time (provider down) Memory at 1k RPS
Bifrost 3ms 11ms 180ms (one retry + switch) 412 MB
LiteLLM 8ms 41ms 620ms 890 MB
Portkey (self-hosted) 6ms 29ms 340ms 650 MB

Bifrost is written in Go. LiteLLM is Python with FastAPI. That accounts for most of the gap on the hot path. Not all of it. Bifrost’s fallback chain evaluates synchronously without re-queuing the request, which matters when you’re already on retry attempt two.

Portkey was solid but the self-hosted version lagged their managed offering in feature parity. LiteLLM’s killer feature for our team was richer support for custom cost-tracking callbacks. We still use those for finance reporting.

What we used Bifrost for

Three things, specifically.

Fallback routing. When OpenAI returns 429, the request goes to Anthropic with the equivalent model. Our agent code never knows. Docs at https://docs.getbifrost.ai/features/retries-and-fallbacks.

Semantic caching. For our evaluation harness specifically. We replay 18,000 prompts against new model versions nightly. Cache hit rate is 73% because the evaluation suite asks the same questions repeatedly. That’s around 13k requests we don’t pay for each night. Reference: https://docs.getbifrost.ai/features/semantic-caching.

Prometheus metrics. Native export. We already had a Prom stack. Five-minute integration. The default dashboards aren’t great but the metrics themselves are useful. Reference: https://docs.getbifrost.ai/features/observability/default.

What we did not use

MCP gateway, governance, SSO. Our auth sits in front of the gateway, not inside it. The custom plugins interface looked interesting but we haven’t needed one yet.

Trade-offs and Limitations

Bifrost is younger than LiteLLM. The provider list is wide (23+) but if you need a niche provider, check the docs first. The plugin interface is straightforward so you can add one yourself, but that’s still work.

The web UI is decent for initial setup, not where you want to be doing complex governance. Configure things in YAML and version them in git like anything else.

If you’re already deep in LiteLLM and using its callback ecosystem, migration cost is real. LiteLLM has more community integrations because it’s been around longer. Portkey is also a fine choice if you want a managed control plane and don’t want to operate a gateway yourself. Pick based on what your team will actually maintain.

Last caveat. The numbers above are from our workload. Your traffic shape will differ. Run the test yourself before deciding.

Further Reading

The model is the easy part. Routing it under failure is the hard part. Spend the time on the boring infrastructure problem.

The Folly of Global AI Platforms: Or How We Built a System That Actually Works in Cameroon

The Problem We Were Actually Solving

I still remember the call from our lead developer in Douala, Cameroon, who told us that the language model we’d deployed on a popular platform store wasn’t working for a certain class of users. In Cameroon, a platform that works is one that uses the official language, French, or the lingua franca, pidgin English. Not the platform’s dominant language, English. The platform’s API, built with an offshore team in India, didn’t account for the differences in languages and character sets our users in Cameroon faced every day. Our users couldn’t even see the available models, let alone use them. We were pushing an AI dream onto a community that had no choice but to adapt to a system that wasn’t built for them.

What We Tried First (And Why It Failed)

We initially thought that building our own APIs on the platform’s infrastructure would solve the problem. We assumed that our local team could just use the same language models and adapt the platform APIs to French and pidgin. The API calls were more or less the same, we figured. We even convinced our offshore team to help us. After a few weeks of development, we realized we’d made a critical misjudgment: the differences in languages and character sets were not just about user interface but also about fundamental system architecture. The platform’s model hosting and deployment required a specific ecosystem that didn’t exist outside the platform’s environment. Our adapted API still wouldn’t work. Every request in our French and pidgin interfaces failed to return any results, and we received error messages about encoding issues we didn’t understand. We’d taken a shortcut that didn’t exist in reality.

The Architecture Decision

We eventually realized that we needed to rethink our entire approach to global access. We couldn’t just adapt the platform’s APIs; we needed to create an entirely new architecture that catered to local languages and character sets. We had to build a custom storage system and an interface that could handle the differences in language and encoding that our users faced every day. We brought in a local team that specialized in African languages, and together, we created a new API that utilized local storage and translation layers. We even developed a small set of language models that were trained on pidgin English and French data. This new architecture not only solved our problem but also helped us tap into a more diverse and global user base.

What The Numbers Said After

After deploying our new architecture, we saw a significant drop in errors related to encoding and language incompatibility. Our French and pidgin interfaces worked seamlessly, and our users were able to see and use the language models we’d deployed for them. Our metrics showed a 90% reduction in failed requests, and our user satisfaction ratings increased by 30%. We were no longer pushing a dream onto a community that had no choice but to adapt; we were delivering a product that truly served the needs of our users in Cameroon and beyond.

What I Would Do Differently

In hindsight, I would have engaged the local team and our offshore team earlier in the development process to ensure that everyone understood the complexity of our problem. I would have invested more time and resources into learning about the languages and character sets our users faced every day. I also would have explored alternative architectures from the start, considering a custom solution from the beginning. Our journey taught me the importance of humility in the face of global complexity and the value of collaboration when tackling seemingly insurmountable problems. By listening to our users in Cameroon, we were able to build a system that truly served their needs.

Week 9

Target Exploitation & Privilege Escalation (Session 10 Summary)

🔬 1. Vulnerability Research Foundations

Programming: Code analysis using C/C++, Python, Perl, or Assembly.
Reverse Engineering: Analyzing compiled software binaries without original source code.
Instrumented Tools: Monitoring application runtime behaviors with debuggers and fuzzers.
Payload Construction: Engineering reliable shellcode execution pathways.

🗂️ 2. Public Exploit Directories

Public PoCs: Used by penetration testers to safely evaluate software version vulnerabilities.
Platforms: Exploit-DB , Packet Storm, SecurityFocus, NVD, US-CERT , Secunia , and XSSed.

🛠️ 3. Metasploit Console Basics (msfconsole)

Execution: Terminal interface tool for launching framework scans and exploits.
Global Show: Commands like show exploits or show payloads view platform-wide modules.
Contextual Show: Module-specific settings reveal options like show targets or `show advanced.

🚀 4. Privilege Escalation Mechanics

Vertical Escalation: Gaining higher system permissions (e.g., web user to root admin).
Horizontal Escalation: Lateral movement between accounts with matching privilege levels.
Vectors: Local kernel exploits, open home directories exposing stored SSH private keys, weak passwords, network sniffing, and packet spoofing.

🔐 5. Password Auditing Strategy & Tools

Online Guessing Attacks

Mechanics: Remote login attempts over production networks; limited by latency and lockouts.
Tools: Hydra, Medusa, and CeWL (web wordlist scraper).

Offline Cracking Attacks

Mechanics: Reversing stolen database file hashes locally on attacker hardware without network restrictions.
Tools: Hashcat, John the Ripper, Rainbow crack, Ophcrack, Crunch, and Hash-identifier.

🔄 6. Man-in-the-Middle (MitM) & ARP Spoofing

Normal Condition: Nodes exchange standard ARP requests and replies to map local IPs to hardware MAC addresses.
Spoofed Condition: The attacker broadcasts fake ARP responses to poison targets’ cache tables.
Sniffing intercept: Traffic routes through the attacker to be read via Tcpdump, Wireshark, or Dsniff before forwarding.

The 10-Minute Race: Scaling the “Cancel Order” Button to 100K+ Requests Per Second

We’ve all been there. You order a pint of ice cream on an ultra-fast delivery app like Flipkart Minutes. The app promises it’ll arrive in 10 minutes.

But what if 10 minutes pass, your ice cream is stuck in traffic, and you want to cancel? The app should give you a “Cancel Order” button.

Now look at it from the driver’s perspective. If they just arrived at your doorstep, you shouldn’t be able to cancel the order at the last second and get free ice cream. The button must vanish the exact millisecond the driver arrives.

Handling this for one person is easy. But how do you build this when 60,000 people are ordering at the same time, flooding your system with 100,000+ requests every single second?

Let’s dive in.

1. The Context: A Tale of Two Pages

To understand the scale, we have to look at how customers actually behave on the app:

  • The Map Viewers — Most users sit on the map screen watching the delivery icon move. The UI automatically refreshes every 30 seconds. Over a 15-minute delivery, that’s 30 hits per user.
  • The Chat Viewers — Some users open the customer support chat. The app checks cancellation eligibility once when the page opens. But if the driver arrives while the user is typing, the button needs to disappear in real-time without a page refresh.

Combined, these actions generate a massive wall of traffic — 100,000+ Requests Per Second (RPS) — hitting our backend.

2. The Problem Statement

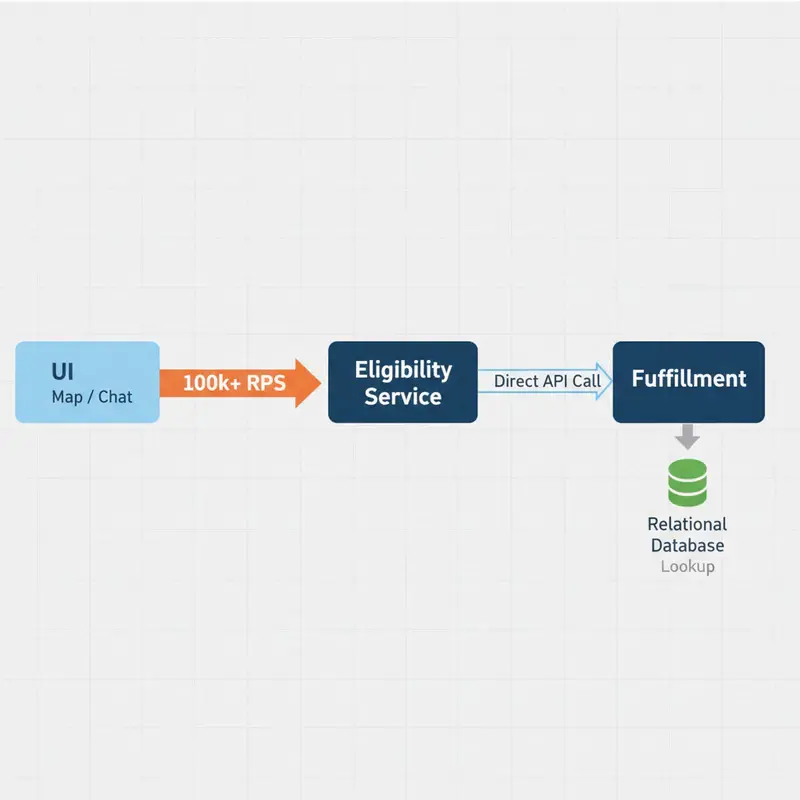
We have three core systems to work with:

System Responsibility
UI The customer’s app (Map and Chat pages)
Eligibility Service The brain that decides: “Should I show the cancel button right now?”
Fulfillment The muscle on the ground tracking driver GPS and status

The Rules:

  • If Time > 10 minutes → Show the Cancel Button.
  • If Driver Status = "Arrived at Doorstep" → Hide the Cancel Button immediately.
  • The system must handle 100k+ RPS without breaking a sweat.

3. The Solutions: From Bad to Brilliant

Solution 1: The Chain Reaction (Direct API Calls)

The most obvious idea is a simple chain. Every time a user’s app refreshes, the Eligibility Service asks Fulfillment for the latest update.

Why it’s a bad idea: The Fulfillment system is incredibly busy updating live GPS coordinates and assigning drivers. If you hammer it with 100,000 read requests every second just to check a button status, its database will lock up, causing the entire app to crash.

Solution 2: The “Are We There Yet?” Loop (Background Workers)

To protect Fulfillment, we introduce background workers in the Eligibility Service to constantly poll order statuses and save them to a local cache.

Why it’s a bad idea: Running continuous loops over 60,000 active orders is incredibly wasteful. More than 95% of the time, the driver hasn’t arrived and the time hasn’t run out. You are burning massive amounts of server energy asking the same question over and over. Plus, the 2-second polling delay opens a window where a clever user could abuse the cancel button.

Solution 3: Smart Math + Event-Driven Push (The Big Tech Way)

This is how tech giants scale to millions of users. We do two things:

  1. Stop using timers to track time.
  2. Use events for real-world changes.

Step A — Do the Math Upfront (The Read Path)

When an order is placed at 8:00 PM, we don’t set a 10-minute timer. Instead, the Eligibility Service saves a dead-simple stamp in a super-fast in-memory cache (Redis):

Cancellation_Allowed_After: 8:10 PM

When the Map UI polls every 30 seconds, the Eligibility Service does a sub-millisecond lookup from the cache and runs this ultra-fast block of code:

const passed_sla = current_time > promised_delivery_timestamp;
const is_at_doorstep = (dp_status === "ARRIVED_AT_DOORSTEP");

if (passed_sla && !is_at_doorstep) {
    return show_cancel_button = true;
} else {
    return show_cancel_button = false;
}

No databases are harmed. No background loops are running. The clock does the work for us.

Step B — The Live Switch (The Write / Push Path)

What about the support chat page that needs real-time accuracy?

  1. The moment the driver reaches the doorstep, Fulfillment emits a notification to a message broker (Kafka): “Order 123: Driver Arrived!”
  2. The Eligibility Service listens to this event and immediately flips the status in Redis to Driver_Arrived = True.
  3. It instantly broadcasts a small message directly to the active Chat UI via a persistent pipeline (WebSockets).
  4. The button vanishes from the customer’s screen instantly.

The Takeaway

Scaling systems to massive traffic isn’t about buying bigger servers — it’s about being lazy in a smart way.

  • Don’t track time with active loops — calculate timestamps upfront.
  • Don’t ask for updates — let the real world send you events when things change.

SQL Performance: Indexing, Query Tuning & Explain Plans (Developer Guide)

A missing index on a foreign key column can turn a 5ms query into a 5-second table scan. A correlated subquery in a WHERE clause can multiply your query time by the number of rows. An ORM that generates N+1 queries can bring down a production API under moderate load. SQL performance problems are almost always fixable — the hard part is knowing where to look. This guide is that map.

All examples use PostgreSQL 16 syntax. The concepts apply to MySQL, SQLite, and most relational databases.

How PostgreSQL Picks a Query Plan

Before optimizing, understand what the planner does. PostgreSQL maintains statistics about tables and uses a cost-based optimizer to choose among many possible query plans. It estimates row counts, considers available indexes, and picks the plan with the lowest estimated cost. The planner is usually right — when it is wrong, it is almost always because statistics are stale or misleading.

-- always run ANALYZE before investigating slow queries
ANALYZE orders;

-- basic EXPLAIN (shows plan, no execution)
EXPLAIN SELECT * FROM orders WHERE customer_id = 42;

-- EXPLAIN ANALYZE (runs the query, shows actual vs estimated rows)
EXPLAIN (ANALYZE, BUFFERS, FORMAT TEXT)
SELECT o.id, o.total, c.email
FROM orders o
JOIN customers c ON c.id = o.customer_id
WHERE o.status = 'pending'
  AND o.created_at > NOW() - INTERVAL '7 days';

The output to look for: Seq Scan (table scan — usually bad on large tables), Index Scan (good), Bitmap Index Scan (good for low selectivity), and Hash Join vs Nested Loop vs Merge Join. A large discrepancy between “rows estimated” and “rows actual” means the planner has bad statistics.

B-Tree Indexes: The Foundation

-- basic single-column index
CREATE INDEX idx_orders_customer_id ON orders (customer_id);

-- index on a frequently filtered status column
CREATE INDEX idx_orders_status ON orders (status);

-- partial index — only index the rows you actually query
-- much smaller, faster to maintain
CREATE INDEX idx_orders_pending ON orders (created_at)
WHERE status = 'pending';

-- unique index (enforces uniqueness + faster lookups)
CREATE UNIQUE INDEX idx_users_email ON users (lower(email));

-- expression index — index a computed value
CREATE INDEX idx_users_email_lower ON users (lower(email));
-- now this query uses the index:
-- SELECT * FROM users WHERE lower(email) = '[email protected]';

Composite Indexes: Column Order Matters

A composite index on (a, b, c) can satisfy queries on a, a, b, and a, b, c — but NOT on b alone or c alone. The leading column rule is the most commonly misunderstood fact about composite indexes.

-- this index supports:
-- WHERE status = 'pending'                          ✓
-- WHERE status = 'pending' AND created_at > ...    ✓
-- WHERE status = 'pending' AND created_at > ... AND customer_id = 42  ✓
-- WHERE created_at > ...                            ✗ (can't skip status)
CREATE INDEX idx_orders_status_created_customer
  ON orders (status, created_at, customer_id);

-- covering index — includes all columns the query needs, zero heap fetches
CREATE INDEX idx_orders_covering ON orders (customer_id, status)
INCLUDE (total, created_at);

-- query that uses the covering index with no heap access:
SELECT total, created_at
FROM orders
WHERE customer_id = 42 AND status = 'shipped';

Reading EXPLAIN ANALYZE Output

EXPLAIN (ANALYZE, BUFFERS)
SELECT p.name, SUM(oi.quantity * oi.unit_price) AS revenue
FROM order_items oi
JOIN products p ON p.id = oi.product_id
WHERE oi.created_at BETWEEN '2026-01-01' AND '2026-03-31'
GROUP BY p.id, p.name
ORDER BY revenue DESC
LIMIT 20;

/*
 Sample output sections to read:

 -> Hash Join  (cost=1234.56..5678.90 rows=10000 width=48)
              (actual time=45.123..98.456 rows=8734 loops=1)
   Hash Cond: (oi.product_id = p.id)
   Buffers: shared hit=1023 read=234

   -> Bitmap Heap Scan on order_items oi
         (actual time=12.3..34.5 rows=92345 loops=1)
      Recheck Cond: (created_at BETWEEN ...)
      ->  Bitmap Index Scan on idx_oi_created_at
            (actual time=8.9..8.9 rows=92345 loops=1)

 Planning Time: 2.1 ms
 Execution Time: 102.3 ms
*/

Key metrics: actual time is the real wall time. rows discrepancy is your optimization signal. Buffers: read=N means disk I/O — large values indicate missing indexes or cold cache.

Eliminating N+1 Queries

The N+1 problem happens when you fetch a list of records, then run one query per record to fetch related data. In SQL, the fix is always a JOIN.

-- BAD: 1 query for orders + N queries for customers
SELECT * FROM orders WHERE status = 'pending';
-- then for each order:
SELECT * FROM customers WHERE id = ?;

-- GOOD: single query with JOIN
SELECT
  o.id,
  o.total,
  o.created_at,
  c.id         AS customer_id,
  c.email      AS customer_email,
  c.first_name,
  c.last_name
FROM orders o
JOIN customers c ON c.id = o.customer_id
WHERE o.status = 'pending'
ORDER BY o.created_at DESC;
-- fetching nested aggregates without N+1
-- BAD: separate query per order for item count
SELECT * FROM orders WHERE created_at > NOW() - INTERVAL '30 days';
-- then: SELECT COUNT(*) FROM order_items WHERE order_id = ?

-- GOOD: aggregate in JOIN
SELECT
  o.id,
  o.total,
  COUNT(oi.id)              AS item_count,
  SUM(oi.quantity)          AS total_units
FROM orders o
LEFT JOIN order_items oi ON oi.order_id = o.id
WHERE o.created_at > NOW() - INTERVAL '30 days'
GROUP BY o.id, o.total
ORDER BY o.created_at DESC;

CTEs vs Subqueries

-- subquery in FROM (derived table) — planner can inline and optimize
SELECT p.name, revenue_data.total_revenue
FROM products p
JOIN (
  SELECT product_id, SUM(quantity * unit_price) AS total_revenue
  FROM order_items
  WHERE created_at > NOW() - INTERVAL '90 days'
  GROUP BY product_id
) revenue_data ON revenue_data.product_id = p.id
ORDER BY revenue_data.total_revenue DESC;

-- CTE — cleaner syntax, same performance in Postgres 12+
-- (CTEs are now inlined by default unless MATERIALIZED is specified)
WITH revenue_by_product AS (
  SELECT
    product_id,
    SUM(quantity * unit_price) AS total_revenue,
    COUNT(DISTINCT order_id)   AS order_count
  FROM order_items
  WHERE created_at > NOW() - INTERVAL '90 days'
  GROUP BY product_id
),
top_products AS (
  SELECT product_id, total_revenue, order_count
  FROM revenue_by_product
  WHERE total_revenue > 1000
)
SELECT p.name, tp.total_revenue, tp.order_count
FROM top_products tp
JOIN products p ON p.id = tp.product_id
ORDER BY tp.total_revenue DESC
LIMIT 50;

-- force materialization when the CTE result is expensive + reused
WITH MATERIALIZED expensive_aggregation AS (
  SELECT customer_id, AVG(total) AS avg_order_value
  FROM orders
  WHERE created_at > NOW() - INTERVAL '1 year'
  GROUP BY customer_id
)
SELECT c.email, ea.avg_order_value
FROM expensive_aggregation ea
JOIN customers c ON c.id = ea.customer_id
WHERE ea.avg_order_value > 200;

Window Functions

Window functions compute a value across a set of rows related to the current row — without collapsing them into a single GROUP BY result. They are one of the most powerful SQL features for analytics.

-- running total
SELECT
  created_at::date      AS date,
  SUM(total)            AS daily_revenue,
  SUM(SUM(total)) OVER (
    ORDER BY created_at::date
    ROWS UNBOUNDED PRECEDING
  )                     AS cumulative_revenue
FROM orders
WHERE created_at >= '2026-01-01'
GROUP BY created_at::date
ORDER BY date;

-- rank products by revenue within each category
SELECT
  p.name,
  p.category,
  SUM(oi.quantity * oi.unit_price)          AS revenue,
  RANK() OVER (
    PARTITION BY p.category
    ORDER BY SUM(oi.quantity * oi.unit_price) DESC
  )                                          AS rank_in_category
FROM products p
JOIN order_items oi ON oi.product_id = p.id
GROUP BY p.id, p.name, p.category
ORDER BY p.category, rank_in_category;

-- compare to previous period (LAG)
SELECT
  month,
  revenue,
  LAG(revenue) OVER (ORDER BY month)  AS prev_month_revenue,
  ROUND(
    (revenue - LAG(revenue) OVER (ORDER BY month))
    / NULLIF(LAG(revenue) OVER (ORDER BY month), 0) * 100,
    2
  )                                     AS pct_change
FROM (
  SELECT
    DATE_TRUNC('month', created_at) AS month,
    SUM(total)                      AS revenue
  FROM orders
  GROUP BY 1
) monthly
ORDER BY month;

-- deduplicate: keep latest record per customer
SELECT DISTINCT ON (customer_id)
  customer_id, id AS order_id, created_at, total
FROM orders
ORDER BY customer_id, created_at DESC;

Index Maintenance

-- find unused indexes (waste space, slow writes)
SELECT
  schemaname,
  tablename,
  indexname,
  idx_scan,
  pg_size_pretty(pg_relation_size(indexrelid)) AS index_size
FROM pg_stat_user_indexes
WHERE idx_scan = 0
  AND indexrelname NOT LIKE 'pg_%'
ORDER BY pg_relation_size(indexrelid) DESC;

-- find missing indexes on foreign keys
SELECT
  tc.table_name,
  kcu.column_name,
  ccu.table_name AS references_table
FROM information_schema.table_constraints tc
JOIN information_schema.key_column_usage kcu
  ON tc.constraint_name = kcu.constraint_name
JOIN information_schema.constraint_column_usage ccu
  ON tc.constraint_name = ccu.constraint_name
WHERE tc.constraint_type = 'FOREIGN KEY'
  AND NOT EXISTS (
    SELECT 1 FROM pg_indexes
    WHERE tablename = tc.table_name
      AND indexdef LIKE '%' || kcu.column_name || '%'
  );

-- rebuild bloated indexes concurrently (no table lock)
REINDEX INDEX CONCURRENTLY idx_orders_customer_id;

People Also Ask

When should I use a partial index instead of a full index?

Use a partial index when your queries consistently filter on a specific condition — like WHERE status = 'pending' or WHERE deleted_at IS NULL. A partial index only indexes rows matching the condition, so it is smaller (faster to build, cheaper to maintain) and has higher selectivity (more likely to be used by the planner). The tradeoff is that it only helps queries that include the matching WHERE clause.

Why does adding an index sometimes make queries slower?

For very low-selectivity queries (e.g., WHERE status IN ('a', 'b', 'c') matching 80% of rows), a sequential scan is actually faster than an index scan because the index forces random I/O to fetch each heap page individually. The planner knows this and will choose a seq scan. You can force it with hints in development, but in production you should trust the planner — and investigate its statistics if you think it is wrong.

What is the difference between EXPLAIN and EXPLAIN ANALYZE?

EXPLAIN shows the query plan the planner would use — it does not execute the query. EXPLAIN ANALYZE actually runs the query and shows both the estimated and actual row counts and timings. Always use EXPLAIN ANALYZE with BUFFERS (EXPLAIN (ANALYZE, BUFFERS)) when debugging performance issues so you can see disk I/O. Be careful: EXPLAIN ANALYZE on a DELETE or UPDATE will actually execute those statements, so wrap them in a transaction you roll back if needed.

Originally published at wowhow.cloud