How to Detect CrashLoopBackOff in Kubernetes Using Python (Step-by-Step Guide)

🔍 Introduction

If you’re working with Kubernetes, you’ve likely encountered this error:

CrashLoopBackOff

It’s one of the most common and frustrating issues in Kubernetes environments.

Traditionally, debugging involves:
• Running kubectl commands
• Checking logs manually
• Guessing the root cause

👉 This process is slow and inefficient.

In this guide, I’ll show you how to automatically detect CrashLoopBackOff using Python, combining pod state and log analysis.

🤯 What is CrashLoopBackOff?

CrashLoopBackOff occurs when:
• A container starts
• Crashes immediately
• Kubernetes restarts it
• The cycle repeats

Example:

kubectl get pods

Output:

sample-app   0/1   CrashLoopBackOff   3 (15s ago)

🎯 Goal
We want to build a system that:
• Detects CrashLoopBackOff automatically
• Fetches logs
• Generates structured insights
• Reduces manual debugging

🧱 Step 1: Fetch Kubernetes Pods Using Python
We’ll use subprocess to call kubectl:

import subprocess
 import json
 def list_pods(namespace):
     result = subprocess.run(
        ["kubectl", "get", "pods", "-n", namespace, "-o", "json"],
        capture_output=True,
        text=True
  )
  pods = json.loads(result.stdout)
  pod_list = []
  for item in pods["items"]:
    name = item["metadata"]["name"]
    state = item["status"]["containerStatuses"][0]["state"]
    if "waiting" in state:
       reason = state["waiting"]["reason"]
    else:
       reason = "Running"
       pod_list.append({
         "name": name,
          "state": reason
        })

  return pod_list

🚨 Step 2: Detect CrashLoopBackOff
Once we have pod states, detection is straightforward:

def detect_failures(pods):
    failures = []

    for pod in pods:
        if pod["state"] in ["CrashLoopBackOff", "ImagePullBackOff", "ErrImagePull"]:
            failures.append({
                "pod_name": pod["name"],
                "issue": pod["state"],
                "severity": "CRITICAL"
            })

    return failures

🔍 Step 3: Fetch Pod Logs
Now let’s get logs for deeper analysis:

def get_pod_logs(namespace, pod_name):
    result = subprocess.run(
        ["kubectl", "logs", "-n", namespace, pod_name],
        capture_output=True,
        text=True
    )

    return result.stdout

🧠 Step 4: Parse Logs for Errors
We can extract important signals:

def parse_logs(logs):
    issues = []

    for line in logs.split("n"):
        if "ERROR" in line:
            issues.append({
                "level": "WARNING",
                "message": line
            })

    return issues

🔗 Step 5: Combine State + Logs
Pod state + Logs = Powerful debugging signal

def analyze_pod(namespace, pod):
    pod_name = pod["name"]
    pod_state = pod["state"]

    if pod_state == "CrashLoopBackOff":
        return {
            "pod_name": pod_name,
            "status": "unhealthy",
            "issues_found": [{
                "level": "CRITICAL",
                "message": f"Pod in {pod_state}"
            }]
        }

    logs = get_pod_logs(namespace, pod_name)
    log_issues = parse_logs(logs)

    if log_issues:
        return {
            "pod_name": pod_name,
            "status": "unhealthy",
            "issues_found": log_issues
        }

    return {
        "pod_name": pod_name,
        "status": "healthy",
        "issues_found": []
    }

📊 Example Output

{
  "pod_name": "sample-app",
  "status": "unhealthy",
  "issues_found": [
    {
      "level": "CRITICAL",
      "message": "Pod in CrashLoopBackOff"
    }
  ]
}

💥 Why This Approach Works
This method:
• Automates failure detection
• Reduces manual debugging
• Provides structured insights
• Works in real-time systems

🧠 Key Takeaway

Kubernetes debugging becomes effective when you combine:

  • Pod state
  • Logs
  • Context

🚀 Part of a Bigger System
This is part of a larger system I’m building:
👉 An AI-powered Kubernetes debugger

It:
• Detects failures automatically
• Analyzes logs
• Suggests fixes

🔗 Project Link

👉 GitHub: Link

devops #kubernetes #python #cloud #automation

Progress on the Navier-Stokes Problem

Ninety years of attacks on the regularity question, and where to go deeper

The state of play

Since the 1930s, mathematicians have attacked the problem from many angles, from energy estimates and geometry to probability and computer-assisted analysis. The full 3D existence-and-smoothness question remains completely, stubbornly open.

But here’s what people miss: we’ve learned an enormous amount from ninety years of failed attacks, and the collective picture is far richer than a simple “unsolved” label suggests. Entire strategies eliminated. Sub-cases closed. We know, with substantial progress: some subcases are resolved, several conditional criteria are understood, and major barriers are much clearer. What follows is a map of that progress.

Key milestones

Five results that reshaped the field:- 1934, Leray: Proved that global-in-time weak solutions exist for any reasonable initial data. Something persists forever. But does it stay smooth? That’s the question Leray couldn’t answer, and after ninety years, neither can anyone else.- 1982, Caffarelli, Kohn, Nirenberg: The set of possible singularities is extremely small: in the parabolic geometry natural to these equations, it has zero one-dimensional size. Vanishingly small. If blowup happens, it’s sparse beyond imagination.- 1984, Beale, Kato, Majda: Huge result. A smooth solution can only break down if the vorticity blows up, which gave the entire field one precise target: control the relevant vorticity norm strongly enough, and a smooth solution cannot break down at that time.- 2016, Tao: Constructed blowup for an averaged Navier-Stokes sharing the same energy and scaling properties as the real thing, which means a proof for the real equation has to use finer structure than energy estimates and scaling alone. A barrier. Not a solution.- 2022, Albritton, Brué, Colombo: Leray-Hopf weak solutions aren’t unique when you allow an external force. Bad news: the weakest solution class isn’t as tame as we’d hoped, and this forces a rethinking of what “solution” even means at this level.

Dive deeper

This page is a map, not the territory. For the details:

Subproblems

The tractable pieces: 2D regularity, axisymmetric flows, critical spaces, and other special cases where real progress has been made.

Approaches

The major strategies mathematicians are pursuing: energy methods, harmonic analysis, probabilistic techniques, convex integration, and computational approaches.

About this page

Last reviewed: March 2026. This page is a living directory. As new results appear and deeper articles go up, it’ll be updated.

Originally published on navier-stokes.org. The site covers the Navier-Stokes existence and smoothness problem with toggleable simple/rigorous explanations.

The Metrics Mirage: When Dashboards Become the Theatre of Competence

Executives present glowing KPI dashboards on a theatre stage while engineers behind the curtain struggle with failing machinery.

The Blind Control Room

Every organizational failure begins long before the moment of collapse.

In this series, we have traced how that failure becomes structurally inevitable. Episode 1 showed how incentives can make the wrong decisions rational. Episode 2 showed how bad news stops traveling upward. Episode 3 revealed how procedure can replace judgment. Episode 4 demonstrated how power can centralize while accountability disperses.

Episode 5 introduces the next fracture.

The control room goes blind.

Not because the instruments stop working, but because they start showing something else: a reality that no longer exists.

Core Thesis

Organizations rarely fail because they lack data. Modern organizations are saturated with data. Dashboards multiply, reports expand, and metrics proliferate.

Failure begins when measurement systems detach from reality.

Metrics are supposed to function as sensors — signals that help leaders understand the system they are steering. But when metrics become political instruments instead of diagnostic tools, their role changes. Numbers stop informing decisions; they begin defending reputations.

Dashboards no longer describe the organization. They begin protecting it from uncomfortable truths.

Leadership is no longer steering the system. They are performing competence inside it.

Why Metrics Have Authority

Metrics appear neutral. Numbers feel objective. Dashboards look scientific.

But every measurement system contains three hidden decisions: what gets measured, what gets ignored, and what gets rewarded.

Once incentives influence those decisions, the measurement system begins to drift. This drift rarely begins with deception. It begins with optimization. Teams optimize what is measured. Managers optimize what is rewarded. Organizations optimize what is visible.

Over time, the measurement system begins to reflect the priorities of survival rather than the realities of the system.

At that moment, the mirage begins to form.

The Diagnostic Question

When reality contradicts the dashboard, which one changes?

If the dashboard changes, the system is still healthy. If reality must adapt to the dashboard, the mirage has already formed.

How the Mirage Forms

The Metrics Mirage does not appear overnight. It develops gradually through a sequence of adjustments that each seem reasonable in isolation. Each adjustment protects a small piece of organizational stability — a milestone preserved, a target protected, a narrative maintained.

Over time, those adjustments accumulate until the measurement system no longer observes the organization it was designed to measure. Instead, it begins to simulate success.

This progression follows a recognizable pattern.

The Anatomy of the Metrics Mirage

Phase 1 — Metric Substitution

Measuring what is easy instead of what matters

Every measurement system begins with proxies. Velocity replaces quality, milestone completion replaces system stability, and documentation coverage replaces engineering understanding.

These proxies are necessary simplifications. But once careers depend on them, the proxies stop behaving like indicators. They become targets.

This dynamic was famously captured in Goodhart’s Law: When a measure becomes a target, it stops being a good measure.

At first the distortion is subtle. Teams prioritize the measurable, and the measurable slowly replaces the meaningful. The dashboard remains intact, but the signal begins to drift.

Executives present glowing KPI dashboards on a theatre stage while engineers behind the curtain struggle with failing machinery.When dashboards stop describing reality and start defending it. (Gemini generated image)

Phase 2 — Dashboard Greenwashing

Keeping the dashboard healthy without fixing the system

Once proxies become targets, a second behavior emerges: the dashboard must stay green.

This rarely requires falsification. It only requires redefining the reporting boundary.

Typical techniques include redefining milestone criteria, excluding unstable components from reporting, splitting failing work into smaller “green” units, and shifting risk to the next reporting cycle.

Each adjustment is defensible. Each adjustment stabilizes the dashboard. But the relationship between measurement and reality continues to weaken.

The dashboard still contains numbers, and the numbers are technically correct. But they no longer describe the system that produced them.

Phase 3 — Instrument Panel Capture

Managing the dashboard instead of the system

Eventually the measurement system becomes the primary interface between leadership and reality. Meetings revolve around dashboards, reviews revolve around KPI slides, and discussions revolve around traffic-light charts.

Attention shifts away from engineering reality and toward status presentation. The dashboard becomes the shared stage where competence is performed.

Everyone knows the numbers are incomplete. But questioning them creates friction, and friction is costly in systems where incentives reward alignment.

Gradually the dashboard stops being a tool. It becomes the reality the organization agrees to see.

Aircraft cockpit instruments show normal readings while the plane outside heads toward a storm.When the instruments lie, the pilot cannot steer properly. (Gemini generated image)

Phase 4 — Reality Detachment

When evidence contradicts the dashboard

Eventually reality intrudes. Integration failures appear. Operational problems surface. Performance deteriorates.

Yet the dashboard remains green.

Leadership now faces a choice: they can question the measurement system, or they can question the people raising concerns.

In organizations shaped by incentive collapse, silence, procedural substitution, and deniability engineering, the second option becomes easier.

The dashboard remains stable. Reality becomes the anomaly.

Why the Mirage Is Dangerous

The Metrics Mirage does not simply hide failure; it removes the organization’s ability to detect it.

Healthy systems rely on feedback loops. Metrics are supposed to function as sensors — instruments that inform control decisions.

When those sensors drift, the control system becomes blind. But it does not know it is blind. It continues to operate with full confidence in the information it receives.

That is the most dangerous state an organization can enter:

blind while believing it can see.

The Cost of the Mirage

Once metrics detach from reality, the consequences accumulate. Decisions are made from distorted signals, resources follow phantom priorities, teams optimize appearances rather than outcomes, and the gap between the dashboard and the system continues to widen.

Eventually the fiction collides with the physical world.

When that collision happens, it appears sudden. But the failure did not begin at the moment of impact. It began the moment the organization chose to trust the dashboard more than the system it was supposed to represent.

Bridge to Episode 6

If metrics can hide failure, another question becomes inevitable.

What happens to the information that does not fit the dashboard? What happens to the observations that cannot be reconciled with the official metrics? What happens to the people who still try to describe what the instruments no longer capture?

In organizations already shaped by incentives, silence, procedure, deniability, and measurement distortion, those signals become dangerous.

Not because they are wrong.

Because they threaten the story the system has learned to believe.

Next Episode

Episode 6 — Narrative Control
Fracture Pattern: How organizations manufacture the story they need to believe.

🔎 The Corporate Breakdown Files — Full Series Overview

  • Prologue — Power Without Accountability: How Modern Corporations Create Their Own Failures
  • Prequel — The Blind Spot: Why Companies Collapse While Leaders Celebrate
  • Episode 1 — The Incentive Collapse: When KPIs Turn Leaders into Saboteurs
  • Episode 2 — The Silence Weapon: When bad news stops flowing upward
  • Episode 3 — The Process Illusion: When documentation replaces decisions
  • Episode 4 — Deniability Engineering: How Leaders Delegate Blame but Centralize Power
  • Episode 5 — The Metrics Mirage
  • Episode 6 — Narrative Control
  • Episode 7 — The Gatekeeper Class
  • Episode 8 — Quiet Exits, Quiet Collapse
  • Episode 9 — The Conflict Vacuum
  • Episode 10 — Silo Warfare
  • Episode 11 — The Snap Moment
  • Episode 12 — Rebirth or Rot
  • Episode 13 — Scapegoat Economics

👉 New episodes released as the real-world case evolves.

🔖 Follow this series for real-world patterns of corporate dysfunction — and how to survive them.

© 2026 Abdul Osman. All rights reserved. You are welcome to share the link to this article on social media or other platforms. However, reproducing the full text or republishing it elsewhere without permission is prohibited.

When LLMs struggle: Architecture, context, and hidden complexity

The obvious LLM failures are easy to catch. Syntax errors, broken configs, a pipeline that refuses to run. You see the problem immediately and fix it. Those are not the ones that should worry you.

The ones that should worry you are the ones that look completely fine. The code runs. The config is valid. The output looks reasonable. And yet, when someone with more experience takes a look, the problems become obvious immediately. They were just invisible to you.

The knowledge mirror

There is a pattern I noticed pretty quickly when working on tasks outside my main area.

When I work in areas I know well, like Terraform or CI/CD pipelines, I can evaluate the model’s output almost automatically. I know what good looks like, I know the common failure patterns, and I catch mistakes fast. The feedback loop is tight.

But when I work on something I know less about, that feedback loop breaks. And the problem is that the model does not help you here at all. It does not become more cautious in unfamiliar territory. It does not tell you when it is guessing. It produces the same confident, well-formatted output regardless of whether it is right or wrong.

Anthropic’s engineering team documented the same behavior when building multi-agent coding harnesses. Their published observation: when asked to evaluate their own output, agents reliably respond by confidently praising it, even when the quality is obviously mediocre to a human observer. The confidence is not correlated with the actual quality of the work.

So what you end up with is a mirror: the model reflects your level of knowledge back at you. If you know the domain, you catch the mistakes. If you do not, you miss them. And the less you know, the more you are at the mercy of output you cannot properly evaluate.

In practice, for me this showed up most clearly in development tasks. There are usually several valid ways to implement the same thing in code, and the right choice depends on context, team conventions, performance requirements, and a lot of other things the model cannot know. If you are not familiar enough with those trade-offs yourself, the model will just pick one. And if you do not notice, it gets built on.

The problem with architectural decisions

LLMs are actually quite good at implementing things. Give the model a clear approach and it will execute it well. The problem is when you ask it to choose the approach.

Architectural decisions involve context the model simply does not have: your team’s skill level, how much complexity the team can realistically own and maintain at once, which parts of your system are already overengineered, the operational cost of what it is about to build, your future plans. Without that, it defaults to what it has seen most in training data, which is usually the textbook approach or the most complex one, not necessarily the most appropriate one for your situation.

In DevOps this matters more than it might seem, because infrastructure decisions have long tails. A bad pattern in a Terraform module layout, a poorly thought-out pipeline structure, a dependency that should not be there, these things propagate. Fixing them later is far more expensive than catching them early.

There is also the consistency problem. The model has absorbed a lot of old documentation and outdated best practices, and it has no sense of what is current or what fits your context. So it might solve the same kind of problem in two different places in your codebase using two completely different approaches. Both technically valid, but inconsistent in ways that make things harder to maintain over time.

The practical answer is documentation: write down your decisions and conventions and feed them to the model. This genuinely helps. But the model does not always follow the rules you set for it, especially on longer tasks. You still need to review what it produces. Documentation reduces the drift, it does not eliminate it.

A concrete example: a colleague was working on changes that touched multiple Terragrunt module levels and wanted to structure it as a single PR. The constraint is straightforward: you cannot use outputs from one level in another before applying the first one, so the rule is one PR per level. The fix: use git checkout origin/main -- path_to_file to revert the level-two file back to main in your current branch, open the first PR, merge and apply it, then create a second PR with the level-two changes. She had already asked Copilot. It had given her something much longer and more complicated.

The one thing to watch: if the reverted file had significant changes in it, save or stash them before running the checkout, because it will wipe them from your branch.

A model that produces something technically correct but architecturally wrong is in some ways more dangerous than one that produces something broken, because at least broken things announce themselves.

When the model starts looping

The other failure mode that shows up regularly is looping. You give the model a problem, it gives you an answer, the answer is wrong, you tell it so, it gives you a variation, that is also wrong, and so on. Anthropic’s engineering team describes the same failure in the same terms for longer agentic tasks: on complex work, the agent tends to go off the rails over time, producing increasingly elaborate answers that are no more correct than the first one.

A good example of this from my own work: I was building a GitLab CI pipeline and wanted to keep it DRY. The changes: blocks that control when jobs run were being repeated across every rule, so I asked the model to clean it up using YAML anchors. It produced something that looked completely reasonable, valid YAML, clean structure. The pipeline failed. I fed the error back. It adjusted. Still failed. A few iterations in, the suggestions were getting more elaborate but the pipeline kept breaking in the same way.

The next article in this series gets into exactly why this happens with GitLab specifically, and what the pattern looks like in practice. The signs are pretty recognizable once you have seen it a few times: the answers are getting longer but not more correct, the error is not actually changing between iterations, and you are spending more time explaining the problem than it would take to just fix it.

The right move at that point is to stop, step back, figure out the root cause yourself, and either fix it directly or come back to the model with a much more specific prompt that contains the missing context. What does not work is adding more context and hoping the next attempt will break the pattern. Usually it does not.

Senior knowledge is more important, not less

In practice I have found the opposite of what the “AI replaces engineers” conversation suggests.

With LLMs, experienced engineers spend less time writing code and config and more time reviewing output, catching bad patterns and making architectural decisions. The volume of output goes up significantly, which means the demand for quality review goes up with it. And here is the uncomfortable part: a junior engineer can now generate code faster than a senior engineer can critically audit it. The rate-limiting factor that used to keep review meaningful has been removed.

If you do not have the experience to evaluate what the model produces, you are not doing less work. You are just accumulating a gap between how much exists in your codebase and how much anyone genuinely understands. Addy Osmani calls this comprehension debt, and the pattern he describes maps closely to what I have been seeing in practice.

The value of experience has not disappeared. It has moved to a different place in the workflow.

The takeaway

LLMs struggle most where human expertise matters most: architectural decisions, trade-off reasoning, domain-specific behavior. That is not a reason to avoid using them in those areas. It is a reason to stay engaged as the expert when you do.

One of the most concrete examples of this I have seen is GitLab pipelines, where the model is technically correct about YAML and completely wrong about GitLab’s implementation at the same time. If that sounds familiar, that is exactly what the next article in this series is about.

Using the Lightning Anchor Fee Bumping Service: A Frontend Walkthrough

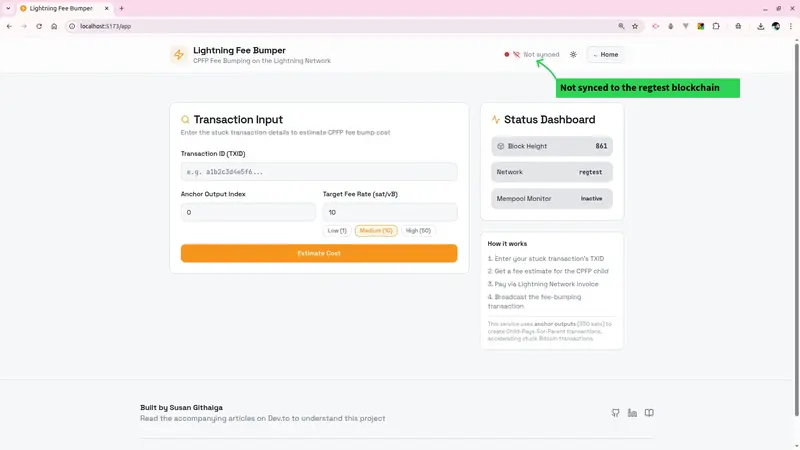
App overview showing the Transaction Input form and Status Dashboard

Welcome to Part 6 of my Lightning Anchor Fee Outputs Series

In the previous articles, we built the entire backend for a Lightning powered CPFP fee bumping service. From Bitcoin RPC integration, to LND invoice creation, to broadcasting the child transaction.

In this final part, I will walk you through the frontend and show you exactly how to use the service end to end.

What the Service Does

When a Bitcoin transaction gets stuck in the mempool due to low fees, you can use Child-Pays-For-Parent (CPFP) to accelerate/unstuck it. Our service uses the anchor output as the input for a child transaction that pays a higher fee. You pay for this service via a Lightning invoice, and the service broadcasts the fee-bumping transaction on your behalf.

Prerequisites

Before using the frontend, make sure the following are running:

  • Docker containers: bitcoin-regtest, lnd-alice, postgres-db, redis-cache
  • Backend server on port 3000 (npm run dev in /backend)
  • Frontend on port 5173 (npm run dev in /frontend)
# Start all Docker services
cd backend
docker compose up -d

# Terminal 1: Start backend
cd backend && npm run dev

# Terminal 2: Start frontend
cd frontend && npm run dev

Step 1: The Status Dashboard

When you open the app at http://localhost:5173 and click on Get Started, the first thing you’ll notice on the right side is the Status Dashboard.

App overview showing the Transaction Input form and Status Dashboard

After the backend syncs to the regtest blockchain, the dashboard shows:

  • Block Height — the current regtest block height, confirming Bitcoin Core is synced
  • Network — regtest for local development
  • Mempool Monitor — shows Inactive until a transaction is submitted

If Block Height shows a number (861 in our case), your backend is successfully connected to the regtest blockchain network.
If it shows an error, check that your backend is running.

App overview showing the Transaction Input form and Status Dashboard

Step 2: Creating a Test Transaction

Before using the fee bumper, you need a stuck transaction to work with. In regtest, we create one manually:

First, get the service wallet address:

SERVICE_ADDR=$(curl -s http://localhost:3000/api/v1/bitcoin/wallet-address | jq -r '.data.address')
echo "Service wallet address: $SERVICE_ADDR"

Then send 330 sats to it and capture the TXID:

TXID=$(docker compose exec bitcoin bitcoin-cli -regtest 
  -rpcuser=bitcoinrpc -rpcpassword=changeme 
  -rpcwallet=testwallet sendtoaddress $SERVICE_ADDR 0.00000330)
echo "TXID: $TXID"

Expected output

Expected output

Copy the TXID(Transaction Id) as you’ll need it in the next step. My TXID in this case is 59224b8385c5dd882f0a1f48b11e05fbe0e9fdab414344f8fd5f725b6571661a

Step 3: Estimating the Fee

Paste your TXID into the Transaction ID field. Set the Anchor Output Index (usually 0) and choose a Target Fee Rate.

Three fee rate presets are available:

Preset Rate Use case
Low 1 sat/vB Non-urgent, patient
Medium 10 sat/vB Standard confirmation
High 50 sat/vB Urgent, next block

Click Estimate Cost. The Fee Estimation panel below will populate with:

  • Child Fee Needed — the fee the child transaction must pay
  • Total Fee Needed — child fee plus the service fee
  • Parent Fee Rate — what the stuck transaction is currently paying
  • Feasibility indicator — confirms the anchor output can cover the bump

Fee Estimation panel showing 2369 sats child fee, 2510 sats total, and a green Feasible badge

Feasible vs Non-Feasible Transactions

The 330-sat anchor feasible badge tells you whether the service can actually bump your transaction.

Feasible (green badge) means the anchor output in your transaction is a valid 330-satoshi output that the service can spend as the CPFP child input. The child transaction can pay enough to bring the combined package fee rate up to your target. You can proceed to generate an invoice and broadcast.

Not feasible (red badge) means one of the following is true:

  • The output at the specified index is not a 330-satoshi anchor output
  • The parent transaction’s fee rate is already at or above your target. There is nothing to bump
  • The TXID does not exist in the mempool or the local blockchain

If you see a non-feasible result, double-check that you are using the correct Anchor Output Index — try 0, 1, or 2 depending on which output in the transaction is the anchor. Also confirm the transaction is genuinely stuck by checking its current fee rate against your target..

Sample non-feasible output
Not feasible

Step 4: Generating the Lightning Invoice

Once the estimate looks good, scroll down and click Generate Invoice. The backend calls LND via gRPC to create a Lightning invoice for the exact fee amount.

The Lightning Invoice panel appears with:

  • A QR code you can scan with any Lightning wallet
  • The amount in satoshis
  • The payment hash for tracking
  • A Copy Invoice button to copy the raw lnbc... invoice string

Lightning Invoice section showing QR code, amount, payment hash, and Copy Invoice button

In production, your user scans this QR code with their Lightning wallet and pays. In regtest, you can pay it programmatically:

# Pay the invoice from a second LND node (if you have one set up)
docker compose exec lnd lncli --network=regtest payinvoice <INVOICE_STRING>

Expected output:

self-payments not allowed

The error self-payments not allowed means you’re trying to pay an invoice from the same LND node that created it. You can’t pay yourself on Lightning.

Coming Up Next

In the next article, we step out of regtest and into the real Bitcoin network, mainnet.

To continue from here on mainnet, we’ll need to:

  • Spin up a Lightning node connected to the live Bitcoin network
  • Migrate the project configuration from regtest to mainnet

By doing this, we’ll be able to handle real invoices paid by real wallets

Part 7: Going Live — Migrating to Mainnet →
(Link will be updated when the article is published)

What We Built Across This Series

Over six parts, we’ve gone from understanding what anchor outputs are to building and using a fully functional fee bumping service:

  • Parts 1–2: What anchor outputs are and why they exist in Lightning commitment transactions
  • Part 3: Setting up the backend, Bitcoin RPC integration, and Docker environment
  • Part 4: Integrating LND for Lightning invoice creation and payment verification
  • Part 5: Building the CPFP transaction constructor and broadcast endpoint
  • Part 6 (this article): Walking through the React frontend and completing the end-to-end flow

The full source code is on GitHub. If you found this series useful, feel free to connect on LinkedIn or follow along on Dev.to.

The Interface Stack Has a Missing Layer

Google DeepMind just released a browser that generates entire websites from a single sentence. You type “a guide to watering my cheese plant,” and Gemini 3.1 Flash-Lite writes a complete page — navigation, layout, content — in under two seconds. No server. No pre-built HTML. The page is born the moment you ask for it.

The Flash-Lite Browser is a striking demo. But it also exposes a structural gap in how we think about agent interfaces. The industry is converging on an architecture — CLI for agents, protocols for communication, generated GUI for humans — but this three-layer stack is missing something critical.

The Three-Layer Interface Stack

A pattern is forming across the agent ecosystem. It looks like this:

Bottom layer: CLI is the agent runtime. Agents operate through text commands — structured input, structured output, composable pipelines. This is their native language. Claude Code, GitHub Copilot CLI, and every MCP-connected agent speak CLI first.

Middle layer: Protocols connect agents to the world. MCP connects agents to tools. AG-UI connects agents to frontend interfaces. A2UI lets agents describe UI components declaratively. A protocol triangle is taking shape.

Surface layer: GUI becomes what AI generates for humans. Flash-Lite Browser is the extreme case — the entire page is AI-generated. But even conventional agent UIs (chat interfaces, dashboards, reports) are increasingly produced by models rather than designed by humans.

This three-layer view is useful. It explains why terminal usage among professional developers jumped from 62% to 78% in two years (Stack Overflow Developer Survey). It explains why Claude Code reached $1B ARR within months of launch. And it explains why Google is experimenting with browsers that generate rather than fetch.

But it describes architecture. It says nothing about dynamics.

The Missing Fourth Layer: Selection Pressure

Here is the question the three-layer model does not answer: when a hundred agents can all generate a UI, which one should you trust?

Flash-Lite Browser generates a plant care page in 1.93 seconds. Impressive. But as The Decoder noted, “results are not stable — content quickly drifts off-topic.” The same query produces different layouts. Navigation leads to inconsistent pages. The content is plausible but unreliable.

This is not a model quality problem that will be solved by the next generation of LLMs. It is a selection problem. When interfaces are generated rather than designed, you need a mechanism to evaluate which generation approach produces better outcomes — and to let bad approaches fade away.

In biology, that mechanism is natural selection. In software, we have been building its equivalent.

The Rotifer Protocol introduces a competitive evaluation layer where modular capabilities — called Genes — are scored by a multiplicative fitness function:

$$
F(g) = frac{S_r cdot log(1 + C_{util}) cdot (1 + R_{rob})}{L cdot R_{cost}}
$$

Success rate, community utility, robustness, latency, cost — all measured, all weighted, all used to rank competing implementations. Genes that score well propagate. Genes that score poorly retire. The selection pressure is quantified and continuous.

This is the missing fourth layer: evolution infrastructure. Not just connecting agents to tools (protocols do that), but deciding which tools survive.

Protocols Connect. Evolution Selects.

MCP is a connectivity standard. It tells an agent how to discover and invoke a tool. But it says nothing about whether the tool is any good.

Consider an agent choosing between three MCP-connected tools that all claim to generate plant care guides. MCP ensures the agent can call any of them. But which one produces accurate watering schedules? Which one formats content clearly? Which one hallucinates less?

Without a fitness layer, the agent has no signal. It picks randomly, or picks the first one it finds, or picks the one with the most downloads — none of which correlate reliably with quality.

The Arena provides that signal. Competing Genes run against standardized benchmarks. Their fitness scores are public. Agents can query the registry and select the highest-ranked Gene for a given task. The selection is data-driven, not arbitrary.

This pattern — protocol for discovery, evolution for quality — is the full stack.

The Reliability Problem Reframed

The criticism of Flash-Lite Browser is that results are unstable. Every render differs. Same query, different layout.

But instability is not inherent to AI-generated interfaces. It is a symptom of missing selection pressure. When there is no mechanism to evaluate which generation approach works better, every approach is equally likely to be used — including bad ones.

Imagine a world where UI generation Genes compete in an Arena. A Gene that produces consistent, readable plant care pages scores higher than one that drifts off-topic. Over time, the drift-prone approach is selected against. The ecosystem converges toward reliability — not because someone manually debugged each page, but because the fitness function rewards consistency.

This is how biological systems solve the reliability problem. Not through top-down design, but through bottom-up selection.

Four Layers, Not Three

The complete agent interface stack is not three layers. It is four:

Layer Function Example
CLI Agent runtime Terminal commands, structured I/O
Protocols Discovery and communication MCP, AG-UI, A2UI
GUI Human-readable output AI-generated pages, dashboards
Evolution Quality selection Fitness scoring, competitive ranking

The first three layers describe what agents can do. The fourth layer determines which agents do it well.

Google’s Flash-Lite Browser is a preview of the GUI layer’s future. MCP is establishing the protocol layer. CLI has been the agent runtime for over a year. But without evolution infrastructure, the stack is incomplete — beautiful demos that produce unreliable results.

The interface revolution is real. The question is whether we build the selection layer before or after unreliable agent outputs erode user trust.

We think before.

rotifer.dev

We scanned 3,000 healthcare repositories. Here’s what we found in CDC, VA, NHS, and Google’s code.

Every year, healthcare organizations spend billions on compliance.
Auditors review policies. Security teams run vulnerability scans.
Certifications get renewed. And yet the actual code running on
production healthcare systems, the code that handles your medical
records, your Social Security Number, your vaccination history,
remains largely unexamined.

We decided to examine it.

Over the past several months, we built a static analysis engine
that reads healthcare source code the way a compliance auditor
would, mapping code patterns directly to specific HIPAA sections,
GDPR articles, SOC 2 criteria, and India’s DPDPA requirements.
Then we pointed it at 3,000 public healthcare repositories spanning
9 programming languages and 4 continents.

13,427 confirmed violations. 43.6% of repositories affected.

The organizations involved are not small or obscure. They include
the US Centers for Disease Control, the US Department of Veterans
Affairs, NHS England, Google, and some of the most widely deployed
open-source healthcare platforms in the world.

The gap nobody is closing

Here is the compliance problem nobody talks about.

Security scanners like Snyk and Semgrep find known vulnerabilities,
outdated dependencies, common attack patterns, CVEs. Compliance
audits check whether policies exist, whether a Business Associate
Agreement is signed, whether an access control policy is documented.

Neither examines whether the application code actually implements
the safeguards that regulations require.

A hospital can have a perfect HIPAA policy document and a clean
Snyk scan while its billing export writes every patient’s Social
Security Number to a plaintext CSV file on the server filesystem.
That is not a hypothetical. That is OpenEMR, the most widely
deployed open-source EMR with over 100,000 installations worldwide.

This is the gap. And it is systemic.

What we actually found

The VA knew and suppressed it

The US Department of Veterans Affairs notification-api handles SMS,
email, and push notifications for 9 million veterans deployed to
AWS GovCloud.

One Lambda function disables TLS certificate verification with
verify=False. Alongside it sits an explicit # nosec annotation,
a security scanner suppression comment used by developers to silence
warnings they don’t want to fix.

The development team was aware this was a security issue. They
suppressed the warning and deployed to production anyway. Veteran
phone numbers and SMS content are logged in plaintext. All affected
functions deploy across dev, staging, perf, and prod environments
via GitHub Actions.

NHS England queries 58 million patient records with TLS disabled

OpenSAFELY is a secure analytics platform for NHS England
electronic health records. The cohort-extractor tool queries
patient data from approximately 58 million NHS patients.

TLS certificate verification is unconditionally disabled for its
EMIS database connection. Security warnings are globally suppressed.
A TODO comment in the code confirms the developers are aware:

# TODO remove this when certificate verification reinstated

The TODO is still there.

India’s vaccination platform logged Aadhaar numbers to stdout

India’s DIVOC platform powered the national COVID vaccination
certificate system used by hundreds of millions of Indian citizens.

The code serializes the entire certificate request to application
logs, Aadhaar number, name, date of birth, gender, phone number,
home address, for every single certificate created. A separate
analytics consumer prints every Kafka vaccination message to stdout
unconditionally with no feature flag, no log level gate, and no
way to disable it without modifying source code.

Production CoWIN URLs in the Kubernetes deployment configs confirm
this ran on India’s national vaccination infrastructure.

We reported this to CERT-In on March 23, 2026.

OpenEMR writes patient SSNs to plaintext CSV files

OpenEMR’s billing export feature writes patient Social Security
Numbers, names, dates of birth, addresses, and phone numbers to a
plaintext CSV file via fwrite(). Zero encryption. No audit trail.

When we contacted the OpenEMR security team, they confirmed this
is intended functionality, citing HIPAA’s “addressable”
specification as placing the obligation on the deploying
organization.

100,000+ installations. Every one generating unencrypted files
containing the most sensitive category of patient data with no
application-level option to encrypt them.

The finding that should concern everyone most

Of everything we found, one pattern stands out as the most
forward-looking risk.

Across 3,000 repositories, our analysis detected 657 confirmed
instances of patient medical data flowing into AI and machine
learning pipelines without de-identification. This includes CSV
exports fed into model training, inference calls containing
identifiable patient records, and analytics pipelines processing
raw PHI.

Metriport, a funded healthcare API company, sends patient medical
record data to an AI model via Amazon Bedrock. No de-identification
or tokenization is visible before the API call.

This is not a niche finding. As healthcare organizations race to
adopt AI for clinical decision support, triage automation, and
population health analytics, PHI is flowing into these pipelines
at scale. Traditional security scanners were not built to detect
this pattern. Most compliance frameworks have not yet caught up
with it either.

The code is ahead of the regulations. And the data is already
moving.

Why this keeps happening

Compliance failure in our dataset does not correlate with funding,
team size, or institutional credibility. The VA has significant
engineering resources. NHS England runs one of the largest health
data platforms in the world. Google has some of the best security
engineers on the planet.

The correlation is simpler: nobody checked the code.

Not because organizations are negligent. Because the tools and
processes that exist today were not designed to check it. Security
scanners operate at the dependency and vulnerability layer.
Compliance audits operate at the policy and process layer. The
application code layer, where PHI actually moves, where encryption
actually gets implemented or skipped, where logging decisions
actually get made, sits between these two worlds largely unexamined.

That is the gap. And until it gets closed, compliance certifications
will continue to mean less than they should.

What this means for patients

You have no way of knowing whether the healthcare application
handling your data was ever checked at the code level for
compliance. Your provider may have passed a HIPAA audit. Their
software vendor may have a SOC 2 certificate. Neither guarantees
that your Social Security Number is not being written to a plaintext
file somewhere on a server filesystem.

That is not a reason for panic. It is a reason for the industry
to close a gap that has been ignored for too long.

All affected organizations were notified through responsible
disclosure channels prior to publication.

“I Found the Underground Map of Free LLM APIs — Then Wired Them All Into One Proxy”

There are two kinds of developers in 2026.

The first kind is paying for every AI request like it’s normal.

The second kind is quietly collecting free quotas, trial credits, OpenAI-compatible endpoints, Gemini access, Groq speed, random hidden gems, and stitching them together into one ridiculous local setup.

This post is for the second kind.

The Real Problem Isn’t “Which Model Is Best?”

The real problem is this:

  • One provider gives you speed
  • Another gives you free credits
  • Another gives you decent coding models
  • Another looks promising but isn’t integrated yet
  • And your tools? They all want different configs, different keys, and different endpoints

So your stack turns into a graveyard of:

  • half-used trial credits
  • forgotten API keys
  • rate-limited accounts
  • browser bookmarks you’ll never open again

So I Built the Map

ProxyPool Hub now includes a Resources Catalog: a dedicated page that tracks free and trial LLM API platforms in one place.

Not just a dumb markdown list.

A real, filterable directory.

You can now browse a curated catalog of providers like:

  • OpenRouter
  • Google AI Studio
  • Groq
  • Cerebras
  • SambaNova Cloud
  • Hyperbolic
  • Scaleway Generative APIs
  • and more

Each entry includes:

  • whether it’s free or trial
  • whether ProxyPool Hub already supports it
  • representative models
  • signup requirements
  • quota notes
  • compatibility details
  • whether it can be preset directly into the proxy

In other words:

it doesn’t just tell you what’s out there — it tells you what you can actually use right now.

This Is Where It Gets Dangerous (In a Good Way)

Because ProxyPool Hub isn’t just a resource browser.

It’s also the thing that lets you use those resources without losing your mind.

1. Free Model Routing

The new free model flow lets lightweight requests route to free providers automatically.

So instead of burning paid credits for every tiny task, you can push fast or low-cost workloads toward free-tier resources.

That means:

  • quick coding questions → free routes
  • lightweight model tasks → free routes
  • expensive reasoning jobs → your better accounts or keys

It’s not just cheaper.

It changes your whole cost model.

2. Load Balancing Across API Keys

Most people use API keys like this:

  1. Add one key
  2. Use it until it breaks
  3. Panic
  4. Switch manually

ProxyPool Hub does the opposite.

It watches all your available keys and picks the one with the fewest requests first.

That’s simple load balancing, but the practical effect is huge:

  • your keys last longer
  • rate limits hit later
  • traffic spreads out automatically
  • failures become much less noticeable

It feels less like “using an API key”

and more like running your own tiny inference mesh on localhost.

3. Pooling Accounts and Providers Like a Greedy Goblin

This is the part I like the most.

You don’t have to marry one provider.

You can build a setup like this:

  • OpenRouter for rotating free models
  • Google AI Studio for Gemini access
  • Groq when you want stupid-fast responses
  • Cerebras when you want extra OpenAI-compatible capacity
  • SambaNova / Hyperbolic / Scaleway for trial credits
  • your own Claude / OpenAI / Azure accounts for the heavy jobs

Then point your tools at one local address.

That’s the whole trick.

Your tools don’t need to know your secret economy.

They just talk to the proxy.

4. The Catalog Is Actually Strategic

The smart part of the Resources Catalog isn’t that it lists providers.

It’s that it classifies them by practical usability:

  • supported → already works cleanly with ProxyPool Hub
  • presettable → can be slotted in with current patterns
  • candidate → promising, but needs extra adapter work
  • catalog only → good to know, not worth pretending it’s plug-and-play yet

That’s rare.

Most AI lists are fluff.

This one is operational.

It answers:

“Can I actually use this in my setup today?”

Why This Matters

Because the AI tooling world is getting weirder, not simpler.

Every month, new free endpoints appear.
Every week, quotas change.
Every day, someone discovers another provider with surprise credits and weird limits.

If you don’t organize that chaos, you waste it.

ProxyPool Hub now gives you both sides of the game:

  • Discovery — find free/trial opportunities fast
  • Execution — route, pool, balance, and survive rate limits

The Vibe

This is no longer just “a proxy for Claude Code and Codex.”

It’s becoming something more interesting:

a local control plane for AI tool traffic.

One place to:

  • discover providers
  • compare quotas
  • pick usable free options
  • spread load across keys
  • route by app
  • preserve paid credits
  • keep your CLI tools working even when one provider taps out

Try It

npx proxypool-hub@latest start

Then open:

  • http://localhost:8081 → dashboard
  • http://localhost:8081/resources/ → free & trial resources catalog

Links

If you’re the kind of developer who keeps a secret stash of trial credits and free endpoints, this might be your new favorite project.

And if you’re not?

Give it a week.

ProxyPool Hub is open-source under AGPL-3.0. Not affiliated with Anthropic, OpenAI, Google, or any listed provider.

KubeVirt v1.8 Brings Multi-Hypervisor Support and Confidential Computing to Kubernetes

Version 1.8 of KubeVirt was announced at KubeCon + CloudNativeCon Europe 2026. The release is aligned with Kubernetes v1.35, and the most significant addition is a Hypervisor Abstraction Layer (HAL) that allows the project to use backends other than KVM. In an announcement post on the CNCF blog, the maintainers announced the new release, broken down by their SIGs.

By Matt Saunders