SQLite Interface Handler: Understanding the sqlite3 Core Structure

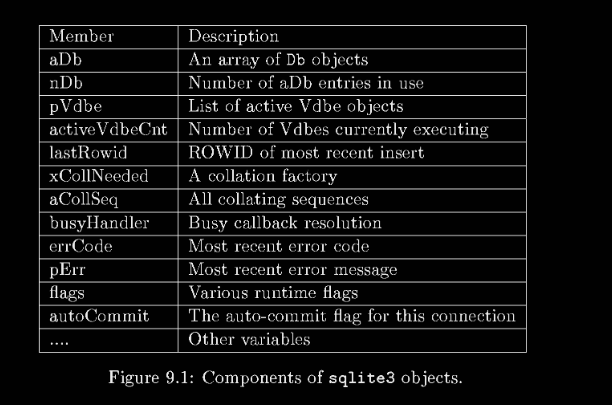
Figure 9.1: Components of sqli te3 objects

Hello, I’m Maneshwar. I’m building git-lrc, an AI code reviewer that runs on every commit. It is free, unlimited, and source-available on Github. Star Us to help devs discover the project. Do give it a try and share your feedback for improving the product.

In earlier discussions, we explored several internal control data structures in isolation, each serving a specific purpose inside SQLite.

However, understanding SQLite in fragments can feel like looking at puzzle pieces without seeing the full picture.

This chapter ties everything together.

At the center of SQLite’s architecture lies the sqlite3 structure, which acts as the main interface between the application and the database engine.

By studying this structure and its relationships with other components, you get a complete, end-to-end understanding of how SQLite organizes and manages its internal state.

The sqlite3 Structure

Whenever an application calls the sqlite3_open API, something important happens behind the scenes.

SQLite initializes a new database connection (also called a session) and prepares access to the database file.

This process results in the creation of a sqlite3 object, and the application receives a pointer to it.

That pointer is not just a reference—it represents the entire connection.

Every subsequent database operation performed by the application goes through this handle, until the connection is closed using sqlite3_close.

It’s important to note that the application should never directly modify the internal fields of this object.

It is strictly managed by SQLite itself.

Internal Composition of sqlite3

One of the most important members of the sqlite3 structure is aDb, which is an array of Db objects.

Each Db object represents a database associated with the connection.

Typically:

  • aDb[0] → Main database
  • aDb[1] → Temporary database

Additional entries appear when databases are attached dynamically during runtime.

Internally, SQLite does not refer to databases by name. Instead, it uses their index within the aDb array. This mapping from name to index is resolved during query compilation.

The nDb variable keeps track of how many databases are currently active in the connection.

Figure 9.1: Components of sqli te3 objects

The Db Structure

Each entry in the aDb array is a Db object, and it contains essential metadata about a database.

Key components include:

  • zName → Name of the database
  • pBt → Pointer to the B-tree structure (core storage engine)
  • inTrans → Current transaction state
  • pSchema → Pointer to schema information

The schema itself is a rich structure containing multiple hash tables and metadata used for query processing and validation.

Schema Organization

The schema is where SQLite keeps track of all structural elements of a database.

Important members include:

  • schema_cookie → Version of the schema
  • cache_size → Page cache configuration
  • tblHash → All tables and views
  • idxHash → All indexes
  • trigHash → All triggers
  • fkeyHash → All foreign keys
  • pSeqTab → Pointer to the sqlite_sequence table

When a database is opened, SQLite parses its schema and populates these hash tables.

This allows fast lookup and efficient query planning.

Table Representation in Memory

Each SQL table is represented internally as a Table object.

This object contains an array called aCol, which holds all column definitions. Each column is described by a Column object.

Figure 9.2: Components of Table objects

Index Representation

Indexes are also represented as structured objects in memory.

An Index object contains:

  • aiColumn → Array mapping index columns to table columns
  • tnum → Page number where the index root resides

This allows SQLite to efficiently locate and traverse indexed data during query execution.

Figure 9.3: Components of Index objects

Runtime State and Execution

The sqlite3 structure also keeps track of runtime execution details:

  • lastRowid → The most recent row ID generated by an INSERT
  • errCode / pErr → Error tracking
  • flags → Current runtime state
  • pVdbe → Collection of compiled SQL statements

Each compiled SQL statement is represented as a VDBE (Virtual Database Engine) program.

These are essentially bytecode instructions executed by SQLite’s internal engine.

Applications interact with these compiled statements using sqlite3_stmt pointers.

Putting It All Together

The sqlite3 structure is not just a container—it is the central hub that connects:

  • Database files (Db)
  • Storage engine (B-tree)
  • Schema metadata
  • Tables and indexes
  • Query execution engine (VDBE)

Every SQL query flows through this structure.

From parsing and compilation to execution and result retrieval, everything is orchestrated through sqlite3.

git-lrc
*AI agents write code fast. They also silently remove logic, change behavior, and introduce bugs — without telling you. You often find out in production.

git-lrc fixes this. It hooks into git commit and reviews every diff before it lands. 60-second setup. Completely free.*

Any feedback or contributors are welcome! It’s online, source-available, and ready for anyone to use.

⭐ Star it on GitHub:

GitHub logo

HexmosTech
/
git-lrc

Free, Unlimited AI Code Reviews That Run on Commit

AI agents write code fast. They also silently remove logic, change behavior, and introduce bugs — without telling you. You often find out in production.

git-lrc fixes this. It hooks into git commit and reviews every diff before it lands. 60-second setup. Completely free.

See It In Action

See git-lrc catch serious security issues such as leaked credentials, expensive cloud
operations, and sensitive material in log statements

git-lrc-intro-60s.mp4

Why

  • 🤖 AI agents silently break things. Code removed. Logic changed. Edge cases gone. You won’t notice until production.
  • 🔍 Catch it before it ships. AI-powered inline comments show you exactly what changed and what looks wrong.
  • 🔁 Build a…

Help Me!!

I encountered an issue with Git that I’ve been unable to fully resolve.

While I’ve successfully addressed most related problems, one issue still remains. Specifically, the git clone command does not work on my secondary drives (D: and E:).
Although it functions correctly on my primary drive(C:).

I have already attempted to modify the permissions for these drives, but this has not resolved the problem.

If you have experience with Git or have encountered a similar issue, your guidance would be greatly appreciated.

What Claude Code stores on your machine (and how to see it)

Claude Code keeps a lot of data in ~/.claude/ that most people never look at. I wanted to know what was there, so I built a scanner.

On my machine it found:

  • 76 persistent memory files across 10 projects
  • 4,445 session transcripts totaling 1.8GB
  • 2.2GB total data footprint

The memory files are markdown with frontmatter, organized by type: what Claude thinks your role is, feedback you’ve given, project context, reference links. It remembers more than you’d expect.

The tool

npx agentlens scan

No API keys, no accounts. Reads local files only.

Scan commands

  • agentlens memory — what Claude remembers about you
  • agentlens costs — token usage by model and project
  • agentlens features — active feature flags on your account
  • agentlens sessions — transcript stats and tool usage
  • agentlens privacy — total data footprint

Action commands

  • agentlens clean --dry-run — preview which memories would be deleted
  • agentlens redact — find secrets that leaked into memory files
  • agentlens diff save — snapshot current state, then diff show to compare later
  • agentlens export — dump everything to portable JSON

What surprised me

The sensitivity scanner flagged 13 potential secrets in my memory files. Most were false positives (the word “token” in pricing discussions), but some were file paths and references I wouldn’t want in a shared context.

Session transcripts contain everything: every file you read, every bash command you ran, every edit you made. If you’ve ever read a .env file during a Claude Code session, it’s in there.

Stack

~900 lines of TypeScript. Node 18+. Dependencies: chalk, commander, glob, yaml. MIT licensed.

GitHub: https://github.com/katrinalaszlo/agentlens

Would love to hear what you think!

Using RAII to Add Budget and Action Guardrails to Rust AI Agent

Rust is a strong fit for agent runtimes, but until now it has largely lacked a first-class runtime and budget enforcement layer.

We built cycles to add pre-execution budget and action control to Rust agents with an API that leans into ownership and compile-time safety.

The key ideas:

  • commit(self) consumes the guard, so double-commit becomes a compile-time error
  • #[must_use] helps catch ignored reservations
  • Drop triggers best-effort release if a guard is never finalized
  • one lifecycle works across simple calls, streaming, and multi-agent workflows

The guide walks through three integration levels:

  1. with_cycles() for simple LLM/tool calls
  2. ReservationGuard for streaming and manual commit
  3. low-level client methods for custom lifecycles

It also covers caps-aware execution:

  • max token caps
  • tool allow/deny lists
  • step limits
  • cooldowns

And a practical rollout path:

  • start in dry_run
  • inspect decisions and caps
  • move to partial enforcement
  • then hard limits

Full guide: https://runcycles.io/blog/how-to-add-budget-and-action-guardrails-to-rust-ai-agents-with-cycles

Docs: https://runcycles.io/quickstart/getting-started-with-the-rust-client

Repo: https://github.com/runcycles/cycles-client-rust

Your Agent Monitoring SDK Was the Backdoor

On March 24, 2026, a supply chain attack against LiteLLM — one of the most widely deployed LLM proxy and observability libraries — compromised the PyPI packages used by engineers to instrument their AI agents. The attacker had already worked through two upstream targets: Aqua Security’s Trivy scanner (March 19), then Checkmarx’s KICS and AST GitHub Actions (March 23). LiteLLM’s CI/CD pipeline ran Trivy without a pinned version, which is how the attacker extracted the PyPI publishing token from the GitHub Actions runner. The malicious versions (1.82.7 and 1.82.8) were live on PyPI for approximately three hours before LiteLLM took them down.

The payload installed by the compromised packages ran a three-stage operation: credential harvesting from cloud environments, lateral movement through Kubernetes clusters, and a persistent backdoor for remote code execution. Every API key passing through LiteLLM — OpenAI, Anthropic, Azure, Google — was potentially in scope.

The monitoring layer wasn’t a side effect of the attack. It was the target.

AI agent observability supply chain risk refers to the class of security vulnerabilities that arise when the SDKs, proxies, and telemetry libraries that instrument AI agent behavior become attack targets in their own right. Unlike traditional application security, where monitoring tools are assumed to be outside the threat model, AI agent observability infrastructure sits in the critical path between every agent action and the LLM provider — giving it access to API credentials, prompts, model outputs, and session traces simultaneously. When these tools are compromised, the attacker gains visibility and access equivalent to every agent the tool monitors. Mitigating this risk requires a governance architecture where the enforcement layer is structurally separate from the instrumentation layer it governs — not co-located in the same SDK or in-process library.

Why is an LLM observability SDK a high-value supply chain target?

An LLM observability SDK is not a passive logger. It is middleware.

To capture traces, token usage, latency, and tool call records, the SDK must intercept the LLM call before it goes out and after it comes back. That means it lives between your agent code and your LLM provider — with read access to every prompt, every completion, every function call argument, and every API key that authorizes the transaction.

A compromised logging library in a traditional web application exposes request payloads. A compromised observability SDK in an AI agent stack exposes credentials across every LLM provider you’ve connected, every tool call your agent made, every piece of user data your agent processed in its context window, and the full execution history of every session since installation.

This is what made LiteLLM specifically attractive to TeamPCP. LiteLLM functions as a unified AI gateway — a single SDK that proxies requests to OpenAI, Anthropic, Azure OpenAI, Google, Bedrock, and dozens of other providers behind a common interface. One compromised installation gives an attacker access to credentials for every AI provider the team uses, not just one.

The payload’s three-layer structure was deliberate. The first stage launched the stealer in a detached background process — no visible output, no Python startup delay. The second stage ran deep credential harvesting: SSH keys, cloud provider configs, LLM API keys, .env files, database passwords, CI/CD secrets, crypto wallets, all encrypted with AES-256 before exfiltration. The third stage established persistence by writing a scheduled service (typically sysmon.py) that checked in with attacker infrastructure every 50 minutes. An aggressive single-stage credential dump would have triggered rate-limit alerts. The staged approach established a persistent foothold before generating any detectable network activity.

Most teams have threat models that account for what their agents do. Far fewer have threat models that account for what their monitoring tools can see.

How did the LiteLLM attack chain work?

The attack didn’t start with LiteLLM. TeamPCP ran a cascading supply chain campaign across three targets over five days.

On March 19, they trojanized Aqua Security’s Trivy container security scanner. Trivy is widely used in CI/CD pipelines — including LiteLLM’s own build process. On March 23, TeamPCP hit Checkmarx’s KICS and AST GitHub Actions, which further expanded the footprint. By March 24, when their compromised Trivy build ran inside LiteLLM’s CI/CD pipeline, it extracted the PYPI_PUBLISH token from the GitHub Actions runner environment. From there, TeamPCP published versions 1.82.7 and 1.82.8 directly to PyPI under LiteLLM’s legitimate package identity.

The malicious .pth file dropped by the compromised packages executes automatically on every Python process startup when LiteLLM is installed in the environment. Not just when you explicitly import LiteLLM — on every Python invocation. Any team that ran pip install litellm without a pinned version during the three-hour window, or rebuilt a Docker image that included an unpinned install, received the payload.

The practical lesson isn’t just “pin your dependencies” — though you should. The lesson is that AI tooling supply chains are now active targets, and the tools with the broadest access to your agent stack are the highest-value ones to compromise. An attacker who wants your OpenAI API key doesn’t need to break into your application. They can compromise the observability SDK you trusted to watch your application for you.

What was actually exposed: why LLM gateway credentials are uniquely dangerous

When a traditional application credential is stolen, the attacker can impersonate the application. When an LLM gateway credential is stolen, the attacker can impersonate every agent the gateway serves — and do so invisibly, because the traffic looks identical to legitimate agent traffic.

An attacker with a stolen OpenAI organization key doesn’t just get API access. They get access at your rate limits, with your billing, generating outputs that your observability tools will log as legitimate if the observability layer itself is the source of the compromise. There is no external signal that anything went wrong.

In the LiteLLM attack, the credential scope went further still. LiteLLM is designed to centralize API key management — teams configure provider credentials once, and the SDK manages them for all downstream agents. That means a single PYPI_PUBLISH token extraction cascaded into potential access to every LLM provider credential stored in environments where the compromised package installed.

Combined with the ClawHavoc campaign — where researchers ultimately catalogued 1,184 malicious Skills injected into OpenClaw’s ClawHub marketplace between January and February 2026, representing roughly 12% of the registry at first discovery — the pattern emerging in early 2026 is consistent: the AI tooling ecosystem above the application layer is being actively targeted. Package registries, marketplace plugins, security scanner dependencies, CI/CD action integrations. Not the agents themselves. The infrastructure around the agents.

The architectural problem: when monitoring sits in the execution path

The core risk surfaced by the LiteLLM attack is architectural, not operational. Patching the compromised package addresses the immediate incident. The underlying structure remains.

Most AI agent observability architectures instrument at the SDK layer — a library that wraps LLM calls from inside the agent process or via an in-path proxy. This is pragmatic: it’s easy to add three lines of instrumentation, and it captures everything. But it also means the instrumentation library shares the trust domain of the code it instruments. A compromised observability SDK has the same credential access as a compromised agent. The monitoring tool and the thing being monitored are not separated by any trust boundary.

Contrast this with governance enforcement at the infrastructure layer — a control plane that sits outside the agent process, evaluates requests before they execute, and maintains its own credential store separate from the agent environment. A governance control plane can observe and enforce agent behavior without residing inside the same process, which means a supply chain attack against the agent SDK does not automatically compromise the governance layer.

This is the architectural gap the LiteLLM incident makes concrete. Observability tools that are co-located with the agent code they instrument cannot verify their own integrity. Governance enforcement that operates at a separate infrastructure layer can.

The parallel in traditional security architecture is the SIEM/EDR distinction: you don’t run your endpoint detection tooling in the same trust domain as the applications it monitors, because that defeats the independence the monitoring is supposed to provide. AI agent governance needs the same separation.

What does this mean for your AI governance posture?

The LiteLLM attack has three practical implications for teams running agents in production.

Your observability tools are in your threat model now. Any SDK, proxy, or library with access to your LLM credentials or agent traces is a supply chain attack surface. Pinning versions is necessary but not sufficient — the LiteLLM attack demonstrates that a legitimate version can be replaced at the registry level under the correct package name. Signed artifact verification and provenance checking for your AI tooling supply chain are the same discipline as for any other critical dependency.

Governance enforcement should not share a trust domain with instrumentation. If your governance policies (cost limits, content filtering, access controls) are enforced inside the same SDK or in-process library as your observability collection, then a supply chain attack against that library bypasses your governance simultaneously. Enforcement at an external infrastructure layer — one that doesn’t reside in the agent process — maintains governance even when the agent-side SDK is compromised.

Audit trails need to be tamper-evident, not just present. An attacker with access to your observability SDK can manipulate what gets logged. A governance architecture where enforcement events are recorded at the infrastructure layer and not modifiable by agent-side code produces records that are meaningful for compliance even in adversarial conditions. “We have logs” is a weaker claim than “our enforcement records are generated outside the agent process.”

This isn’t an argument against current observability tools. It’s an argument for treating observability and governance as architecturally distinct layers with different trust requirements — because conflating them creates exactly the exposure the LiteLLM incident made visible.

How Waxell handles this

How Waxell handles this: Waxell’s governance enforcement layer operates at the infrastructure level — outside the agent process, evaluated before each tool call and LLM request. Execution tracing captures the full session graph, but the enforcement control plane maintains its own credential context separate from agent-side SDKs. This separation means a supply chain attack against an agent’s observability library does not compromise Waxell’s enforcement records or policy execution. When the LiteLLM incident prompted teams to audit their AI tooling trust boundaries, Waxell’s architecture already placed governance policy enforcement outside the attack surface that SDK-layer observability tools share with the agent code they instrument. That’s not a feature we added in response to this incident — it’s what a governance-above-agents architecture looks like by design. To see your full agentic governance posture, get early access to Waxell.

Frequently Asked Questions

What happened in the LiteLLM supply chain attack?
On March 24, 2026, attackers from the group TeamPCP published malicious versions of the LiteLLM Python package (1.82.7 and 1.82.8) to PyPI after compromising LiteLLM’s CI/CD pipeline via a trojanized version of the Trivy security scanner. The malicious versions were live for approximately three hours and deployed a three-stage payload: credential harvesting from cloud environments, lateral movement through Kubernetes clusters, and a persistent backdoor for remote code execution. Engineers who installed or upgraded LiteLLM during that window, or rebuilt Docker images without a pinned version, received the compromised package.

Why are LLM observability SDKs high-value supply chain targets?
LLM observability SDKs sit in the execution path between your agent code and your LLM provider. To capture traces and telemetry, they must intercept calls before they go out and after they come back — which means they have read access to API credentials, prompts, model completions, tool call arguments, and full session histories. An LLM gateway SDK like LiteLLM that centralizes credentials for multiple providers is particularly high-value: compromising one package gives an attacker access to every provider credential configured in environments where it’s installed.

What is AI agent observability supply chain risk?
AI agent observability supply chain risk is the category of vulnerabilities that arise when the SDKs, proxy libraries, or telemetry tools used to monitor AI agent behavior are themselves compromised. Unlike traditional application monitoring tools, AI agent observability infrastructure has privileged access to LLM credentials, agent prompts, and session traces — making it a high-value target. The risk is distinct from prompt injection or model safety risks because it operates at the tooling layer, not the agent layer. It’s mitigated by separating governance enforcement from in-process instrumentation, maintaining signed artifact verification for AI dependencies, and ensuring enforcement records are generated outside the agent trust domain.

How should teams respond to the LiteLLM supply chain attack?
Immediately: verify your installed LiteLLM version and confirm you are not running 1.82.7 or 1.82.8. If you installed from PyPI during March 24 without a pinned version, rotate all LLM provider API keys that were configured in the affected environment, including OpenAI, Anthropic, Azure, and any other providers LiteLLM was proxying. Audit Kubernetes credentials for any signs of lateral movement. Longer-term: pin AI tooling dependencies to verified versions, implement artifact signing verification for your AI stack, and evaluate whether your governance enforcement layer shares a trust domain with the agent SDKs it’s meant to govern.

What is the difference between AI agent observability and AI agent governance when it comes to security?
Observability tools record what your agents did — they are instrumentation layers that capture traces, costs, and tool call records. Governance enforcement determines what your agents are allowed to do — it evaluates requests before they execute and enforces policies at the infrastructure layer. For security purposes, the critical difference is trust domain separation: observability SDKs that run inside the agent process share the attack surface of that process. Governance enforcement at an external infrastructure layer maintains its integrity even when the agent-side SDK is compromised. The LiteLLM supply chain attack is a direct demonstration of why these layers should not be co-located.

Sources

Claude’s Extended Thinking: The AI That Thinks Before It Speaks

🧠 The Power of “Slow” AI

Most AI tools give you instant answers. But fast isn’t always good. Claude has a special mode called “Extended Thinking” where it slows down and works through complex problems step-by-step—like a thoughtful expert rather than a quick guesser.

💡 What Is Extended Thinking?

Extended Thinking is a setting where instead of answering immediately, Claude uses a “reasoning block” to plan its response.

It’s the difference between:

  • Standard AI: Blurting out an answer based on patterns.
  • Extended Thinking: Pausing, reading the nuance, checking for errors, and then responding.

How to activate it: Switch the model setting to “Extended” or toggle the “Thinking” button (available in Claude 3.7 Sonnet and above) before sending your message.

⏰ When Should You Use It?

You don’t need this to write a “Thank You” email. Save the extra “brain power” for:

  • 📄 Deep Analysis: Summarizing 100+ page legal or technical docs.
  • 🎯 High Accuracy: Generating timestamps for long-form video (4+ hours).
  • 📊 Logic & Math: Analyzing business data or complex coding bugs.
  • 🤔 Strategic Planning: Creating multi-step project roadmaps.

🎬 Real-World Example: The YouTube Timestamp Challenge

Imagine you’ve recorded a 5-hour video. Doing manual timestamps would take you all afternoon.

With Extended Thinking, Claude can:

  1. Scan the entire transcript for context.
  2. Identify natural chapter breaks (not just random intervals).
  3. Cross-reference mentions of specific keywords.
  4. Format a perfect list: 0:00 - Intro, 15:30 - The Secret Sauce, etc.

The result? About 90% of the work is done in minutes, leaving you to just do a final review.

🧪 What Does It Look Like?

When this mode is active, you’ll see a “Thinking” dropdown. If you click it, you can see Claude’s internal monologue in real-time:

“I need to verify if the user wants the timestamps in 10-minute increments…” > “Scanning the section on ‘Market Trends’…” > “Ensuring the tone matches the previous chapters…”

This transparency builds trust—you can see exactly why it’s giving you that specific answer.

🛠 Quick Toggle Guide

Task Mode Recommended
Quick Email / Text fix Standard (Fast)
Brainstorming Ideas Standard (Creative)
Complex Coding / Debugging Extended (Precise)
Data Extraction from PDFs Extended (Thorough)

✅ Key Takeaway

Extended Thinking is Claude’s “Reasoning Mode.” Use it when accuracy matters more than speed. It’s better to wait 30 seconds for a perfect answer than to spend 10 minutes fixing a fast, wrong one.

This is **Blog 3* of a 9-part Claude AI series for beginners.*

Next up: Claude Projects — Your personal AI workspace that remembers everything.

Self-Hosted AI for Developers: Best Coding LLMs in 2026

The way developers use AI for coding has changed a lot over the past year. Not long ago, running a local language model meant accepting weaker results compared to cloud tools like GPT-4 or Claude. That trade-off is no longer as obvious.

In 2026, several open models are performing surprisingly close to proprietary systems. In some coding-specific tasks, they even take the lead. This shift is making local AI setups far more practical for real-world development.

If you care about keeping your code private, reducing API expenses, or running everything on your own infrastructure, self-hosted models are now worth serious consideration.

Why Developers Are Moving Toward Local LLMs

There are a few clear reasons behind this shift:

  • Sensitive code stays on your machine
  • No dependency on external APIs
  • Predictable costs instead of usage-based billing
  • Full control over customization and workflows

For individual developers, this means more independence. For companies, it solves compliance and privacy concerns that often block AI adoption.

How Close Are Open Models to Proprietary Ones?

Benchmarks like LiveBench give a useful snapshot of performance across coding and reasoning tasks.

Here is the reality in simple terms:

  • Proprietary models still lead in complex agent-style coding
  • The difference is smaller in standard coding tasks
  • Many open models now sit in the same performance range

For example, some open models score in the high 70s on coding benchmarks, while top proprietary models are in the low 80s. That gap is no longer dramatic.

Top Open Source LLMs for Coding (2026)

Let’s walk through the most relevant models you can actually self-host today.

1. GLM-5 — Strongest in Agent-Based Coding

GLM-5 is currently one of the most capable open models for complex coding workflows.

It uses a Mixture of Experts design with a very large parameter count, but only a fraction of it is active during execution. This makes it more efficient than it sounds.

What stands out:

  • Performs very well in multi-step coding tasks
  • Handles large codebases with a long context window
  • Uses MIT licensing, so it is friendly for commercial use

It is particularly useful when you need reasoning across multiple files or systems.

2. Kimi K2.5 — Best Raw Coding Performance

Kimi K2.5 pushes coding performance even further.

Its most interesting feature is something called an agent swarm. Instead of solving a task step by step, it can coordinate multiple internal agents to work in parallel.

Key strengths:

  • Extremely high accuracy in code generation
  • Supports multimodal inputs like text and visuals
  • Designed for complex workflows, not just single prompts

This model is powerful but requires serious hardware to run properly.

3. DeepSeek V3.2 — Balanced and Cost-Efficient

DeepSeek V3.2 offers a strong balance between performance and efficiency.

It builds on earlier code-focused models and brings that expertise into a more general system.

Why developers like it:

  • Reliable coding performance across many languages
  • Open licensing with commercial flexibility
  • Smaller variants available for local machines

If you want something practical without extreme hardware requirements, this is a solid option.

4. Devstral 2 — Built for Software Engineering Workflows

Devstral 2 focuses specifically on real software development tasks rather than just code generation.

It is designed to help with:

  • Debugging
  • Refactoring
  • Multi-step development tasks

There is also a smaller version that runs on a single GPU, making it more accessible.

That smaller variant is especially useful for developers working on personal setups.

5. Qwen3-Coder — Agentic Coding with CLI Integration

Qwen3-Coder is part of a broader ecosystem designed around coding workflows.

It comes with tooling that integrates directly into the terminal, giving a more hands-on development experience.

Highlights:

  • Strong support for automated coding agents
  • Multiple model sizes for different hardware setups
  • Works well with command-line workflows

This model is a good fit if you prefer working inside your terminal rather than a GUI.

6. Llama 4 — Massive Context for Large Projects

Llama 4 is not purely a coding model, but it is still very useful.

Its biggest advantage is context length. It can process extremely large inputs, which helps when dealing with full repositories.

Best use cases:

  • Reviewing large codebases
  • Documentation generation
  • Cross-file reasoning

The only downside is licensing restrictions compared to MIT or Apache licenses.

7. StarCoder 2 — Transparent and Lightweight

StarCoder 2 is a smaller but very practical model.

Its main advantage is transparency. The training data is well documented, which matters for compliance-heavy environments.

Why it still matters:

  • Runs on modest hardware
  • Good for smaller tasks and prototyping
  • Clear data lineage

It may not match larger models in raw performance, but it is reliable and easy to deploy.

Tools to Run These Models Locally

Choosing a model is only part of the setup. You also need tools to run them.

Here are the most common options:

  • Ollama
    The easiest way to get started with local models

  • vLLM
    Better suited for production environments

  • LM Studio
    Useful if you prefer a graphical interface

For beginners, Ollama is usually the simplest entry point.

Quick Recommendations Based on Your Setup

Here is a practical way to choose:

  • If you want top performance
    Go with GLM-5 or Kimi K2.5

  • If you are using a single GPU
    Try Devstral Small or Qwen 2.5 Coder

  • If you are on a laptop
    Use StarCoder 2 or smaller DeepSeek models

  • If you want automation and agents
    Choose Qwen3-Coder or Kimi K2.5

Conclusion

Open source coding models have reached a point where they are no longer just experimental tools. They are becoming reliable enough for daily development work.

The difference between local and proprietary models still exists, but it is shrinking with every new release. For many developers, that gap is already small enough to ignore.

If you are just starting out, begin with a lightweight setup using Ollama and a mid-sized model. From there, you can scale up based on your needs and hardware.

The important shift is this: you no longer have to choose between performance and control. In 2026, you can have both.

Reference

Best Self-Hosted Open Source LLMs for Coding in 2026