Decoding the 404: A Developer’s Guide to Troubleshooting and Fixing “Not Found” Errors

The 404 Not Found error is the “Ghost in the Machine” of the web. We’ve all seen it, and as developers, we’ve all accidentally caused it. While it’s the most recognizable HTTP status code, handling it correctly is the difference between a professional, SEO-optimized application and a leaky bucket that loses users.

In this guide, we’re diving deep into the mechanics of the 404 error, how to troubleshoot it, and how to implement robust fixes for modern web stacks.

What is a 404 Error (Technically)?

From an HTTP/1.1 perspective, a 404 Not Found is a client-side error. It indicates that the client (the browser or crawler) could successfully communicate with the server, but the server could not map the requested URI to a specific resource.

Unlike a 500 error (Server Error) or a 403 (Forbidden), a 404 implies that the resource might be missing temporarily or has been moved permanently without a pointer.

Common Root Causes in Development

Before you start debugging, identify where the disconnect is happening:

  1. Routing Logic Mismatches: In Single Page Applications (SPAs) like React or Vue, 404s often occur when the server isn’t configured to redirect all requests to index.html.
  2. Case Sensitivity: On Linux-based servers (most production environments), /Assets/Logo.png and /assets/logo.png are different files. Locally on Windows or macOS, they might work fine—leading to “it works on my machine” syndrome.
  3. Permissions/Ownership: If the server process doesn’t have read permissions for a file, it may return a 404 to avoid leaking information about the file’s existence (or a 403).
  4. Permalinks & .htaccess: In WordPress or PHP environments, a corrupted .htaccess file often breaks the rewrite rules.

How to Fix 404 Errors: The Developer’s Toolkit

1. Server-Side Redirects (The Right Way)

If you’ve moved content, don’t let the old URL die. Use a 301 Permanent Redirect. This preserves “link juice” and SEO authority.

Apache (.htaccess):

Redirect 301 /old-feature-slug /new-feature-slug

Nginx (nginx.conf):

location /old-path {
    return 301 /new-path;
}

2. Handling 404s in Modern Frameworks

Express.js (Node.js):
Always place your 404 handler at the very bottom of your middleware stack, after all defined routes.

// Your routes here...
app.get('/api/data', (req, res) => { ... });

// The Catch-all 404
app.use((req, res, next) => {
  res.status(404).json({
    error: "Resource not found",
    message: "If you think this is a bug, please contact [email protected]"
  });
});

React Router (v6):

<Routes>
  <Route path="/" element={<Home />} />
  <Route path="/about" element={<About />} />
  {/* The 404 "No Match" Route */}
  <Route path="*" element={<NotFoundPage />} />
</Routes>

3. Automation and Monitoring

Don’t wait for users to report broken links.

  • Google Search Console: Check the “Coverage” report regularly.
  • Screaming Frog: Run a crawl on your staging environment before every major deployment.
  • Custom Logging: Log 404 occurrences in your backend (e.g., using Winston or Morgan) to identify patterns of mistyped URLs.

The Anatomy of a High-Conversion 404 Page

A 404 doesn’t have to be a dead end. From a UX perspective, a great 404 page should:

  • Maintain Branding: Don’t use the default browser white-and-gray page.
  • Provide a Way Out: Include a search bar and a “Home” button.
  • Inject Personality: A bit of humor goes a long way in reducing user frustration.
  • Internal Links: Link to your most popular documentation or products.

Impact on SEO

Search engines don’t penalize you for having some 404s—it’s a natural part of the web’s evolution. However, a high volume of 404s from internal links signals a “low-quality” site to crawlers.

Pro-tip: If a high-authority external site links to a page on your site that no longer exists, you are losing valuable SEO equity. Always redirect those specific URLs to the next most relevant page.

Conclusion

Mastering error handling is a core skill for any full-stack developer. By moving from “passive” 404 handling to “active” routing management, you ensure a smoother experience for both users and search bots.

For more deep dives into web performance, backend optimization, and developer tools, visit us at NeedleCode. We help developers bridge the gap between “code that works” and “code that scales.”

Originally published at needlecode.com

Building a ChemDraw clone with DDD (Part III): Interacting with Atoms and Bonds

Diagram

For a chemical draw to be truly functional, drawing isn’t enough; the user must be able to interact with every element on the screen. Selecting an atom is intuitive, but how do you select a chemical bond (a line segment) with pixel-perfect precision? In this post, I’ll break down the mathematical process and the challenges of implementing this collision engine.

Selecting Atoms: The Easy Path

Detecting if the cursor is over an atom is the ideal scenario. Since our domain already stores the (x, y) coordinates of each node, the solution is applying Euclidean distance.

We calculate the separation between the mouse (P) and each atom (A) with the formula:

d=(x2−x1)2+(y2−y1)2d = sqrt{(x_2 – x_1)^2 + (y_2 – y_1)^2} d=(x2​−x1​)2+(y2​−y1​)2​

.

If the distance is shorter than a defined search radius, the atom is considered a candidate. To ensure precision, if multiple atoms are within range, we always select the one with the minimum distance.

class Molecule {
  // ...
  private findClosestAtom(
    x: number,
    y: number,
    radius: number,
  ): { atom: Atom; distance: number } | null {
    const candidates = [...this._atoms.values()]
      .map((atom) => ({
        atom,
        distance: Math.sqrt(Math.pow(atom.x - x, 2) + Math.pow(atom.y - y, 2)),
      }))
      .filter(({ distance }) => distance <= radius)
      .sort((a, b) => a.distance - b.distance);

    return candidates[0] || null;
  }
  // ...

Selecting Bonds: The “Infinite Line” Problem

With bonds, things get complicated. A bond is a line segment, not a single point. My first instinct was to use the classic equation for the distance from a point to a line:

d=∣Ax+By+C∣A2+B2d = frac{|Ax + By + C|}{sqrt{A^2 + B^2}} d=A2+B2​∣Ax+By+C∣​

The problem: This formula assumes the line is infinite. If you click miles away but happen to be perfectly aligned with the bond’s trajectory, the formula will trigger a “hit”. In a molecule with hundreds of bonds, this creates “ghost collisions” across the entire canvas.

The Solution: Projection and Clamping

To solve this, we need to find the closest point specifically within the segment bounded by atoms A and B. Here’s where the vector math comes in.

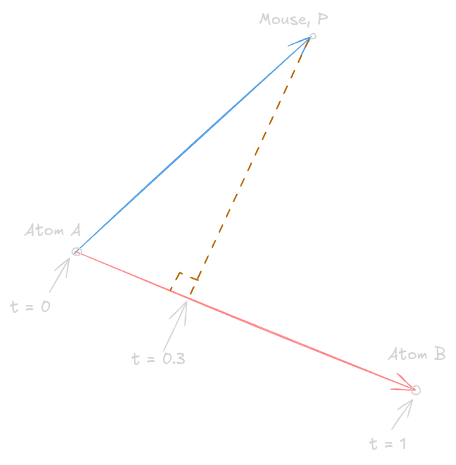
The algorithm projects the mouse coordinates onto the line and calculates the “projection factor” t.

  • If t = 0, the closest point is atom A.
  • If t = 1, the closest point is atom B.
  • If t is between 0 and 1, the closest point lies somewhere along the bond.

Diagram

Key here is clamping: forcing t to stay between 0 and 1 using Math.max(0, Math.min(1, t)). This effectively “encloses” the collision logic within the physical boundaries of the bond.

private pointToSegmentDistance(
  px: number, py: number, // Mouse point
  ax: number, ay: number, // Atom A (Start)
  bx: number, by: number  // Atom B (End)
): number {
  const abx = bx - ax;
  const aby = by - ay;
  const apx = px - ax;
  const apy = py - ay;

  const abLengthSq = abx * abx + aby * aby;

  // If atoms overlap, return distance to point A
  if (abLengthSq === 0) return Math.sqrt(apx * apx + apy * apy);

  // Scalar projection restricted to the [0, 1] range (Clamping)
  const t = Math.max(0, Math.min(1, (apx * abx + apy * aby) / abLengthSq));

  // Find the coordinates of the closest point on the segment
  const closestX = ax + t * abx;
  const closestY = ay + t * aby;

  // Final distance between mouse and the closest point on the segment
  return Math.sqrt(Math.pow(px - closestX, 2) + Math.pow(py - closestY, 2));
}

Atoms vs Bonds

A common UX challenge in chemical editors is overlap. What happens if the mouse is near a bond but also directly over an atom?

In chemistry, the atom is the primary unit of interaction. Therefore, I implemented a simple but effective business rule: Atoms always have priority. If the engine detects a collision with both an atom and a bond, the atom “hijacks” the selection event. This prevents users from accidentally deleting a bond when they intended to edit an element.

Conclusion: The “God Object” Warning

While this collision engine works perfectly, it has exposed a growing architectural debt. My Molecule class—which should only care about chemical valences and atoms—is now bloated with 2D geometry formulas and pixel coordinates.

I’ve created a God Object.

In the next post, I’ll perform “major surgery” on this architecture. We will split the system into two Bounded Contexts: a Chemistry context for the logic and a Spatial context for the geometry.

How Signal-Based Routing Actually Works (and the 3 Times It Broke)

You Shouldn’t Have to Tell the AI Who to Be

Last week I wrote about typing “act as a senior architect” 47 times per week. The friction of manually assigning roles to an AI that should be able to figure it out.

This week I want to go deeper. Not the pitch — the plumbing. How does signal-based routing actually work inside PRISM Forge? What does the routing engine look at? How does it decide?

And — because build-in-public means showing the dents — the 3 times it broke in ways I didn’t expect.

The Core Idea: Intent Detection, Not Commands

Most persona systems work like menus. Pick a role from a list. Type a command. Toggle a mode.

Signal-based routing works differently. You talk naturally. The system listens for signals in your language and assembles the right team.

“I’m stuck on this auth bug” contains two signals: stuck (creative problem-solving) and bug (debugging/validation). The routing engine reads both, decides who leads, and who supports.

No slash commands. No mode toggles. No “act as.”

Anatomy of the Routing Engine

PRISM Forge’s routing engine has four layers that fire on every single message:

Layer 1: Hard Overrides

Three things bypass all logic:

  • “War room” — loads all 27 personas into active debate. Susie moderates.
  • Explicit name — “Winston, how should this be architected?” Always routes to the named persona.
  • Mode switch — system context changes (Plan mode, Agent mode) activate mode defaults.

These are cheap checks. If none fire, the engine moves to intent classification.

Layer 2: Intent Classification

Every message maps to one of 9 intent categories:

Intent What it means Who typically leads
Build Write code, create files Amelia (Developer)
Investigate Analyze, explore existing state Mary (Analyst)
Plan Structure work, break down tasks Bob (Scrum Master) + John (PM)
Validate Test, verify, review Quinn (QA Engineer)
Create Brainstorm, ideate, design Carson (Brainstorm Coach)
Challenge Question approach, simplify Victor (Strategist) or Jobs (Genius)
Orient Catch up, understand context Susie (Chief of Staff)
Document Write up, explain, describe Paige (Technical Writer)
Narrate Tell story, frame metrics Sophia (Storyteller)

Here’s the critical design decision: a single message can span multiple intents. “Plan how to refactor the auth module — I think it’s too complex” spans Plan + Build + Challenge. The engine evaluates holistically, not sequentially. It doesn’t stop at the first match.

Layer 3: Signal Detection

This is where it gets interesting. The engine maintains two signal tables:

Shared signals co-activate multiple personas. When someone says “audit,” three personas are relevant: Mary (investigation), Quinn (validation), and Boris (structural conformance). The engine decides who leads based on the full message context.

Specialist signals are exclusive triggers. “First principles” activates Musk (Radical Reductionist). “Hero’s journey” activates Campbell (Mythic Storyteller). These are unambiguous.

There are 24 shared signals and 23 specialist signal groups across all 28 personas. Every persona has a documented activation path. Nothing is magic — it’s a lookup table with contextual judgment on top.

Layer 4: Team Assembly

The engine doesn’t just pick one persona. It assembles a team:

  • Primary — one persona leads the response. Sets the structure, answers the core question.
  • Supporting — additional personas contribute distinct perspectives. Each one must earn their seat by adding something genuinely different.

Example: you say “the auth module is too complex, let’s simplify and rebuild it.”

  • Jobs (Combinatorial Genius) leads — “simplify” and “too complex” are his signals
  • Amelia (Developer) supports — “rebuild” means implementation is coming
  • Winston (Architect) supports — architectural implications of simplification

Three perspectives in one response. Each attributed. Each distinct. No blended consensus voice.

The Orchestrator: Susie

All four layers are orchestrated by Susie, the Chief of Staff. She’s not a persona you talk to — she’s the intelligence running behind every turn.

On Turn 1 of every session, Susie activates unconditionally. She scans your project state (git, todos, handoffs, memory) and delivers a sitrep:

  • Active: what you’re working on
  • Blocked: what’s stuck
  • Stale: what hasn’t moved
  • Recommended: who should lead this session

After Turn 1, Susie evaluates every message, re-assembles the team if needed, and only announces when the roster changes. If you send 5 messages about planning, the team stays stable. No noise.

The key insight: Susie evaluates holistically. All signals, all domain matches, all cross-workflow hooks are inputs to one team assembly decision. She doesn’t process them sequentially and stop at the first match. She considers everything and picks the best team.

The 3 Times It Broke

Here’s where build-in-public gets honest.

Break 1: Signal Collision

Early in development, I typed: “Let’s brainstorm how to simplify the architecture.”

Three strong signals fired simultaneously:

  • “brainstorm” → Carson (Brainstorming Coach)
  • “simplify” → Jobs (Combinatorial Genius)
  • “architecture” → Winston (Architect)

All three had legitimate claims to lead. The result? A response that tried to be all three at once. Brainstorming structure with simplification opinions wrapped in architectural framing. It was a mess. No clear voice. No clear direction.

The fix: Explicit primary selection with a tiebreaker. The engine now picks ONE primary based on which signal is strongest in context. In this case, “brainstorm” as the verb (the action the user wants) beats “simplify” (the lens) and “architecture” (the domain). Carson leads. Jobs and Winston support. Clear hierarchy, clear voices.

Break 2: The Consensus Trap

I built a “war room” feature where all personas discuss a decision. Early version: everyone agreed with each other.

Jobs would say “simplify.” Victor would say “I agree with Jobs.” Winston would say “Jobs is right, and architecturally this supports his point.” Twenty-seven personas producing one opinion. Useless.

The problem was subtle. The AI’s default behavior is to be agreeable. When you load multiple personas into one context, they naturally converge because the underlying model wants to be helpful and non-contradictory.

The fix: Susie became an active moderator with an explicit mandate: surface disagreement. Her orchestration rules now include: “A war room where everyone agrees is a failed war room.” She actively draws out dissent: “Jobs, would you cut this? Victor, is this the right approach at all? Dali, what assumption are we not questioning?”

The result: war rooms now produce genuine tension. Jobs wants to cut scope. Carson says cutting is premature — we haven’t explored alternatives. Winston sides with Jobs on scope but wants Carson’s option analysis first. Real tradeoffs. Real decisions.

Break 3: Over-Routing

For a while, the engine was too eager. A simple question like “what does this function do?” would activate Mary (investigation), Winston (architecture), Quinn (validation), and Paige (documentation) — four personas to answer what should have been a one-voice response.

The engine was technically correct. The question touches investigation, architecture, validation, and documentation domains. But four voices for a simple question is noise, not depth.

The fix: Team size guidance. Every persona on the team must earn their seat. A team of 2 with genuine perspectives beats a team of 8 with filler. The engine now considers message complexity. Simple questions get one voice. Complex, multi-faceted problems get the full team. The threshold isn’t a rule — it’s judgment, guided by the principle that extra voices must add something the primary couldn’t provide alone.

What I’d Build Differently

If I started over today, three things would change:

1. Signal weights, not signal matches. The current system treats all signal matches equally and relies on contextual judgment for tiebreaking. A weighted system where “the verb matters more than the noun” would have prevented Break 1 from the start.

2. Disagreement scaffolding from day one. I bolted on active moderation after the consensus trap. It should have been foundational. Any multi-agent system that doesn’t explicitly design for disagreement will produce consensus by default. The AI wants to agree. You have to engineer the tension.

3. Graduated complexity. Simple questions should feel simple. Complex questions should feel like a team. The transition between these modes took longer to get right than the routing engine itself.

Try It Yourself

PRISM Forge is MIT licensed and free:

npx prism-forge install

28 personas. Signal-based routing. No commands to memorize.

GitHub: prism-forge/prism-forge

This is part of a 12-post series on building PRISM Forge. Last week: the problem with manual persona prompting. Next week: meet John, the product manager who asks “why are we doing this?” before anyone writes a line of code — and what happens when he clashes with Bob over planning vs simplification.

Follow along: @DrakkoTarkin on X | @drakkotarkin.bsky.social on Bluesky

Readable Code: Because Your Future Self Hates You

diagram

I used to think “clever code” made me a better developer.

You know the type: 5 layers of abstraction, every design pattern imaginable, optimizations sprinkled everywhere.

It looked impressive. Until a new teammate joined and spent half a day just figuring out how to make a tiny change.

That’s when it hit me:

Readability is the real standard of good code.

The Real Test of a Codebase

Forget patterns, frameworks, or architecture debates for a second. Here’s my rule:

If anyone on your team, new or experienced, can read, understand, and adapt your code within a day, your code is solid.

Everything else, optimization, abstraction, architectural elegance, still matters. But it should support readability, not replace it. Think of readability as the foundation and the fancy stuff sits on top.

This Isn’t About New Developers

A lot of people hear “readable code” and assume it’s a criticism of junior devs. It’s not.

Even the most skilled developer can waste hours untangling overly abstracted or over-engineered code. Readable code is about writing code that communicates intent clearly, so everyone can move fast and safely.

Think of it as writing a story. The plot, your logic, should be clear. The style, patterns and architecture, can be fancy, but no one should need a decoder ring to figure out what’s happening.

Why Readability Works

Readable code makes:

  • Onboarding fast
  • Collaboration smoother
  • Bug tracking easier

It also doesn’t mean sacrificing good engineering:

  • Optimizations are still important, but they shouldn’t make the code unreadable.
  • Abstraction is fine, but if nobody understands why it exists, it’s too abstract.
  • Architecture should guide, not confuse.

Readable first, clever second. Layer sophistication where it genuinely adds value.

Quick Wins for Readable Code

  • Names matter. calculateTotal() beats calcT() any day.
  • Organize files logically. Don’t make someone guess where a component lives.
  • Keep it simple. Don’t over-engineer just to show off.
  • Comments = context, not code. Explain why, not what.
  • Readable commits. Your history should tell the story of the project, not confuse it.

My Personal Rule

Whenever I onboard someone new, I give them a small task.

If they can complete it without me explaining every step, the code passes my readability test.

If not, it’s a signal it’s time to rethink clarity.

Readable code doesn’t mean dumb code.

It means code that anyone can understand, adapt, and maintain, while still being optimized, abstracted, and architecturally elegant.

Software isn’t about showing off cleverness. It’s about solving problems together.

Building an AI Assistant That Doesn’t Take Action Automatically

Most AI apps today try to do things for you automatically.
But when it comes to personal data — like money or health — that can feel risky.
So I explored a different pattern:

What if AI suggests actions, but never executes without approval?

🧠 The Idea: Approval-Gated AI

Instead of this:

User → AI → Action happens

I built around this:

User → AI → Draft → User approves → Action happens

💬 Example

You type:

“Add coffee for 40”

The AI:

  • Parses the intent
  • Prepares the expense entry
  • Shows it to you

You:

  • ✅ Approve → saved
  • ❌ Reject → nothing happens

⚖️ Why This Matters

In domains like:

  • Finance
  • Health / nutrition
  • Personal logs

Users care about control and accuracy.

Problems with full automation

  • Silent mistakes
  • Wrong assumptions
  • Loss of trust

Problems with manual apps

  • Too slow
  • Too much friction

🔄 This Pattern Sits in Between

Approval-gated AI is:

  • Faster than forms
  • Safer than automation

🧪 Where I Applied It

I’ve been prototyping this idea in a small app where AI helps with:

  • Expense and income tracking
  • Budget alerts
  • Nutrition logging (calories and macros from descriptions)
  • Receipt parsing

Everything goes through user approval first.

🤔 Trade-offs I Observed

✅ Pros

  • Builds trust quickly
  • Prevents unexpected changes
  • Makes AI behavior transparent

❌ Cons

  • Adds an extra step
  • Can feel repetitive for simple actions

🧩 Open UX Questions

This is where I’d love input:

  • Should small actions auto-approve?
  • Should users be able to set confidence thresholds?
  • When does confirmation become annoying instead of helpful?

🚀 Implementation Stack

  • React 19
  • Hono
  • Cloudflare Workers + D1 (SQLite)
  • Drizzle ORM
  • Tailwind
  • Radix UI

🔗 Demo & Project

💬 Final Thought

AI doesn’t always need to be autonomous.
Sometimes the best UX is:

AI that assists decisively — but lets humans stay in control.

Curious how others are thinking about this pattern.

Why Most AI Cold Emails Go to Spam (And How to Fix It)

Most AI cold email tools generate the same patterns. The same subject line structures, the same casual tone, the same call-to-action placement. And guess what? Spam filters see it coming from a mile away.

I built 99 Agents (a tool that scores cold email sequences for deliverability), and I’ve seen this play out thousands of times: technically well-written emails landing in spam folders because they feel like they came from an AI.

Here’s what actually works.

1. Structural Randomization: Break the Pattern

AI emails follow predictable rhythms. They have consistent sentence lengths, predictable paragraphs, and templated flows. Spam filters use pattern matching—if your email structure matches what they’ve seen 10,000 times before, you’re flagged.

What to do: Vary sentence length deliberately. Write one word sentences. Then longer ones. Mix short paragraphs with walls of text. The goal isn’t readability—it’s authenticity. Real humans write messy. Embrace the mess.

2. Avoid AI-Pattern Triggers

Certain phrases are red flags. “Hope this email finds you well.” (instant spam score bump). “I’ve been following your work.” (unless you’re specific, it reads generic). Exclamation marks in clusters. Perfect grammar. No typos, ever.

What to do: Include a real observation about their work. Name a specific article, feature, or milestone. Make one small grammatical choice that feels intentional but imperfect—a dash where a comma should be, or starting a sentence with “And” or “But.” Real founders do this. Filters expect it.

3. Subject Line Randomization

The most engineered subject lines fail. “[Name], quick question” or “Following up: [Company]” are template classics that filters have seen millions of times.

What to do: Write subject lines that feel weird in the moment but authentic. Ask a genuine question that might have multiple answers. Reference something specific from their Twitter/work that made you curious. Vary the format—don’t always lead with their name.

4. Timing and Volume

Blasting 500 emails at once is a spam death sentence. Even if each individual email is solid, the volume pattern is a giveaway.

What to do: Stagger sends across days or weeks. Vary send times. Don’t send to an entire list on Tuesday morning—that’s a bot pattern. Mix in real replies to people who respond, breaking the automation signal.

5. Breaking Brevity Myths

The advice “keep it under 150 words” is wrong. A perfectly short email can be more suspicious than a longer one because it’s so clearly templated.

What to do: Write naturally. Sometimes that’s short. Sometimes it’s longer with a real story. The best cold emails I’ve seen are 200-400 words with a specific ask buried in the middle—not at the bottom, not in a P.S.

How I Score This Stuff

When I built the Sequence Health Score for 99 Agents, we looked at thousands of emails that actually got replies vs. ones that hit spam. The pattern was clear: the ones that worked didn’t look like they came from a “cold email tool.”

They had personality. They broke their own rules. They felt like one founder emailing another, not a sequence.

The score looks at:

  • Structural variation (sentence length, paragraph rhythm)
  • Pattern triggers (how many template phrases you’re using)
  • Personalization depth (not just {first_name}, but real context)
  • Send behavior (volume, timing, list freshness)

Most AI tools max out at 2-3 of these. The ones that work nail all of them.

The Real Secret

Spam filters aren’t stupid. They’re trained on millions of real vs. spam emails. They can spot AI-generated text because AI text is too consistent. It’s too polished. It makes too much sense.

The best cold emails make less sense on the surface—because they’re written by a real person who’s thinking about the recipient, not optimizing for a template.

If you’re sending cold emails and they’re landing in spam, it’s not because you’re too pushy or too casual. It’s probably because the structure screams “automated.”

Randomize it. Make it weird. Make it real. That’s what works.

Check out 99 Agents if you want to score your next sequence: https://nine9agents.polsia.app?utm_source=devto&utm_medium=article&utm_campaign=launch

We’ll tell you exactly where your email is vulnerable and what to fix. No magic bullet—just honest feedback on why it might be hitting spam, and what real founders are doing instead.

Automating Cross-Posting with Attributed Unsplash Cover Images

Cover image: multi-monitor programming workspace

Image by Jakub Żerdzicki on Unsplash.

At most teams, image handling is where “automated posting” quietly becomes manual again.

The text pipeline works. The publishing APIs work. But images end up as an afterthought: no attribution, inconsistent style, weak relevance, or missing cover fields on one platform. This post documents the production workflow we now use to fix that.

The Goal

Publish the same article to Hashnode and Dev.to with:

  • one aligned hero image
  • explicit image attribution close to the image
  • platform-native cover mapping
  • deterministic quality checks before publish

The Image Pipeline We Implemented

  1. Generate article draft and title.
  2. Query Unsplash using article-aware keywords.
  3. Select a landscape image with strong topical fit.
  4. Capture attribution metadata:
    • photographer name
    • photographer profile URL
    • photo page URL
  5. Register Unsplash download tracking for compliance.
  6. Map the same chosen image URL to both platforms:
    • Hashnode coverImageURL
    • Dev.to main_image
  7. Insert attribution line directly beneath the first in-body image.

Why This Works Better

This workflow removes ambiguity. Instead of “find an image later,” every publish run has required image fields and a go/no-go quality gate.

That gives us:

  • visual consistency across platforms
  • proper author attribution on every article
  • better click-through appeal
  • fewer manual fixes after publish

Practical Rules We Enforce

  • No image, no publish (unless explicit override).
  • Attribution is mandatory and near the image.
  • One canonical hero image per article for cross-platform consistency.
  • Image must be public and renderable before API publish.

Final Note

Automation is only “production-ready” when content quality, attribution, and compliance are embedded into the workflow, not bolted on afterward.

This post itself was published through that exact pipeline.

Connect With Me

Krishna Soni — Game Developer, Researcher, Author of The Power of Gaming

LinkedIn: Krishna Soni | Kri Zek

Web: krizek.tech | Altered Brilliance on Google Play

Socials: Happenstance | Instagram @krizekster | Instagram @krizek.tech | Instagram @krizekindia

CDKTF Has Free Terraform in TypeScript — Here’s How to Ditch HCL Forever

Love Terraform but hate HCL? CDKTF lets you write Terraform configs in TypeScript, Python, Java, C#, or Go.

What is CDKTF?

CDK for Terraform (CDKTF) is an open-source project by HashiCorp that lets you define Terraform infrastructure using programming languages instead of HCL.

Quick Start

npm install -g cdktf-cli
cdktf init --template=typescript --providers=aws

Your First CDKTF Stack

import { Construct } from "constructs";
import { App, TerraformStack, TerraformOutput } from "cdktf";
import { AwsProvider } from "@cdktf/provider-aws/lib/provider";
import { S3Bucket } from "@cdktf/provider-aws/lib/s3-bucket";
import { Instance } from "@cdktf/provider-aws/lib/instance";

class MyStack extends TerraformStack {
  constructor(scope: Construct, id: string) {
    super(scope, id);

    new AwsProvider(this, "aws", { region: "us-east-1" });

    // S3 Bucket
    const bucket = new S3Bucket(this, "app-bucket", {
      bucket: "my-app-assets-2026",
      tags: { Environment: "production" },
    });

    // EC2 Instance
    const server = new Instance(this, "web-server", {
      ami: "ami-0c02fb55956c7d316",
      instanceType: "t3.micro",
      tags: { Name: "WebServer" },
    });

    new TerraformOutput(this, "bucket-name", { value: bucket.bucket });
    new TerraformOutput(this, "server-ip", { value: server.publicIp });
  }
}

const app = new App();
new MyStack(app, "my-infra");
app.synth();
cdktf deploy

Loops and Conditions (Why CDKTF Wins)

// Create 3 identical servers with a loop
const serverNames = ["web-1", "web-2", "web-3"];
serverNames.forEach(name => {
  new Instance(this, name, {
    ami: "ami-0c02fb55956c7d316",
    instanceType: "t3.micro",
    tags: { Name: name },
  });
});

// Conditional resources
if (isProduction) {
  new Instance(this, "monitoring", {
    instanceType: "t3.large",
    // ...
  });
}

In HCL you would need count, for_each, and conditional expressions. In CDKTF — just use TypeScript.

Reusable Constructs

class WebApp extends Construct {
  public readonly url: string;

  constructor(scope: Construct, id: string, props: { domain: string; size: string }) {
    super(scope, id);

    const bucket = new S3Bucket(this, "assets", {
      bucket: `${props.domain}-assets`,
    });

    const server = new Instance(this, "server", {
      instanceType: props.size,
      ami: "ami-0c02fb55956c7d316",
    });

    this.url = server.publicDns;
  }
}

// Use it
const app1 = new WebApp(this, "app1", { domain: "example.com", size: "t3.micro" });
const app2 = new WebApp(this, "app2", { domain: "staging.example.com", size: "t3.small" });

CDKTF vs Pulumi vs HCL Terraform

Feature CDKTF Pulumi HCL Terraform
Languages TS, Python, Go, Java, C# TS, Python, Go, C# HCL
State Backend Terraform (S3, Cloud) Pulumi Cloud, S3 S3, Cloud
Provider Ecosystem All Terraform providers Most TF providers All native
Existing TF Code Import directly Convert needed Native
Testing Jest/Vitest Built-in Terratest

Key Advantage: Full Terraform Ecosystem

CDKTF generates standard Terraform JSON. This means every Terraform provider, every module, every backend — it all works. You get TypeScript DX with Terraform reliability.

Need managed infrastructure for data extraction? Check out my Apify actors — no infrastructure management needed. For custom solutions, email [email protected].

Ollama & LangChain.js: Build Local, Powerful AI Apps

I created a new website: Free Access to the 8 Volumes on Typescript & AI Masterclass, no registration required. Choose Volume and chapter on the menu on the left. 160 Chapters and hundreds of quizzes at the end of chapters.

Bridging Local Intelligence with Structured Workflows

The integration of Ollama with LangChain.js represents a significant shift in how we build intelligent applications. It moves us away from relying solely on cloud-based LLM APIs and towards a modular, locally-hosted ecosystem. This approach empowers developers to create more private, performant, and deterministic AI solutions. This post will dive into the core concepts, analogies, and practical code examples to help you understand and implement this powerful combination.

Understanding the Core Concepts: Raw vs. Structured Models

At its heart, the difference lies in how we interact with the Large Language Model (LLM). Direct API integration with Ollama, while functional, is akin to using low-level sockets – sending raw strings and receiving raw strings. This lacks structure, type safety, and the ability to chain operations seamlessly.

LangChain.js acts as the “Express.js” or “Next.js” framework for LLMs, providing the necessary abstraction layer. It wraps raw model calls in standardized interfaces (LLM, Embeddings, Runnable), enabling the creation of deterministic pipelines instead of imperative scripts.

Specifically, we’ll focus on two key components:

  • OllamaLLM (The Reasoner): Handles text generation, taking a prompt and returning a completion. Crucially, it’s a “Runnable” that can be composed into larger chains.
  • OllamaEmbeddings (The Vectorizer): Transforms text into numerical vectors (embeddings) capturing semantic meaning, allowing for similarity comparisons.

The Web Development Analogy: A Full-Stack Application

Think of a LangChain.js application like a modern full-stack web app:

  • Database vs. Embedding Model (OllamaEmbeddings): A database stores data, but raw data is often unstructured. We index it with search engines like Elasticsearch or vector databases like Pinecone for efficient searching. OllamaEmbeddings is the “build process” that generates these indexes (vectors) from your text, ensuring your data stays local.
  • API Route vs. LLM (OllamaLLM): An API route receives requests, processes logic, and returns responses. OllamaLLM is the serverless function or API endpoint, accepting a prompt and generating a response, but within a structured, orchestratable framework.
  • Orchestrator vs. Chain: Tools like Redux or server-side middleware manage data flow in complex web apps. A LangChain Chain is the middleware pipeline, connecting retrieval to generation: Retrieve -> Format Prompt -> Generate -> Parse Output.

Why Integrate Ollama with LangChain.js?

Instead of raw API calls, why wrap Ollama in LangChain.js? The benefits are significant:

  • Latency: Cloud LLMs involve network requests. With OllamaLLM locally, inference happens on the same machine, drastically reducing response times.
  • Privacy: Data never leaves your machine, crucial for handling sensitive information (PII).
  • Structured Output: LangChain’s Output Parsers enforce type safety, preventing crashes from malformed LLM responses.

Diving into the Code: A Basic Example

Let’s build a semantic search engine for a product catalog using Ollama and LangChain.js.

Prerequisites:

  1. Ollama installed and running locally.
  2. nomic-embed-text model pulled: ollama pull nomic-embed-text.
  3. Node.js environment with langchain and @langchain/community installed.
// src/ollama-langchain-basic.ts

import { OllamaEmbeddings } from "@langchain/community/embeddings/ollama";
import { Ollama } from "@langchain/community/llms/ollama";
import { MemoryVectorStore } from "langchain/vectorstores/memory";
import { Document } from "langchain/document";

const embeddings = new OllamaEmbeddings({
  model: "nomic-embed-text",
  baseUrl: "http://localhost:11434",
});

const llm = new Ollama({
  model: "llama3.1",
  baseUrl: "http://localhost:11434",
});

const documents: Document[] = [
  new Document({
    pageContent: "The QuickStart Pro running shoes feature advanced cushioning technology for long-distance runners.",
    metadata: { category: "Footwear", price: 120, id: "prod_001" },
  }),
  // ... more documents
];

async function searchProducts(query: string): Promise<Document[]> {
  const vectorStore = await MemoryVectorStore.fromDocuments(
    documents,
    embeddings
  );
  const searchResults = await vectorStore.similaritySearch(query, 2);
  return searchResults;
}

async function generateResponse(query: string, context: Document[]) {
  const contextText = context
    .map((doc) => `Product: ${doc.pageContent} (Price: $${doc.metadata.price})`)
    .join("n");

  const prompt = `
    User Question: ${query}

    Context Products:
    ${contextText}

    Based on the context above, recommend the best product for the user.
    Be concise and friendly.
  `;
  const response = await llm.invoke(prompt);
  return response;
}

async function main() {
  const userQuery = "I need shoes for running marathons";
  const relevantDocs = await searchProducts(userQuery);
  const aiResponse = await generateResponse(userQuery, relevantDocs);
  console.log("n=== FINAL RESULT ===");
  console.log("Recommended Product:", aiResponse);
}

main();

This example demonstrates the core workflow: embedding the query, performing a similarity search, and generating a response using the retrieved context.

Advanced Application: Semantic Search with pgvector and Ollama

For production environments, consider using pgvector with Supabase for scalable semantic search. This architecture combines the benefits of local LLM inference with a robust vector database. The code would involve:

  1. Server Action: Receiving the user query.
  2. Embedding Generation: Using OllamaEmbeddings to create a vector representation of the query.
  3. pgvector Search: Querying the documents table in PostgreSQL using pgvector to find similar documents.
  4. Context Injection: Passing the retrieved documents to OllamaLLM for a context-aware response.

Performance Optimization & Common Pitfalls

Integrating Ollama with LangChain.js requires attention to performance:

  • Memory Management: Be mindful of the keep_alive parameter in Ollama to free up resources.
  • Concurrency: Node.js is single-threaded. Offload heavy processing using RunnableLambda or asynchronous operations.
  • Token Limits: Local models have smaller context windows. Use splitters and limit retrieved chunks.
  • Ollama Timeouts: Increase timeouts for CPU-heavy models.
  • JSON Parsing: Handle potential errors when parsing LLM output.

Conclusion: The Future of Local AI

By integrating Ollama with LangChain.js, you’re building a local, distributed system that offers privacy, performance, and control. This approach unlocks a new era of AI development, empowering you to create powerful applications entirely on your own infrastructure. Embrace the power of local inference and structured workflows to build the next generation of intelligent applications.

The concepts and code demonstrated here are drawn directly from the comprehensive roadmap laid out in the book The Edge of AI. Local LLMs (Ollama), Transformers.js, WebGPU, and Performance Optimization Amazon Link of the AI with JavaScript & TypeScript Series.
The ebook is also on Leanpub.com: https://leanpub.com/EdgeOfAIJavaScriptTypeScript.

👉 Free Access now to the TypeScript & AI Series on Programming Central, it includes 8 Volumes, 160 Chapters and hundreds of quizzes for every chapter.

How to Integrate Codacy with Bitbucket Pipelines

Codacy screenshot

Why integrate Codacy with Bitbucket

Bitbucket and Atlassian’s tool ecosystem power a significant portion of the world’s software development teams, particularly in enterprises that rely on Jira, Confluence, and the broader Atlassian suite. If your team lives in Bitbucket, integrating Codacy gives you automated code quality analysis on every pull request without leaving your existing workflow.

The combination of Codacy and Bitbucket Pipelines covers everything a quality-focused team needs: static analysis across 49 programming languages, security vulnerability scanning (SAST), secrets detection, duplication checking, and test coverage tracking – all surfaced directly on your Bitbucket pull requests as status checks and inline comments.

This guide covers the end-to-end setup for both Bitbucket Cloud and Bitbucket Data Center users. You will learn how to install the Codacy app, configure your bitbucket-pipelines.yml to upload coverage reports, set up quality gates that can pass or fail your pipelines, configure PR status checks and webhooks, and troubleshoot the most common issues that come up during integration.

If you are new to Codacy altogether, our Codacy review gives a comprehensive overview of what the platform offers before you commit to the integration work.

Codacy screenshot

Bitbucket Cloud vs Bitbucket Data Center

Before walking through the setup, it is worth clarifying the two distinct Bitbucket products and how Codacy supports each of them.

Bitbucket Cloud is Atlassian’s hosted service at bitbucket.org. The Codacy cloud platform at app.codacy.com supports Bitbucket Cloud natively. You install the Codacy app from the Atlassian Marketplace, authenticate with your Bitbucket account, and everything is managed through Codacy’s cloud infrastructure. This is the path covered in most of this guide.

Bitbucket Data Center (formerly Bitbucket Server) is the self-hosted, on-premise version that organizations run on their own infrastructure. Codacy supports Bitbucket Data Center through Codacy Self-Hosted, the on-premise edition of the platform. Self-Hosted is available on Enterprise plans and requires deploying Codacy containers in your own Kubernetes or Docker environment. The configuration steps differ from the cloud approach, and you will need to contact Codacy’s sales team to get started.

If you are on Bitbucket Cloud, continue with the steps below. If you are on Bitbucket Data Center, the conceptual steps are the same but the installation process involves deploying Codacy Self-Hosted on your infrastructure first.

Step 1: Install the Codacy Bitbucket app

The Codacy Bitbucket app handles the webhook integration that triggers analysis on every push and pull request. Installing it is the first step before any pipeline configuration.

Installing from the Atlassian Marketplace

  1. Go to your Bitbucket workspace and click Settings in the left navigation
  2. Under Workspace settings, click Installed apps then Find new apps
  3. Search for “Codacy” in the Atlassian Marketplace
  4. Click Try it free or Get it now on the Codacy listing
  5. Follow the prompts to authorize the app to access your workspace

Alternatively, you can sign in at app.codacy.com using your Bitbucket credentials. Codacy will request Bitbucket OAuth permissions during the sign-in process, which effectively installs the integration.

Adding repositories to Codacy

After installing the app and signing in to Codacy:

  1. Click Add repository in the Codacy dashboard
  2. Select your Bitbucket workspace from the dropdown
  3. Find the repository you want to analyze and click Add
  4. Codacy begins an initial analysis of your default branch

Codacy automatically installs webhooks in your Bitbucket repository during this process. You can verify the webhooks were created by going to your Bitbucket repository settings, clicking Webhooks under Workflow, and checking that a Codacy webhook URL appears in the list.

Repository access levels

Codacy requires read access to your repository code to perform analysis and write access to post PR status checks and comments. When you add a repository, Codacy will prompt you to confirm these permissions. If your Bitbucket workspace uses IP allowlisting, add Codacy’s IP ranges to your allowlist to ensure webhook delivery succeeds.

Step 2: Get your Codacy project API token

The project API token authenticates the Codacy Coverage Reporter when it uploads coverage data from your Bitbucket Pipelines build to the Codacy platform.

To find the token:

  1. Navigate to your repository in the Codacy dashboard
  2. Click Settings in the left sidebar
  3. Select Coverage (or Integrations on some plan levels)
  4. Copy the Project API Token

Once you have the token, store it as a Bitbucket repository variable so your pipeline can use it without hardcoding it in your YAML file:

  1. Go to your Bitbucket repository
  2. Click Repository settings then Repository variables under Pipelines
  3. Add a variable:
    • Name: CODACY_PROJECT_TOKEN
    • Value: Paste your Codacy project token
    • Secured: Check this box to mask the value in logs
  4. Click Add

If you also want to check quality gates from your pipeline, you will need a Codacy account API token as well. Generate one from your Codacy account settings under Access tokens and store it as CODACY_ACCOUNT_TOKEN in your Bitbucket repository variables using the same process.

Step 3: Configure bitbucket-pipelines.yml for coverage upload

The core of the Bitbucket Pipelines integration is adding a coverage upload step to your bitbucket-pipelines.yml file. The Codacy Coverage Reporter is a shell script that you download and run after your tests complete.

Basic pipeline structure

Here is the general pattern that applies to any language:

pipelines:
  default:
    - step:
        name: Build, Test, and Upload Coverage
        script:
          - # Run your build and tests here
          - pipe: atlassian/git-secrets-scan:0.5.1
          - curl -Ls https://coverage.codacy.com/get.sh -o codacy-coverage-reporter.sh
          - bash codacy-coverage-reporter.sh report
              -r <path-to-coverage-report>
              --project-token $CODACY_PROJECT_TOKEN
              --commit-uuid $BITBUCKET_COMMIT

The $BITBUCKET_COMMIT environment variable is provided automatically by Bitbucket Pipelines and contains the full commit SHA. Passing it to the Coverage Reporter with --commit-uuid ensures Codacy associates the coverage data with the correct commit, which is critical for PR-level coverage display.

Java project with Maven and JaCoCo

image: maven:3.9-eclipse-temurin-17

pipelines:
  default:
    - step:
        name: Build and Test
        caches:
          - maven
        script:
          - mvn clean test
    - step:
        name: Upload Coverage to Codacy
        script:
          - curl -Ls https://coverage.codacy.com/get.sh -o codacy-coverage-reporter.sh
          - bash codacy-coverage-reporter.sh report
              -r target/site/jacoco/jacoco.xml
              --project-token $CODACY_PROJECT_TOKEN
              --commit-uuid $BITBUCKET_COMMIT

  pull-requests:
    '**':
      - step:
          name: Build and Test
          caches:
            - maven
          script:
            - mvn clean test
      - step:
          name: Upload Coverage to Codacy
          script:
            - curl -Ls https://coverage.codacy.com/get.sh -o codacy-coverage-reporter.sh
            - bash codacy-coverage-reporter.sh report
                -r target/site/jacoco/jacoco.xml
                --project-token $CODACY_PROJECT_TOKEN
                --commit-uuid $BITBUCKET_COMMIT

The pull-requests section tells Bitbucket Pipelines to run this pipeline whenever a pull request is opened or updated, regardless of the source branch name ('**' matches all branch names). This ensures every PR gets coverage uploaded to Codacy.

JavaScript and TypeScript with npm

image: node:20-alpine

pipelines:
  default:
    - step:
        name: Install and Test
        caches:
          - node
        script:
          - npm ci
          - npm test -- --coverage --coverageReporters=lcov
    - step:
        name: Upload Coverage to Codacy
        script:
          - apk add --no-cache curl bash
          - curl -Ls https://coverage.codacy.com/get.sh -o codacy-coverage-reporter.sh
          - bash codacy-coverage-reporter.sh report
              -r coverage/lcov.info
              --project-token $CODACY_PROJECT_TOKEN
              --commit-uuid $BITBUCKET_COMMIT

  pull-requests:
    '**':
      - step:
          name: Install and Test
          caches:
            - node
          script:
            - npm ci
            - npm test -- --coverage --coverageReporters=lcov
      - step:
          name: Upload Coverage to Codacy
          script:
            - apk add --no-cache curl bash
            - curl -Ls https://coverage.codacy.com/get.sh -o codacy-coverage-reporter.sh
            - bash codacy-coverage-reporter.sh report
                -r coverage/lcov.info
                --project-token $CODACY_PROJECT_TOKEN
                --commit-uuid $BITBUCKET_COMMIT

Note the apk add --no-cache curl bash step – the Alpine-based Node image does not include curl or bash by default, so you need to install them before downloading the Coverage Reporter. If you are using a Debian-based image (e.g., node:20), replace apk with apt-get install -y curl.

Python with pytest

image: python:3.12-slim

pipelines:
  default:
    - step:
        name: Test with Coverage
        script:
          - pip install -r requirements.txt pytest pytest-cov
          - pytest --cov=src --cov-report=xml:coverage.xml
    - step:
        name: Upload Coverage to Codacy
        script:
          - apt-get update && apt-get install -y curl
          - curl -Ls https://coverage.codacy.com/get.sh -o codacy-coverage-reporter.sh
          - bash codacy-coverage-reporter.sh report
              -r coverage.xml
              --project-token $CODACY_PROJECT_TOKEN
              --commit-uuid $BITBUCKET_COMMIT

  pull-requests:
    '**':
      - step:
          name: Test with Coverage
          script:
            - pip install -r requirements.txt pytest pytest-cov
            - pytest --cov=src --cov-report=xml:coverage.xml
      - step:
          name: Upload Coverage to Codacy
          script:
            - apt-get update && apt-get install -y curl
            - curl -Ls https://coverage.codacy.com/get.sh -o codacy-coverage-reporter.sh
            - bash codacy-coverage-reporter.sh report
                -r coverage.xml
                --project-token $CODACY_PROJECT_TOKEN
                --commit-uuid $BITBUCKET_COMMIT

Step 4: PR status checks in Bitbucket

Once Codacy is connected to your Bitbucket repository, it automatically posts a status check to each pull request. The status check appears in the PR’s merge button area and shows whether Codacy analysis passed or found issues.

Understanding Codacy status check states

Codacy posts one of three statuses to Bitbucket for each PR:

  • Successful – The PR passes your configured quality gate thresholds and no blocking issues were found
  • Failed – The PR violates one or more quality gate thresholds (too many new issues, coverage too low, etc.)
  • Pending – Codacy is still processing the analysis or waiting for coverage data

The status check name in Bitbucket will appear as “Codacy Static Analysis” or similar, depending on your Codacy plan and configuration.

Requiring Codacy status checks before merge

To enforce code quality at the PR level, configure Bitbucket to require the Codacy status check to pass before any PR can be merged:

  1. Go to your Bitbucket repository and click Repository settings
  2. Under Workflow, click Branch restrictions
  3. Click Add a branch restriction
  4. Set the branch pattern to match your target branch (e.g., main or master)
  5. Under Merge checks, enable Require minimum number of approvals if desired
  6. Also enable any option for requiring CI/CD status checks to pass
  7. Save the restriction

With this configured, a PR cannot be merged until Codacy’s analysis completes and returns a successful status. This effectively makes Codacy analysis a required gate in your development workflow.

Configuring what Codacy analyzes on PRs

By default, Codacy analyzes new code introduced in the PR and compares it against your quality gate thresholds. You can control this behavior in your Codacy repository settings:

  • New issues gate – Fail if the PR introduces more than N issues (configurable per severity level)
  • Coverage gate – Fail if coverage on new code falls below a threshold
  • Duplication gate – Fail if the PR introduces duplicated code above a threshold

Navigate to your repository in Codacy, click Quality settings, and adjust the thresholds to match your team’s standards.

Step 5: Coverage reporting via Bitbucket Pipelines

Coverage reporting from Bitbucket Pipelines to Codacy is straightforward for most setups, but there are some nuances worth understanding for larger or more complex projects.

Uploading multiple coverage reports

If your project has separate test suites – unit tests and integration tests, for example – or if you run tests in parallel Bitbucket Pipelines steps, you can upload multiple partial coverage reports that Codacy aggregates into a single metric.

pipelines:
  pull-requests:
    '**':
      - parallel:
          - step:
              name: Unit Tests
              script:
                - mvn test -P unit-tests
                - curl -Ls https://coverage.codacy.com/get.sh -o codacy-coverage-reporter.sh
                - bash codacy-coverage-reporter.sh report
                    -r target/site/jacoco-unit/jacoco.xml
                    --partial
                    --project-token $CODACY_PROJECT_TOKEN
                    --commit-uuid $BITBUCKET_COMMIT
          - step:
              name: Integration Tests
              script:
                - mvn verify -P integration-tests
                - curl -Ls https://coverage.codacy.com/get.sh -o codacy-coverage-reporter.sh
                - bash codacy-coverage-reporter.sh report
                    -r target/site/jacoco-integration/jacoco.xml
                    --partial
                    --project-token $CODACY_PROJECT_TOKEN
                    --commit-uuid $BITBUCKET_COMMIT
      - step:
          name: Finalize Coverage
          script:
            - curl -Ls https://coverage.codacy.com/get.sh -o codacy-coverage-reporter.sh
            - bash codacy-coverage-reporter.sh final
                --project-token $CODACY_PROJECT_TOKEN
                --commit-uuid $BITBUCKET_COMMIT

The --partial flag tells Codacy to expect more coverage data before aggregating. The final command in the downstream step signals that all partial reports have been uploaded. Without the final command, Codacy keeps waiting and the coverage dashboard never updates.

Coverage for monorepos

For monorepos with multiple components in subdirectories, you can upload coverage from each component using separate reporter invocations with the --partial flag, then finalize once all uploads are complete. Keep in mind that the Codacy project token is per-repository, so all components in the same Bitbucket repository share the same token and coverage metrics.

If different monorepo components are treated as separate Codacy repositories, each has its own token and you upload coverage to the corresponding project independently.

Step 6: Quality gates with Bitbucket Pipelines

Quality gates let you fail a Bitbucket Pipelines build based on whether the code meets your configured thresholds. This gives you pipeline-level enforcement in addition to PR status checks.

Setting up quality gate thresholds in Codacy

Before querying quality gates from your pipeline, configure the thresholds:

  1. Open your repository in Codacy
  2. Click Quality settings in the sidebar
  3. Set thresholds for the metrics relevant to your team:
Metric Example Threshold Effect
New issues (critical) 0 allowed Fail on any critical issue
New issues (total) 5 allowed Fail if more than 5 new issues
Coverage on new code 60% minimum Fail if new code is under 60% covered
Coverage variation -2% maximum Fail if overall coverage drops
Duplication 5% maximum Fail on excessive duplication

Querying quality gates from bitbucket-pipelines.yml

After coverage is uploaded and analysis is triggered, query the Codacy API to check the quality gate status:

- step:
    name: Check Codacy Quality Gate
    script:
      - |
        COMMIT_SHA=$BITBUCKET_COMMIT
        ORG="your-org"
        REPO="your-repo"
        PROVIDER="bb"
        MAX_ATTEMPTS=20
        SLEEP_SECONDS=15
        PASSED=false

        for i in $(seq 1 $MAX_ATTEMPTS); do
          RESPONSE=$(curl -s -w "n%{http_code}" 
            "https://app.codacy.com/api/v3/analysis/organizations/${PROVIDER}/${ORG}/repositories/${REPO}/commits/${COMMIT_SHA}/quality" 
            -H "api-token: $CODACY_ACCOUNT_TOKEN" 
            -H "Accept: application/json")

          HTTP_CODE=$(echo "$RESPONSE" | tail -n1)
          BODY=$(echo "$RESPONSE" | head -n -1)

          if [ "$HTTP_CODE" = "200" ]; then
            IS_UP=$(echo "$BODY" | python3 -c "import sys,json; d=json.load(sys.stdin); print(d.get('data',{}).get('isUpToStandards','null'))")

            if [ "$IS_UP" = "True" ]; then
              echo "Codacy quality gate PASSED."
              PASSED=true
              break
            elif [ "$IS_UP" = "False" ]; then
              echo "Codacy quality gate FAILED. Check the Codacy dashboard for details."
              exit 1
            fi
          fi

          echo "Waiting for Codacy analysis (attempt $i of $MAX_ATTEMPTS)..."
          sleep $SLEEP_SECONDS
        done

        if [ "$PASSED" = "false" ]; then
          echo "WARNING: Quality gate check timed out. Proceeding."
        fi

The provider code for Bitbucket is bb. For GitHub it is gh and for GitLab it is gl. Replace your-org with your Bitbucket workspace slug and your-repo with the repository slug as they appear in your Bitbucket URL.

The polling loop waits up to 5 minutes (20 attempts x 15 seconds) for Codacy to complete analysis before timing out. Adjust these values based on your repository size and typical Codacy analysis duration.

Using Python to parse the API response

The shell-based JSON parsing above uses Python, which is available in most CI images. If your pipeline image does not have Python, you can use jq instead:

IS_UP=$(echo "$BODY" | jq -r '.data.isUpToStandards')

Or install jq if needed:

apt-get install -y jq

Step 7: Webhook setup and configuration

Webhooks are the mechanism that tells Codacy when to start analyzing your code. For most teams, the Codacy Bitbucket app configures webhooks automatically. This section covers manual webhook setup for cases where automatic configuration does not work, and how to verify your webhooks are functioning.

Verifying automatic webhook installation

After connecting your repository to Codacy, verify the webhook exists:

  1. Go to your Bitbucket repository
  2. Click Repository settings then Webhooks under Workflow
  3. You should see a webhook with a URL pointing to app.codacy.com or webhooks.codacy.com
  4. Check that the webhook triggers are set to at least Repository push and Pull request events

If the webhook is missing, you can try removing and re-adding your repository in Codacy to trigger automatic webhook re-installation.

Manual webhook configuration

If you need to configure webhooks manually – for example in a Bitbucket Data Center environment or when automatic installation fails:

  1. Go to your Bitbucket repository settings and click Webhooks
  2. Click Add webhook
  3. Fill in the webhook details:
    • Title: Codacy
    • URL: Copy the webhook URL from your Codacy repository settings under Integrations
    • Status: Active
    • SSL/TLS: Verify SSL (keep enabled unless you have certificate issues)
  4. Under Triggers, select:
    • Repository: Push
    • Pull Request: Created, Updated, Approved, Comment created
  5. Click Save

After adding the webhook, trigger it by pushing a commit or creating a test PR. Check the webhook delivery history in Bitbucket to confirm Codacy received the payload and responded with a 200 status code.

Webhook delivery failures

If Codacy is not triggering on your pushes or PRs, check the webhook delivery history. Common causes of delivery failures include:

  • Network restrictions – If your Bitbucket instance (Data Center) cannot reach Codacy’s servers, webhook deliveries will fail. Check firewall rules and ensure outbound HTTPS to Codacy’s domain is allowed.
  • Incorrect webhook URL – Regenerate the webhook URL from Codacy’s settings and update the Bitbucket webhook accordingly.
  • IP allowlisting – If Bitbucket Cloud’s webhook delivery IPs are blocked on your end, add Atlassian’s webhook IP ranges to your allowlist.

Step 8: Complete bitbucket-pipelines.yml example

Here is a complete, production-ready bitbucket-pipelines.yml that combines build, test, coverage upload, and quality gate checking for a Java project. Adapt the language-specific parts to match your stack.

image: maven:3.9-eclipse-temurin-17

definitions:
  caches:
    maven: ~/.m2/repository
  steps:
    - step: &build-and-test
        name: Build and Test
        caches:
          - maven
        script:
          - mvn clean test
        artifacts:
          - target/site/jacoco/**
          - target/surefire-reports/**

    - step: &upload-coverage
        name: Upload Coverage to Codacy
        script:
          - curl -Ls https://coverage.codacy.com/get.sh -o codacy-coverage-reporter.sh
          - bash codacy-coverage-reporter.sh report
              -r target/site/jacoco/jacoco.xml
              --project-token $CODACY_PROJECT_TOKEN
              --commit-uuid $BITBUCKET_COMMIT

    - step: &quality-gate
        name: Check Codacy Quality Gate
        script:
          - |
            COMMIT_SHA=$BITBUCKET_COMMIT
            ORG="your-workspace"
            REPO="your-repo"
            MAX_ATTEMPTS=20
            SLEEP_SECONDS=15
            PASSED=false

            for i in $(seq 1 $MAX_ATTEMPTS); do
              RESPONSE=$(curl -s -w "n%{http_code}" 
                "https://app.codacy.com/api/v3/analysis/organizations/bb/${ORG}/repositories/${REPO}/commits/${COMMIT_SHA}/quality" 
                -H "api-token: $CODACY_ACCOUNT_TOKEN" 
                -H "Accept: application/json")

              HTTP_CODE=$(echo "$RESPONSE" | tail -n1)
              BODY=$(echo "$RESPONSE" | head -n -1)

              if [ "$HTTP_CODE" = "200" ]; then
                IS_UP=$(echo "$BODY" | python3 -c "import sys,json; d=json.load(sys.stdin); print(d.get('data',{}).get('isUpToStandards','null'))")

                if [ "$IS_UP" = "True" ]; then
                  echo "Codacy quality gate PASSED."
                  PASSED=true
                  break
                elif [ "$IS_UP" = "False" ]; then
                  echo "Codacy quality gate FAILED."
                  exit 1
                fi
              fi

              echo "Waiting for Codacy analysis (attempt $i of $MAX_ATTEMPTS)..."
              sleep $SLEEP_SECONDS
            done

            if [ "$PASSED" = "false" ]; then
              echo "Quality gate timed out. Check Codacy dashboard manually."
            fi

pipelines:
  default:
    - step: *build-and-test
    - step: *upload-coverage

  pull-requests:
    '**':
      - step: *build-and-test
      - step: *upload-coverage
      - step: *quality-gate

  branches:
    main:
      - step: *build-and-test
      - step: *upload-coverage
      - step: *quality-gate
    develop:
      - step: *build-and-test
      - step: *upload-coverage
      - step: *quality-gate

The YAML anchors (&build-and-test, *build-and-test) let you define pipeline steps once and reuse them across multiple pipeline configurations without duplication. The artifacts section in the build step ensures the JaCoCo coverage report file is available to the upload step even though they run as separate pipeline steps.

Codacy Bitbucket vs other CI integrations

Codacy’s Bitbucket integration compares favorably to its other CI integrations in terms of native support. The Bitbucket app is a first-class integration that provides automatic webhook setup, PR status checks, inline code comments, and dashboard integration out of the box.

For teams using GitHub, the experience is similar – see our Codacy GitHub integration guide for a side-by-side comparison. For GitLab users, check out Codacy GitLab integration.

The main difference between Bitbucket and GitHub/GitLab integrations is that Codacy’s GitHub App tends to get feature updates first, since GitHub represents the largest share of Codacy’s user base. That said, Bitbucket integration is mature and well-supported, and teams using Bitbucket Cloud should not experience meaningful feature gaps.

For Jenkins-based pipelines that supplement your Bitbucket Pipelines setup, our Codacy Jenkins guide covers that integration in detail.

Alternative: CodeAnt AI for Bitbucket teams

If you are evaluating code quality tools and want to compare Codacy against alternatives that also support Bitbucket, CodeAnt AI is worth a close look. Priced at $24-40 per user per month, CodeAnt AI offers AI-powered code review that goes beyond pattern matching to catch logic errors, design issues, and context-dependent problems that rule-based static analysis tools often miss.

CodeAnt AI supports Bitbucket Cloud and integrates with Bitbucket Pipelines for CI/CD-based analysis. The setup process is similar to Codacy – install the Bitbucket app, store an API token as a repository variable, and add a pipeline step to trigger analysis. Where CodeAnt AI differs is in the analysis engine itself: it uses large language models to review code in context, making its feedback more similar to what you would get from a senior developer code review than from a linter.

For teams that find Codacy’s rule-based approach produces too many false positives or misses the kinds of issues that come up in human code reviews, CodeAnt AI’s AI-first model is a compelling alternative. For a full comparison across tools in this space, our Codacy alternatives guide covers CodeAnt AI, SonarQube, DeepSource, Semgrep, and others.

Troubleshooting

Coverage not showing on Bitbucket PR

If coverage data is uploaded but not appearing on the Bitbucket PR:

  • Check the pipeline logs – Look for errors in the coverage reporter output. Common errors include “project token not found” (wrong token), “commit not found” (SHA mismatch), and “report file not found” (wrong path).
  • Verify the coverage file exists – Add ls -la target/site/jacoco/ before the reporter step to confirm the file was generated.
  • Check the commit SHA – Ensure $BITBUCKET_COMMIT is the correct SHA. For PRs from forks, this may need adjustment.
  • Wait longer – Codacy processes coverage data asynchronously. Coverage typically appears within 2-3 minutes of upload, but can take longer for large repositories.

Codacy status check not appearing on PR

If the Codacy status check is absent from your Bitbucket PR entirely:

  • Verify the webhook – Check that the Codacy webhook exists in your repository settings and that recent deliveries succeeded (HTTP 200 response).
  • Check the app permissions – Ensure the Codacy app still has access to your workspace. Token revocation or workspace permission changes can break this.
  • Re-add the repository in Codacy – Sometimes removing and re-adding the repository in Codacy reinstalls the webhook and fixes the connection.

Quality gate API returning 404

A 404 from the Codacy API quality gate endpoint usually means:

  • The organization slug or repository slug in your API URL does not match exactly what Codacy expects. Use your Bitbucket workspace slug (the URL identifier, not the display name) and the exact repository slug from your Bitbucket URL.
  • The commit has not been analyzed yet. Increase the polling wait time.
  • The account API token does not have access to the repository. Verify the token is from an account that has access to the repository in Codacy.

Pipeline running on PRs from forks

Bitbucket Pipelines has specific behavior for PRs from forked repositories regarding repository variables. By default, repository variables are not available to fork pipelines for security reasons. If your contributors submit PRs from forks, the $CODACY_PROJECT_TOKEN variable will be unavailable in those pipelines.

To address this, you can either allow secured variables to be used in fork pipelines (check your Bitbucket pipeline settings) or accept that fork PRs will not have coverage uploaded – Codacy will still perform static analysis triggered by the webhook.

Summary

Integrating Codacy with Bitbucket is a two-part process: installing the Codacy Bitbucket app for automatic webhook-driven static analysis on PRs, and configuring bitbucket-pipelines.yml for coverage uploading and optional quality gate enforcement.

The app installation handles the analysis side automatically – once connected, every PR in your repository gets static analysis, SAST scanning, and inline code comments from Codacy without any pipeline configuration. The pipeline configuration layer adds coverage tracking and the ability to fail builds based on quality thresholds, rounding out the integration into a comprehensive automated quality system.

For Bitbucket Data Center users, Codacy Self-Hosted is the path forward – the same capabilities in an on-premise deployment that keeps your code within your own infrastructure.

If Codacy does not fit your needs after the evaluation, CodeAnt AI ($24-40/user/month) offers a strong AI-powered alternative with Bitbucket support, and our Codacy alternatives guide covers the full landscape of options. For a deeper look at Codacy itself, visit our Codacy tool page and our Codacy review for an honest assessment of its strengths and limitations.

Further Reading

Frequently Asked Questions

How do I connect Codacy to Bitbucket?

Install the Codacy app from the Bitbucket Marketplace under Settings then Find new apps, then authorize Codacy to access your workspace. Once authorized, go to app.codacy.com, sign in with your Bitbucket account, and add the repositories you want to analyze. Codacy will start analyzing pull requests automatically via webhooks that the app installs for you.

Does Codacy work with Bitbucket Pipelines?

Yes. Codacy integrates with Bitbucket Pipelines for coverage uploading and quality gate enforcement. You add pipeline steps to your bitbucket-pipelines.yml that download the Codacy Coverage Reporter, run it after your tests, and optionally query the Codacy API to check whether the commit passes your configured quality gate thresholds.

Does Codacy support Bitbucket Server (Data Center)?

Codacy supports Bitbucket Data Center (formerly Bitbucket Server) through Codacy Self-Hosted, the on-premise version of the platform. The cloud version at app.codacy.com supports Bitbucket Cloud only. Self-Hosted requires a dedicated deployment on your own infrastructure and is available on Enterprise plans.

How do I upload code coverage from Bitbucket Pipelines to Codacy?

Add a pipeline step that downloads the Codacy Coverage Reporter shell script with curl, then runs it pointing at your coverage report file and authenticated with your CODACY_PROJECT_TOKEN repository variable. Supported formats include LCOV, Cobertura XML, JaCoCo XML, Clover, and OpenCover. Store the project token as a repository variable in Bitbucket so it is not hardcoded in your YAML.

How do I set up Codacy quality gates with Bitbucket Pipelines?

Configure quality gate thresholds in the Codacy dashboard under Quality settings for your repository. In your bitbucket-pipelines.yml, after uploading coverage, query the Codacy API with your account token to check whether the commit’s isUpToStandards field is true or false. If it is false, exit the pipeline step with a non-zero code to fail the build. Use a polling loop to wait for Codacy to finish analysis before checking the gate.

What is the Codacy project API token and where do I find it?

The Codacy project API token authenticates the Coverage Reporter when uploading coverage data for a specific repository. Find it by going to your repository in Codacy, clicking Settings, then selecting the Coverage or Integrations section. Copy the project token and store it as a Bitbucket repository variable named CODACY_PROJECT_TOKEN so your pipeline can access it securely.

How do I get Codacy to comment on Bitbucket pull requests?

Codacy comments on Bitbucket pull requests automatically once you install the Codacy Bitbucket app and connect your repositories. No additional pipeline configuration is needed for PR comments – they are driven by Codacy’s webhook integration, which triggers static analysis whenever a PR is opened or updated. You can configure whether Codacy posts inline comments, a summary comment, or both in your Codacy repository settings.

How do I set up Codacy webhooks for Bitbucket?

Webhooks are configured automatically when you install the Codacy Bitbucket app. If you need to set up webhooks manually – for example in a self-hosted scenario – go to your Bitbucket repository settings, select Webhooks under Workflow, and add a webhook pointing to the Codacy webhook URL with push and pull request events enabled. The Codacy webhook URL is available in your repository’s Codacy settings under Integrations.

Why is Codacy not showing coverage on my Bitbucket PR?

The most common causes are a missing or incorrect CODACY_PROJECT_TOKEN, a coverage report path that does not match the actual generated file, or a commit SHA mismatch between what Pipelines reports and what Codacy expects. Also check that you are running the coverage upload step after the test step and that the test step actually generated a coverage file. Add an ls step in your pipeline to verify the file exists before running the reporter.

Can I use Codacy with Bitbucket branch restrictions?

Yes. You can require the Codacy status check to pass before merging a pull request by enabling branch restrictions in Bitbucket. Go to your repository settings, select Branch restrictions under Workflow, add a restriction for your target branch (e.g., main), and set the merge checks to require the Codacy status to be successful. This prevents any PR from being merged unless Codacy analysis passes.

Is there a Codacy alternative that supports Bitbucket?

CodeAnt AI ($24-40 per user per month) is a strong alternative that supports Bitbucket and provides AI-powered code review. SonarQube Cloud also integrates with Bitbucket Pipelines. DeepSource and Semgrep are additional options worth evaluating if you need different capabilities such as deep security scanning or a more flexible rule engine.

How long does Codacy analysis take on a Bitbucket PR?

Codacy typically completes analysis within 1 to 5 minutes for most repositories. Very large codebases with many files or slow analysis tools can take up to 15 minutes. The analysis runs in Codacy’s cloud infrastructure triggered by the Bitbucket webhook, so it does not affect your Bitbucket Pipelines build time directly. Coverage upload time from your pipeline is typically under 30 seconds.

Originally published at aicodereview.cc