Building a Production eBPF Observability & Security Stack for Kubernetes in 2026

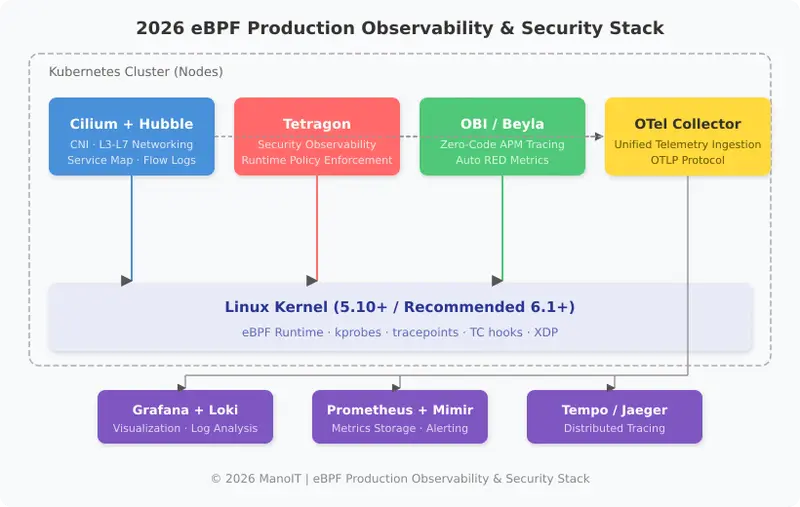
eBPF production stack architecture diagram showing Cilium Hubble for networking, Tetragon for security observability, Beyla OBI for zero-code APM tracing, and OTel Collector feeding into Grafana Loki Prometheus and Tempo backends on Kubernetes

Building a Production eBPF Observability & Security Stack for Kubernetes in 2026
Understanding what’s happening inside a production Kubernetes cluster running thousands of containers remains one of the hardest operational challenges. Attaching sidecar proxies increases resource overhead, and embedding SDKs requires application code changes. eBPF (extended Berkeley Packet Filter) solves this problem at the kernel level. According to the 2026 CNCF Observability Technical Advisory Group (TAG) survey, 67% of teams running Kubernetes at scale have already adopted at least one eBPF-based observability tool in production.

This guide covers everything from the latest announcements at KubeCon EU 2026 to building a complete production observability and security stack with Cilium, Tetragon, Grafana Beyla, and the newly launched OpenTelemetry eBPF Instrumentation (OBI).

Why eBPF Became the Standard for Kubernetes Observability

Let’s start by comparing traditional observability approaches with the eBPF-based approach. The key insight is: “Collect telemetry directly from the kernel without any code changes.”

Comparison Traditional (SDK/Sidecar) eBPF Approach
Instrumentation Embed SDK in app code or deploy sidecar proxy eBPF program in Linux kernel collects automatically
Code Changes Required (import, init, span creation) Not required (zero-code instrumentation)
CPU Overhead 3~8% per Pod (sidecar) Less than 1% per node
Memory Overhead 50~120MB per sidecar Single DaemonSet per node (40~80MB)
Restart Required Pod redeployment needed for SDK changes Applied immediately without Pod restart
Language Support Separate SDK per language (Java, Python, Go, etc.) Kernel-level — supports all languages
Collection Depth Application-level spans/metrics Network flows, syscalls, file I/O, process execution
Security Observability Requires separate security agent Unified security event collection via same eBPF programs

An eBPF program runs just once per node and collects telemetry for every Pod on that node. Even with 100 Pods, you need a single DaemonSet instead of 100 sidecars. This is why eBPF has an overwhelming advantage at scale.

2026 Production eBPF Stack Architecture

The most battle-tested eBPF production stack in 2026 consists of four core components, each with clearly separated responsibilities. All are CNCF projects or part of the CNCF ecosystem.

eBPF production stack architecture diagram showing Cilium Hubble for networking, Tetragon for security observability, Beyla OBI for zero-code APM tracing, and OTel Collector feeding into Grafana Loki Prometheus and Tempo backends on Kubernetes

As shown in the diagram above, Cilium/Hubble handles the network layer, Tetragon handles the security layer, OBI/Beyla handles application tracing, and all telemetry is delivered to backends (Grafana, Prometheus, Tempo) through the OpenTelemetry Collector.

Kernel Version Requirements

Choosing the right kernel version is critical for deploying the eBPF stack in production. The minimum requirement is 5.10 LTS, and the recommended version for 2026 production use is 6.1+.

Distribution / OS Default Kernel CO-RE Support Production Readiness
Ubuntu 24.04 LTS 6.8 Yes Excellent
Amazon Linux 2023 6.1 Yes Excellent
Bottlerocket (AWS) 6.1 Yes Excellent
Container-Optimized OS (GKE) 6.1 Yes Excellent
Ubuntu 22.04 LTS 5.15 Yes Good
RHEL 9 / Rocky 9 5.14 Yes Good
Amazon Linux 2 5.10 Partial Fair

Tip: Using kernel 6.1+ with CO-RE (Compile Once, Run Everywhere) support means you can deploy eBPF programs without recompiling on each node. For EKS, choose Amazon Linux 2023 or Bottlerocket AMI. For GKE, use Container-Optimized OS.

Step 1: Cilium + Hubble — Network Observability

Cilium is an eBPF-based CNI (Container Network Interface) that replaces traditional iptables with L3/L4/L7 network policies and observability capabilities. Hubble is the network observability layer on top of Cilium, providing service map visualization and flow logs.

Installing Cilium (Helm)

# Install Cilium CLI
CILIUM_CLI_VERSION=$(curl -s https://raw.githubusercontent.com/cilium/cilium-cli/main/stable.txt)
curl -L --fail --remote-name-all 
  https://github.com/cilium/cilium-cli/releases/download/${CILIUM_CLI_VERSION}/cilium-linux-amd64.tar.gz
sudo tar xzvfC cilium-linux-amd64.tar.gz /usr/local/bin
rm cilium-linux-amd64.tar.gz

# Install Cilium + Hubble via Helm
helm repo add cilium https://helm.cilium.io/
helm repo update

helm install cilium cilium/cilium --version 1.16.5 
  --namespace kube-system 
  --set hubble.enabled=true 
  --set hubble.relay.enabled=true 
  --set hubble.ui.enabled=true 
  --set hubble.metrics.enableOpenMetrics=true 
  --set hubble.metrics.enabled="{dns,drop,tcp,flow,port-distribution,icmp,httpV2:exemplars=true;labelsContext=source_ip,source_namespace,source_workload,destination_ip,destination_namespace,destination_workload,traffic_direction}" 
  --set prometheus.enabled=true 
  --set operator.prometheus.enabled=true 
  --set kubeProxyReplacement=true

Verifying Hubble Network Flow Observation

# Check Cilium status
cilium status --wait

# Observe real-time flows with Hubble CLI
hubble observe --namespace default --follow

# Filter traffic between specific services
hubble observe 
  --from-namespace production 
  --to-namespace production 
  --to-label app=api-gateway 
  --protocol TCP 
  --verdict FORWARDED

# Filter by HTTP response code (L7 observation)
hubble observe --http-status 500 --namespace production

# Port-forward to Hubble UI for service map visualization
kubectl port-forward -n kube-system svc/hubble-ui 12000:80

Once you access the Hubble UI, you can see real-time service maps of all inter-service traffic in the cluster. L7 protocol-level (HTTP, gRPC, Kafka) request/response metrics are also collected automatically.

Cilium Network Policy Example

# cilium-network-policy.yaml
# L7 HTTP policy from API Gateway to backend services
apiVersion: "cilium.io/v2"
kind: CiliumNetworkPolicy
metadata:
  name: api-gateway-to-backend
  namespace: production
spec:
  endpointSelector:
    matchLabels:
      app: backend-api
  ingress:
    - fromEndpoints:
        - matchLabels:
            app: api-gateway
      toPorts:
        - ports:
            - port: "8080"
              protocol: TCP
          rules:
            http:
              - method: "GET"
                path: "/api/v1/.*"
              - method: "POST"
                path: "/api/v1/.*"
                headers:
                  - 'Content-Type: application/json'

Step 2: Tetragon — Runtime Security Observability

Tetragon is a Cilium sub-project and CNCF project that uses eBPF to observe runtime security events directly from the kernel and enforce policies. It monitors process execution, file access, network connections, and system calls in real time, with the ability to block threats at the kernel level instantly.

Installing Tetragon

# Install Tetragon via Helm
helm repo add cilium https://helm.cilium.io
helm repo update

helm install tetragon cilium/tetragon 
  --namespace kube-system 
  --set tetragon.grpc.address="localhost:54321" 
  --set tetragon.exportFilename="/var/run/cilium/tetragon/tetragon.log" 
  --set tetragon.enableProcessCred=true 
  --set tetragon.enableProcessNs=true

# Install tetra CLI (for event observation)
GOOS=$(go env GOOS)
GOARCH=$(go env GOARCH)
curl -L --remote-name-all 
  https://github.com/cilium/tetragon/releases/latest/download/tetra-${GOOS}-${GOARCH}.tar.gz
sudo tar -C /usr/local/bin -xzvf tetra-${GOOS}-${GOARCH}.tar.gz
rm tetra-${GOOS}-${GOARCH}.tar.gz

TracingPolicy: Detecting Sensitive File Access

# tracing-policy-sensitive-files.yaml
# Detect and block access to sensitive files like /etc/shadow, /etc/passwd
apiVersion: cilium.io/v1alpha1
kind: TracingPolicy
metadata:
  name: sensitive-file-access
spec:
  kprobes:
    - call: "fd_install"
      syscall: false
      args:
        - index: 0
          type: int
        - index: 1
          type: "file"
      selectors:
        - matchArgs:
            - index: 1
              operator: "Prefix"
              values:
                - "/etc/shadow"
                - "/etc/passwd"
                - "/etc/kubernetes/pki"
                - "/var/run/secrets/kubernetes.io"
          matchActions:
            - action: Sigkill   # Immediately terminate the process
            - action: Post      # Send event log

TracingPolicy: Detecting Privilege Escalation

# tracing-policy-privilege-escalation.yaml
# Detect privilege escalation attempts inside containers
apiVersion: cilium.io/v1alpha1
kind: TracingPolicy
metadata:
  name: privilege-escalation-detect
spec:
  kprobes:
    - call: "__x64_sys_setuid"
      syscall: true
      args:
        - index: 0
          type: int
      selectors:
        - matchArgs:
            - index: 0
              operator: "Equal"
              values:
                - "0"   # Attempt to change to UID 0 (root)
          matchNamespaces:
            - namespace: Pid    # Container PID namespace
              operator: NotIn
              values:
                - "host_init_pid"  # Not host init process
          matchActions:
            - action: Sigkill
            - action: Post

Real-time Security Event Observation

# Observe real-time process execution events
kubectl exec -n kube-system ds/tetragon -c tetragon -- 
  tetra getevents -o compact

# Example output:
# process default/nginx-7d8b49557c-x2k9p /bin/sh -c "cat /etc/shadow"
# exit    default/nginx-7d8b49557c-x2k9p /bin/sh -c "cat /etc/shadow" SIGKILL
# -> /etc/shadow access attempt blocked immediately

# Detailed event output in JSON format
kubectl exec -n kube-system ds/tetragon -c tetragon -- 
  tetra getevents -o json | jq '.process_exec | {pod: .process.pod.name, binary: .process.binary, args: .process.arguments}'

# Filter events by specific namespace
kubectl exec -n kube-system ds/tetragon -c tetragon -- 
  tetra getevents -o compact --namespace production

Step 3: OBI / Grafana Beyla — Zero-Code APM Tracing

OpenTelemetry eBPF Instrumentation (OBI) is the zero-code observability solution that Splunk announced in beta at KubeCon EU 2026. Originally developed by Grafana Labs as Beyla, it was donated to the OpenTelemetry project and is now co-developed by Grafana Labs, Splunk, Coralogix, Odigos, and other vendors.

OBI monitors network traffic using eBPF to automatically generate distributed traces and RED metrics (Rate, Errors, Duration). It supports all major languages without code modifications, including Go, Java, Python, Node.js, .NET, Ruby, C/C++, and Rust.

Deploying Beyla DaemonSet

# beyla-daemonset.yaml
apiVersion: apps/v1
kind: DaemonSet
metadata:
  name: beyla
  namespace: observability
  labels:
    app: beyla
spec:
  selector:
    matchLabels:
      app: beyla
  template:
    metadata:
      labels:
        app: beyla
    spec:
      serviceAccountName: beyla
      hostPID: true           # eBPF needs access to host processes
      hostNetwork: true       # Required for network traffic capture
      containers:
        - name: beyla
          image: grafana/beyla:1.9
          securityContext:
            privileged: true    # Required for loading eBPF programs
          env:
            - name: BEYLA_OPEN_PORT
              value: "80,443,3000,8080,8443,9090"  # Ports to observe
            - name: BEYLA_SERVICE_NAMESPACE
              valueFrom:
                fieldRef:
                  fieldPath: metadata.namespace
            - name: OTEL_EXPORTER_OTLP_ENDPOINT
              value: "http://otel-collector.observability:4318"
            - name: OTEL_EXPORTER_OTLP_PROTOCOL
              value: "http/protobuf"
            - name: BEYLA_KUBE_METADATA_ENABLE
              value: "true"     # Auto-tag with Pod/Service metadata
            - name: BEYLA_TRACE_PRINTER
              value: "disabled"  # Disable stdout output in production
          volumeMounts:
            - name: sys-kernel
              mountPath: /sys/kernel
              readOnly: true
      volumes:
        - name: sys-kernel
          hostPath:
            path: /sys/kernel

Advanced Beyla Configuration (ConfigMap)

# beyla-config.yaml
apiVersion: v1
kind: ConfigMap
metadata:
  name: beyla-config
  namespace: observability
data:
  beyla-config.yml: |
    # Network-based auto-discovery
    discovery:
      services:
        - k8s_namespace: production
          k8s_deployment_name: ".*"
        - k8s_namespace: staging
          k8s_deployment_name: ".*"

    # RED metrics configuration
    routes:
      unmatched: heuristic    # Automatic URL pattern grouping
      patterns:
        - /api/v1/users/{id}
        - /api/v1/courses/{id}
        - /api/v1/courses/{id}/lessons/{lessonId}

    # Trace sampling (production cost savings)
    sampler:
      type: parentbased_traceidratio
      ratio: 0.1              # 10% sampling

    # Metrics export
    otel_metrics_export:
      endpoint: http://otel-collector.observability:4318
      protocol: http/protobuf
      interval: 15s

    # Traces export
    otel_traces_export:
      endpoint: http://otel-collector.observability:4318
      protocol: http/protobuf

Step 4: OpenTelemetry Collector — Unified Telemetry Hub

All telemetry collected from eBPF components is delivered to final backends through the OpenTelemetry Collector. The Collector handles data filtering, transformation, and routing, so you don’t need to change your collection infrastructure when swapping backends.

# otel-collector-config.yaml
apiVersion: v1
kind: ConfigMap
metadata:
  name: otel-collector-config
  namespace: observability
data:
  config.yaml: |
    receivers:
      otlp:
        protocols:
          grpc:
            endpoint: 0.0.0.0:4317
          http:
            endpoint: 0.0.0.0:4318

      # Hubble metrics collection (Prometheus scrape)
      prometheus:
        config:
          scrape_configs:
            - job_name: hubble
              kubernetes_sd_configs:
                - role: pod
              relabel_configs:
                - source_labels: [__meta_kubernetes_pod_label_k8s_app]
                  regex: cilium
                  action: keep

    processors:
      batch:
        timeout: 10s
        send_batch_size: 1024
      memory_limiter:
        check_interval: 5s
        limit_mib: 512
        spike_limit_mib: 128
      k8sattributes:
        extract:
          metadata:
            - k8s.namespace.name
            - k8s.deployment.name
            - k8s.pod.name
            - k8s.node.name
        pod_association:
          - sources:
              - from: resource_attribute
                name: k8s.pod.ip

    exporters:
      # Prometheus (metrics)
      prometheusremotewrite:
        endpoint: "http://mimir.observability:9009/api/v1/push"
        tls:
          insecure: true
      # Tempo (traces)
      otlp/tempo:
        endpoint: "tempo.observability:4317"
        tls:
          insecure: true
      # Loki (logs)
      loki:
        endpoint: "http://loki.observability:3100/loki/api/v1/push"

    service:
      pipelines:
        traces:
          receivers: [otlp]
          processors: [memory_limiter, k8sattributes, batch]
          exporters: [otlp/tempo]
        metrics:
          receivers: [otlp, prometheus]
          processors: [memory_limiter, k8sattributes, batch]
          exporters: [prometheusremotewrite]
        logs:
          receivers: [otlp]
          processors: [memory_limiter, batch]
          exporters: [loki]

Troubleshooting: Common Issues and Solutions

Issue 1: eBPF Program Loading Failure

The most common issue is eBPF program loading failure due to kernel version or security settings.

# Symptom: Beyla/Tetragon Pod in CrashLoopBackOff
# Diagnose the cause
kubectl logs -n kube-system ds/tetragon -c tetragon | grep -i "bpf|error|failed"

# Check kernel BTF (BPF Type Format) support
ls /sys/kernel/btf/vmlinux
# If file doesn't exist -> BTF not supported -> Kernel upgrade needed

# Check eBPF capabilities
bpftool feature probe kernel | grep -E "map_type|prog_type|attach_type"

# Fix: Upgrade node kernel (EKS example)
# Change managed node group AMI to Amazon Linux 2023
aws eks update-nodegroup-config 
  --cluster-name my-cluster 
  --nodegroup-name my-nodegroup 
  --launch-template name=my-template,version=2   # Use AL2023 AMI

Issue 2: Hubble Metrics Not Appearing in Prometheus

# Check Hubble metrics activation status
cilium config view | grep hubble

# Verify Hubble relay is healthy
cilium hubble port-forward &
hubble status

# Check Prometheus ServiceMonitor
kubectl get servicemonitor -n monitoring -l app=cilium

# Manually test metrics endpoint
kubectl exec -n kube-system ds/cilium -- 
  curl -s http://localhost:9965/metrics | head -20

# Fix: Explicitly enable Prometheus integration in Helm values
helm upgrade cilium cilium/cilium -n kube-system 
  --set hubble.metrics.enableOpenMetrics=true 
  --set prometheus.enabled=true 
  --set prometheus.serviceMonitor.enabled=true

Issue 3: Beyla Not Capturing Traffic for Specific Services

# Check Beyla discovery logs
kubectl logs -n observability ds/beyla | grep -i "discover|instrument"

# Problem: TLS traffic cannot be decrypted by default
# Fix: Enable uprobe for SSL libraries (Go/Node.js, etc.)
# Add to beyla-config.yml:
#   ssl:
#     enabled: true

# Problem: Service using non-standard ports
# Fix: Add the ports to BEYLA_OPEN_PORT environment variable
kubectl set env ds/beyla -n observability 
  BEYLA_OPEN_PORT="80,443,3000,5432,6379,8080,8443,9090,27017"

Conclusion: eBPF Stack Adoption Roadmap

The eBPF-based observability and security stack is no longer experimental technology in 2026. With Splunk officially announcing the OBI beta at KubeCon EU 2026 and Grafana Beyla being donated to the OpenTelemetry project, vendor-neutral standardization is advancing rapidly.

Here’s the recommended roadmap for production adoption:

  1. Week 1-2: Verify and upgrade kernel version (6.1+). Install Cilium + Hubble on staging cluster. Migrate from existing CNI (Calico/Flannel).
  2. Week 3-4: Deploy Tetragon and apply basic TracingPolicies (sensitive file access, privilege escalation detection). Benchmark performance against Falco.
  3. Week 5-6: Deploy Beyla/OBI DaemonSet. Run in parallel with existing SDK-based instrumentation to verify data consistency. Adjust trace sampling ratio.
  4. Week 7-8: Configure OTel Collector pipeline. Build Grafana dashboards. Set up alerting rules. Gradually roll out to production.

Future Outlook: In the second half of 2026, AI-driven threat detection applying ML to Hubble network flow data is planned. Additionally, the new tetragon-python SDK will allow writing eBPF security policies in Python that transpile to bytecode. eBPF is breaking down the boundaries between observability and security, evolving into a unified kernel-level observation platform.

My AI remembered the wrong thing and broke my build. So I built memory governance.

Six weeks ago I gave my AI assistant a memory. It worked. No more re-explaining the project every session. Bugs got fixed once and stayed fixed.

Then it followed a rule from January that I’d overridden in February, and the audio in my video sounded like a robot reading through a tin can.

The old rule said “always apply loudnorm to voice audio.” The new rule said “never do that — it lifts the noise floor.” Both were in memory. Both active. Both ranked the same. The agent grabbed the wrong one and I didn’t catch it until I listened to the export.

330 memories, no idea which ones were still valid

I build YouTube Shorts with my AI assistant. Daily production — voice generation, image prompting, FFmpeg assembly, captions, upload. Over two months, the memory database grew to 330 entries. Bugs, fixes, decisions, settings, voice profiles, pipeline steps.

Some of those entries were battle-tested rules that saved me hours every week. Some were from the first week, when I was still figuring things out, and they were just wrong. The database treated them all the same. No status. No history. No way to tell what was current.

I looked at Mem0, Letta, Mengram. Good at storing and retrieving. None of them answer “is this memory still true, or did something else in this database already replace it?”

Lifecycle states

Every memory now gets a status:

hypothesis  →  active  →  validated
                          deprecated  •  superseded

New observations start as hypothesis. They get promoted when confirmed. They get deprecated when disproven. If a new rule replaces an old one, the old one is marked superseded and points to the replacement.

Deprecated and superseded memories don’t show up in search. The agent only sees current truth.

from agentmem import Memory

mem = Memory()

mem.add(type="decision", title="Never apply loudnorm to voice",
        content="Lifts noise floor. Use per-track volume instead.",
        status="validated")

# Kill the old wrong rule
mem.deprecate(old_rule_id, reason="Causes robotic audio")

# Agent now only sees the correct rule
context = mem.recall("audio processing", max_tokens=2000)

That alone would have prevented the tin-can incident.

1,848 conflicts (then 7)

I ran conflict detection on the full production database.

from agentmem import detect_conflicts

conflicts = detect_conflicts(mem._conn)

First run: 1,848. Matching any two memories that share a few words and contain “never” somewhere is not precise. After tuning — requiring 25% topic overlap and sentence-level negation matching instead of whole-document scanning — it found 7.

All real. Duplicate entries from two different sync runs. A bug stored once as a “decision” and once as a “bug.” Two session snapshots that were never properly superseded. The kind of thing that sits quietly in your database and degrades trust so slowly you don’t notice until your agent does something wrong and you can’t explain why.

Staleness

Every memory now tracks where it came from — the source file, the section heading, and a hash of the content at import time. If the source file changes, the memory is flagged stale.

from agentmem import detect_stale

stale = detect_stale(mem._conn, stale_days=14)
# [decision] "Use atempo 0.90" — Source changed since import (hash mismatch)

I had memories referencing files that had been renamed weeks ago. Rules updated in the markdown source but never re-synced to the database. Without provenance tracking, I’d have never known.

Health score

One number. Can I trust what my agent knows right now.

$ agentmem health

Memory Health: 85/100
Total: 226
By status: validated: 14, active: 198, hypothesis: 12, deprecated: 2
Conflicts: 1
Stale: 3

Penalises conflicts, stale entries, orphaned supersedes, having zero validated memories. If you never explicitly confirm anything, the score reflects that. My production database started at 55.

65 videos later

Before governance: 330 memories, all “active,” 7 hidden contradictions, 104 duplicates. The agent sometimes followed outdated rules. I’d catch it in QA or I wouldn’t.

After: 226 active, 104 properly superseded, contradictions surfaced and resolved. Recall prioritises validated canonical rules over unprovenanced imports.

65 videos built since the governance engine went live. Zero repeated production bugs.

The database isn’t bigger. It’s cleaner. And the agent makes fewer mistakes because what it retrieves is actually right.

Install

pip install quilmem

Open source, local-first, no API keys, no cloud. SQLite underneath. Ships with a CLI, a Python API, and an MCP server with 13 tools that works with Claude Code, Cursor, and Codex.

The governance stuff — lifecycle states, conflict detection, staleness, health scoring, provenance tracking — is all in the free core.

GitHub / Landing page / PyPI

Turn Your Home Server into a NAS — Access Files from Any Device with Samba

In Part 2, we set up Nextcloud with Docker — your own Google Drive with phone auto-backup and desktop sync. That handles cloud-style access perfectly.

But sometimes you just want to drag files into a folder. No browser, no app, no sync client — just open Finder on your Mac (or File Explorer on Windows), and there’s your server, looking like any other drive.

That’s what Samba does. It turns your home server into a NAS (Network Attached Storage) that any device on your network can access natively.

What you’ll have after this guide:

  • Your server’s folders visible in Mac Finder / Windows File Explorer
  • Drag-and-drop file transfer at full network speed
  • Auto-mount on startup so the drive is always there
  • Nextcloud and Samba sharing the same storage — files added via either method are visible in both
  • Remote NAS access via Tailscale (set up in Part 4)

Let’s set it up.

How Samba and Nextcloud work together

This is important to understand before we start. Both Nextcloud and Samba will point to the same storage directory (/srv/nas). This means:

  • Upload a photo via Nextcloud’s web interface → it appears in Samba immediately
  • Drop a video into the Samba share from your Mac → Nextcloud can see it after a quick scan

They’re two doors into the same room. Nextcloud gives you the cloud experience (browser, apps, sharing links). Samba gives you the local network experience (Finder, drag-and-drop, raw speed).

💡 When you add files via Samba, Nextcloud won’t detect them automatically. You’ll need to run a quick scan command. I’ll cover this at the end.

Step 1: Install Samba

SSH into your server and install Samba:

sudo apt install samba -y

Verify it’s installed:

smbd --version

You should see something like Version 4.x.x. Samba is now installed but not configured yet.

Step 2: Create a Samba password

Samba uses its own password system, separate from your Linux login. Create a Samba password for your user:

sudo smbpasswd -a your-username

Replace your-username with your actual Linux username. It’ll ask you to set a password — this is what you’ll enter when connecting from your Mac or PC. It can be different from your Linux password.

Step 3: Configure Samba shares

Open the Samba config file:

sudo nano /etc/samba/smb.conf

Scroll to the bottom and add your shared folders:

[NAS]
   path = /srv/nas
   browseable = yes
   read only = no
   valid users = your-username
   create mask = 0644
   directory mask = 0755
   force user = www-data
   force group = www-data

[Photos]
   path = /srv/nas/photos
   browseable = yes
   read only = no
   valid users = your-username
   create mask = 0644
   directory mask = 0755
   force user = www-data
   force group = www-data

[Videos]
   path = /srv/nas/videos
   browseable = yes
   read only = no
   valid users = your-username
   create mask = 0644
   directory mask = 0755
   force user = www-data
   force group = www-data

Let me explain the key settings:

  • path — the directory to share
  • browseable = yes — makes it visible when browsing the network
  • read only = no — allows writing (uploading files)
  • valid users — only this user can access the share
  • force user / force group = www-data — this is critical. Nextcloud runs as www-data, so any file created via Samba must also be owned by www-data. Without this, Nextcloud can’t read files you add through Samba.

Save and exit (Ctrl+X, then Y, then Enter).

Step 4: Set permissions

Make sure the storage directory has the right ownership:

sudo chown -R www-data:www-data /srv/nas
sudo chmod -R 775 /srv/nas

This ensures both Nextcloud (running as www-data) and Samba can read and write to the same files without permission conflicts.

Step 5: Restart Samba

sudo systemctl restart smbd
sudo systemctl enable smbd

The enable command ensures Samba starts automatically after reboots.

Verify it’s running:

sudo systemctl status smbd

You should see active (running) in green.

Step 6: Open firewall ports

If you’re running UFW (which you should be — we’ll set it up properly in Part 5), allow Samba traffic:

sudo ufw allow 137/udp
sudo ufw allow 138/udp
sudo ufw allow 139/tcp
sudo ufw allow 445/tcp

These are the standard ports Samba uses for NetBIOS and file sharing.

Step 7: Connect from Mac

  1. Open Finder
  2. Press Cmd+K (or click Go → Connect to Server)
  3. Type: smb://192.168.1.100 (replace with your server’s IP)
  4. Click Connect
  5. Select Registered User
  6. Enter your username and the Samba password you created in Step 2
  7. Select which shares to mount: NAS, Photos, Videos
  8. Click OK

Your server’s folders now appear in the Finder sidebar under “Locations.” You can drag files in, open them directly, and treat it exactly like a USB drive — except it’s over your network.

Auto-mount on Mac startup

So you don’t have to reconnect every time:

  1. Connect to the NAS using the steps above
  2. Go to System Settings → General → Login Items
  3. Click + under “Open at Login”
  4. Navigate to Network → your server IP → select the NAS folder
  5. The drive now mounts automatically every time your Mac starts

Step 8: Connect from Windows

  1. Open File Explorer
  2. Click the address bar at the top
  3. Type: \192.168.1.100 (backslashes, not forward slashes)
  4. Press Enter
  5. Enter your username and Samba password
  6. Check “Remember my credentials” if you want auto-login
  7. Your shares appear as network folders

Map as a network drive (auto-mount):

  1. Right-click on the share folder
  2. Click Map network drive
  3. Choose a drive letter (e.g., Z:)
  4. Check Reconnect at sign-in
  5. Click Finish

Your server now shows up as Drive Z: in File Explorer, permanently.

Step 9: Sync Samba files with Nextcloud

When you add files through Samba (drag-and-drop from Mac/PC), Nextcloud doesn’t know about them yet. You need to tell Nextcloud to scan for new files:

docker exec -u www-data nextcloud php occ files:scan --all

This scans the entire storage directory and adds any new files to Nextcloud’s index. Takes a few seconds for small changes, longer for thousands of files.

Make it automatic

If you’re regularly adding files via Samba, set up a cron job to scan every 15 minutes:

crontab -e

Add this line:

*/15 * * * * docker exec -u www-data nextcloud php occ files:scan --all > /dev/null 2>&1

Now Nextcloud automatically picks up any files you add through Samba within 15 minutes.

Step 10: Bulk transfer — the fastest way to load your server

If you have hundreds of gigabytes of photos and videos to move onto your server, Samba is by far the fastest method. Here’s the recommended approach:

  1. Connect via Samba from your Mac or PC (Steps 7 or 8)
  2. Drag and drop your files into the appropriate folders (photos → Photos, videos → Videos)
  3. Wait for transfer to complete — local network transfers are fast, typically 50-100 MB/s over WiFi, faster over Ethernet
  4. Run the Nextcloud scan once the transfer is done:
docker exec -u www-data nextcloud php occ files:scan --all

This is much faster than uploading through Nextcloud’s web interface, which has overhead from HTTP and PHP processing.

💡 Transferring a large collection? Use an Ethernet cable for the transfer if possible — you’ll see 2-3x faster speeds compared to WiFi. A Cat 6 Ethernet cable costs practically nothing and makes a big difference for bulk transfers.

Troubleshooting

Can’t see the server in Finder/File Explorer?

  • Make sure you’re on the same WiFi network as the server
  • Try connecting directly via IP: smb://192.168.1.100 (Mac) or \192.168.1.100 (Windows)
  • Check Samba is running: sudo systemctl status smbd

“Permission denied” when writing files?

  • Check ownership: ls -la /srv/nas/ — files should be owned by www-data
  • Fix permissions: sudo chown -R www-data:www-data /srv/nas
  • Make sure your smb.conf has force user = www-data

Files added via Samba not showing in Nextcloud?

  • Run the scan: docker exec -u www-data nextcloud php occ files:scan --all
  • Or wait for the cron job if you set one up

Connection drops after Mac sleep?

  • This is normal. The Mac disconnects SMB shares when it sleeps. It should auto-reconnect when it wakes up if you set up auto-mount (Step 7). If not, just press Cmd+K and reconnect.

Slow transfer speeds?

  • Switch to a wired connection. WiFi has overhead and interference. An Ethernet connection will give you significantly faster and more reliable transfers.

What you should have now

After following this guide:

✅ Samba installed and configured with NAS, Photos, and Videos shares
✅ Mac or Windows PC sees your server as a network drive
✅ Drag-and-drop file transfer at full network speed
✅ Auto-mount on startup so the drive is always there
✅ Nextcloud synced with Samba via manual scan or cron job
✅ A complete NAS setup using hardware you already own

Between Nextcloud (Part 2) and Samba (this guide), you now have two ways to access your files:

Method Best for Speed
Nextcloud (browser/app) Remote access, phone backup, sharing links Good
Samba (Finder/Explorer) Bulk transfers, local file access, drag-and-drop Fast

Use both. They complement each other perfectly.

What’s next

Right now, everything works on your home network. But what about when you’re not home?

🌐 Part 4: Access your server from anywhere — Set up Tailscale for private encrypted access, get an Oracle Free VPS, configure frp tunneling to bypass CGNAT, set up Nginx and SSL, and point your custom domain to your home server. After Part 4, you’ll access your NAS from anywhere in the world.

🔒 Part 5: Security hardening + lessons learned — UFW firewall, Fail2Ban, SSH hardening, monitoring, and everything I wish I’d known before starting.

All config files from this series are available in the companion GitHub repo:
👉 github.com/sasrath/homecloud

Hit Follow if you don’t want to miss Part 4 — that’s the one where everything comes together. Drop a comment if you hit any issues with the Samba setup.

Your server is now a NAS. Next up: accessing it from anywhere in the world. 🌐

Discord Open Sources Osprey Safety Rules Engine Processing 2.3 Million Rules per Second

Model Context Protocol MCP hero banner — dark tech network hub connecting AI agents to databases, APIs and tools

Discord open-sourced Osprey, a safety rules engine processing 400 million daily actions and 2.3 million rules per second. Osprey uses a polyglot architecture: a Rust coordinator manages traffic, while stateless Python workers execute logic using a Python-based domain-specific language called SML. This design allows trust and safety teams to deploy real-time threat mitigations at high scale.

By Patrick Farry

Cumhurbaşkanı Erdoğan, 5G İletişim Törenine Katılacak

Cumhurbaşkanı Recep Tayyip Erdoğan, 5G teknolojilerinin tanıtım yapılacağı ‘5G ile İletişimde Güçlü Türkiye Töreni’ne katılacak. Tören, Cumhurbaşkanlığı Külliyesi’nde gerçekleştirilecek ve saat 14.30’da başlayacak. Bu etkinlik, Türkiye’nin iletişim altyapısını güçlendirme ve dijital dönüşüm hedeflerine yönelik önemli bir adım olarak değerlendiriliyor.

Yapay zeka “Suçlu” dedi, hayatı karardı

ABD’nin Tennessee eyaletinde yaşayan 50 yaşındaki Angela Lipps, yapay zeka tabanlı yüz tanıma sisteminin hatalı eşleşmesi sonucu, hiç gitmediği bir eyalette işlenen suçtan dolayı 108 gün boyunca hapis yattı. Mart 2026 itibarıyla hukuk mücadelesi başlatan Lipps’in, emniyet birimlerinin teknolojiye “aşırı güveni” ve “ihmali” nedeniyle evini, işini ve sağlığını kaybettiği ortaya çıktı.

🖥️ Weekend Project: A CLI to Manage Multi-Monitor Layouts on Windows

This weekend I built a small tool to solve a very real (and annoying) problem…

I’ve been working with 4 monitors for a while now. My setup includes an ultrawide monitor as primary when I work, but, when I want play videogames I preffer use a 24″ monitor (when isn’t a simrace game), so, here are two cases were I need change my screens layout.

Every time I move between those setups, I have to manually rearrange monitors in Windows.

Doing that repeatedly? Not fun 😅, some times I do that 3 times peer day 🫠.

🤔 Looking for a solution

I tried to find an existing tool to automate monitor layouts, but nothing quite matched what I needed.

So I decided to build a simple CLI:

👉 wsm — Windows Screen Manager

A lightweight tool to save and restore monitor configurations as profiles.

⚡ What it does

The idea is simple:

  • Save your current monitor layout
  • Store it as a profile (YAML or JSON)
  • Restore it instantly with a command
wsm save work -- save current layout
wsm load game -- load saved layout

If you frequently change your screen layout, this can save you a lot of time.

wsm list
Saved profiles in ~/.wsm-profiles:
  game — 4 monitor(s)
    Display 1: GBT340A                       3440x1440 @ 60Hz  pos (-1515, -1440)  primary: false
    Display 2: BNQ78E7                       1920x1080 @ 60Hz  pos (    0,     0)  primary: true
    Display 3: BNQ78E7                       1920x1080 @ 60Hz  pos (-1928,     0)  primary: false
    Display 5: ACI1643                       1080x1920 @ 60Hz  pos ( 1925,  -916)  primary: false
  work — 4 monitor(s)
    Display 1: GBT340A                       3440x1440 @ 60Hz  pos (    0,     0)  primary: true
    Display 2: BNQ78E7                       1080x1920 @ 60Hz  pos ( 3440,  -562)  primary: false
    Display 3: BNQ78E7                       1920x1080 @ 60Hz  pos (-1920,   350)  primary: false
    Display 5: ACI1643                       1080x1920 @ 60Hz  pos ( 4520,  -552)  primary: false

📦 How it works

Under the hood, the CLI:

  • Reads all active monitors
  • Captures:
  • resolution
  • refresh rate
  • position in virtual desktop
  • primary display
  • orientation
  • Stores everything in ~/.wsm-profiles

Example YAML:

profiles:
  office:
    monitors:
      - device_name: '\.DISPLAY1'
        friendly_name: 'Display 1: GS34WQCA'
        position_x: 0
        position_y: 0
        width: 3440
        height: 1440
        refresh_rate: 144
        bits_per_pel: 32
        orientation: 0
        is_primary: true
      - device_name: '\.DISPLAY2'
        friendly_name: 'Display 2: P2419H'
        position_x: 3440
        position_y: 180
        width: 1920
        height: 1080
        refresh_rate: 60
        bits_per_pel: 32
        orientation: 0
        is_primary: false

🧠 Atomic configuration changes

One important detail: applying layouts is done atomically.

Instead of changing monitors one by one (which can cause flickering or broken states), the tool:

  • stages all changes using Windows APIs
  • commits them in a single operation

This avoids intermediate invalid configurations.

Also:

  • The primary display is always staged first
  • Missing/disconnected monitors are handled gracefully

🧪 Built with AI

I built this using Claude, and had a working version in under an hour.

That said, it wasn’t just “generate and done”:

  • There were bugs
  • Edge cases around Windows APIs
  • Iterations to get things stable

The AI helped a lot, but I still had to guide it and understand what was going on.

📈 Iterating on the idea

The first version was pretty basic:

  • JSON files
  • One file per configuration

Then I improved it:

  • YAML as default (more readable)
  • Profiles instead of separate files
  • Still supports JSON if needed

🎛️ Stream Deck integration

Running commands is fine… but I wanted something faster.

So I built a plugin for the Elgato Stream Deck, this can run anny command on powershell or cmd.

Now I can switch my entire setup with a single button press.

🧠 A reminder about AI

I’ve been in software development for about 10 years.

Back then, the advice was:

“It’s fine to copy from Stack Overflow… but understand what you’re copying.”

That still applies today.

AI is powerful, but:

  • It makes mistakes
  • It hallucinates
  • It doesn’t replace understanding

If something breaks, you still need to know how to fix it.

🚀 Try it out

If you’re on Windows and frequently change your monitor layout, this might be useful:

👉 https://github.com/OsirisFrik/windows-screen-manager

Data-Driven Architecture

1360_LinuxExceptionTwo/image1.png

The layering problem

Applications often have many layers, such as repositories and ORMs, due to patterns like MVVM, MVC, and the Hexagonal architecture. My main argument is that these architectural decisions, while intended for general use, often feel rigid or contextless, especially for microservices or even monorepos. The art of architecture is about composing components into systems, but this process relies heavily on context and appreciation. Patterns exist as recipes for recurring problems, but when applied without context, they can feel forced and less relevant. Examples from books rarely match your real problem, and frameworks can lock you into abstractions that don’t match your needs.

Here’s my thought: let problems find you first. If they don’t, it’s either because they don’t belong or you don’t recognize them. Reading about them isn’t enough. It’s better to try building with these patterns elsewhere—not at work—unless guided by someone more experienced. Sometimes practice is best, or even necessary, when speed matters. Frameworks exist because they embed valid patterns for specific cases. Companies offer ready-made solutions like ORMs, ERPs, or Next.js; you may use them if patterns fit. Otherwise, question and resist the urge to apply patterns by default. Avoid Resume-Driven-Development traps.

Data-Driven Design

While there is literature about high-level architectural design and modules in “The Philosophy of Software Design” that I find interesting, the simplest and most effective driver I’ve found is data itself. My argument leads to a key idea: everything points toward a data-driven approach. Rather than starting with high-level abstractions, focus on your data. Shape your system by following your data and encoding it using clear, simple structures. This approach will usually simplify both design and tool selection, letting your data’s characteristics guide architecture and modeling choices to best suit your use case.

This is DDD at its core, and it also favors deep modules, as the referenced book says. Large modules should fade or be autogenerated. Focus on your domain and API simplicity, which depend on how well you encode data and its relationships. Here, DDD’s data aggregates help: when you need several objects to interact, think of them together as a unit, not just related items. This encourages simple design and cuts down race conditions, as changes to coupled parts remain atomic. Other concepts exist—better explained elsewhere—but everything comes down to business, data, or algorithm invariants. Find these invariants, then encode them. Use an automaton. If you could learn one thing in Computing Science, pick a DFA. It’s a first principle to help avoid over-engineering.

Automata and the Power of Explicit State

Finite Automata excel because they work with data and can process almost any computable input. Bugs often stem from accepting too much or omitting needed data. Protocols frequently use this concept. Though RFCs and implementations differ, starting with a DFA is wise for such problems. It’s the simplest way to define data boundaries and is nearly linear in speed. If your issue is data-related, always think it through with automation first. This clarifies your approach and shows if another data structure is needed. Don’t jump into polished solutions when starting new work, if you can avoid it.

Many think you shouldn’t build from scratch, which makes sense given today’s abundance of libraries. But if data is core to your business, treat it as seriously as outsourcing. Don’t outsource your core. Even without an MBA, I believe in this, and many smarter people agree. Books like Amazon’s “Working Backwards” or Netflix’s “Engineering Culture” strike me as well-meaning novels. Company realities are messier: every company is a ball of controlled technical chaos to keep up with business scale. To fight this, prioritize your principles as a technical lead and let business leaders handle the rest. Simplify early and check complexity with each new code addition.

Object-Oriented Pitfalls and the Relational Model Trap

Object-oriented programming’s downside is its link to the relational model. While not always true, big enterprise problems usually stem from data modeling. Academics start from relational algebra, which differs from category theory. Smalltalk’s background is separate from relational algebra, but it’s misapplied to enterprise systems. Originally, code automated processes, not fixed algorithms—this is a flawed outlook. Treat data as a first-class citizen from the start, not an afterthought. While we write in terms of behavior and output, we shouldn’t shape code solely for data or processes. It’s tricky, but embracing this shift leads to simpler code.

Final recommendations

Below are good starting points for my ideas. I have plenty of reinforcement bias, but I don’t recommend that, or linking to anything that isn’t my interpretation, since people might see things differently. A discussion forum might be better for debate than a blog post. If you’re interested, it’s better to look in books or projects rather than hearing from someone who shares your thoughts—unless it’s just for fun and entertainment, as I do.

Finally, I leave you with some extra advice, from my discussion about the subject with my today’s victim, as lately, ChatGPT or whatever other LLM kind of chat. It turns out that’s the best way to challenge my thoughts nowadays, and it’s worth it for summary or tl;dr sections if you are that kind of guy. But I put it at the end just bc of that. Although I am still looking for perfection on those ideas and principles, if you like, I’m aware that the world is complex enough and you always need to deal with physics one way or another, that means you eventually will face reality and need to talk with external systems and distributed networks, even though you only have a database and OS as a runtime. Because of that, on scale, you will need to think in other layers as well. But that’s the point, if you already have enough layers on top of your system. Why did you shoot yourself in the foot and put more inside your app?

The clean mental model (ChatGPT extracted)

Think in three layers:

  1. Domain (DDD core)
    • Strong invariants
    • Impossible invalid states
    • Explicit transitions
    • “What is allowed?”
  2. Application / workflow
    • Ordering of steps
    • Retries
    • Orchestration
    • “What happens next?”
  3. Infrastructure
    • DBs
    • Queues
    • APIs

Most bugs happen when:

  • Layer 2 logic leaks into layer 1
  • Invariants are not enforced in layer 1

Trying to cross-post here since I always wanted to give back to this community what I had learned from it. Other than that, my Substack looks pretty lonely so far. Check this out in case you found this article interesting (it will be published next week). And this may help me with early feedback to include corrections and examples there.

Crow Docs Evolving: Stability, UX, and a New Community Channel 🚀

Crow Docs Evolving: Stability, UX, and a New Community Channel 🚀
Hi everyone!

I’m dropping by to share a general update on the Crow Docs project. The focus of the latest updates was ensuring a solid foundation, fluid navigation, and—most importantly—opening a direct channel to hear from those using the tool.

For those who aren’t familiar, Crow Docs is a suite of PDF and OCR tools that runs 100% client-side, prioritizing privacy above all else (no server uploads, ever!).

🛠️ What’s New?
Interface Refinement: We’ve implemented UX improvements and optimized loading speeds for a much smoother experience. Less friction, more productivity.

Deep Bug Squashing: We did a thorough “fine-tooth comb” sweep! We fixed instabilities and minor rendering glitches that were popping up in specific browser environments.

Suggestions Box: We now have an official channel! Want a new feature or found something weird? Your feedback now has a dedicated home at the bottom of the page.

Project Support: I’ve added a section for anyone who wants to support the development and help keep the project’s infrastructure standing.

💡 Why the Community Focus?
This project is driven by real-world usage. Adding the Suggestion and Support buttons at the footer was the best way I found to turn Crow Docs into something built by many hands.

🔗 Explore it now:
If you need fast, secure, and privacy-focused PDF tools, take a look:

👉 crowdocs.com.br

What feature would you like to see in a 100% browser-based document tool? Let me know in the comments or use the new suggestion box on the site!