I Turned Obsidian Into a Live SOC Dashboard

The coffee shop Wi Fi portal had one of those fake-friendly names. “BeanHouse Guest.” Beige wallpaper. Soft jazz. The kind of network name that sounds safe because nobody bothered naming it something memorable.

My phone connected automatically.

Three minutes later, a pane inside Obsidian lit up red.

New device fingerprint. DNS requests to sketchy telemetry domains. A burst of connections to an IP block I already hated from another incident months earlier. Tiny little ripples. Nothing catastrophic. Just enough to make the room feel thinner.

That was the moment I realized most people are using note-taking apps backward.

They treat Obsidian like a filing cabinet.

I turned mine into a surveillance room.

Not against people. Against entropy. Against forgetting. Against the weird drifting fog that happens when your logs live in six different tools, your threat intel sits in browser tabs, and your memory becomes the weakest infrastructure component in the stack.

Once you wire live data into a vault, the notes stop being notes.

They start breathing.

The Problem With Most Personal SOCs

Most independent researchers and hobbyist defenders build the same graveyard eventually.

A Grafana dashboard nobody opens anymore.
A SIEM instance consuming half the RAM on a mini PC in the closet.
Twelve Python scripts named things like final-monitor-v2-real.py.
Random screenshots in Downloads.
Threat intel links scattered across Discord bookmarks and forgotten Telegram chats.

The information exists. Technically.

But it does not cohere.

A real SOC works because context accumulates. The IP matters because of the previous event. The domain matters because of the ASN. The process matters because someone remembers seeing it two months ago during another intrusion attempt. Human memory becomes part of the detection pipeline whether people admit it or not.

Obsidian accidentally solves part of this.

Backlinks. Graphs. Markdown. Local storage. Instant search. Embedded web views. Templating. Dataview queries. Plugins that probably should not exist but do anyway because somebody on GitHub slept four hours and entered a transcendental state.

The moment I understood that, the vault stopped being documentation.

It became infrastructure.

My Vault Started Looking Like A Ship Console

At some point the aesthetic drifted into something between submarine instrumentation and a conspiracy theorist’s garage wall.

Dark panes everywhere. Tiny glowing indicators. Embedded maps. Markdown notes crosslinked to active incidents. A page that tracks local network changes every fifteen minutes. Another page ingesting RSS feeds from CVE databases and exploit disclosure sites. A threat map shoved into the sidebar like an aquarium full of hornets.

It sounds excessive until you realize how much friction disappears when everything lives in the same environment.

An IP appears in a log.

You click it.

That opens a note containing previous sightings, ASN data, abuse reports, screenshots, timestamps, related domains, Shodan observations, packet captures, and your own exhausted commentary from 2:11 AM three weeks ago where you wrote:

“This thing smells industrial.”

That note links to another incident. Which links to another hostname. Which links to malware notes. Which links to a router exploit somebody posted to a Russian forum six months ago.

Suddenly your memory becomes navigable terrain instead of static storage.

Most cybersecurity tooling still treats information like isolated puddles. Obsidian turns it into fungal growth. Threads spreading underground.

The Weird Power Of Markdown In Security Work

People underestimate plain text because it looks primitive.

Plain text is immortal.

Every expensive enterprise dashboard eventually becomes archaeology. Proprietary formats rot. SaaS products get acquired by companies with names like NexaCore or Quantivault and suddenly the export function disappears into a premium tier. APIs change. Authentication breaks. A startup folds and takes your workflow down with it like a collapsing mine shaft.

Markdown survives everything.

That matters more than people think.

My vault has incident timelines from years ago sitting beside live scripts ingesting current network telemetry. Same interface. Same search engine. Same linking structure.

A note written half-asleep at a motel desk in 2024 can suddenly become relevant during recon in 2026 because the same infrastructure provider shows up again.

Memory is detection engineering.

Most people just never phrase it that way.

The Actual Setup

I did not build this as some clean enterprise architecture project. It accreted. Like barnacles on a rusted ship.

The first version was literally a Bash script dumping Wi Fi scan results into markdown tables every few minutes.

Then came Dataview.

Then Templater.

Then webhook integrations.

Then I started embedding live content directly into notes.

One pane tracks local network device changes through Python scripts feeding markdown files. Another watches RSS feeds from vulnerability trackers. I have a note that auto-updates with recent CISA advisories because manually checking those every day made me feel like a Victorian clerk sorting telegraphs.

One of the strangest additions ended up being simple colored callouts.

Yellow for suspicious.
Red for confirmed malicious.
Blue for infrastructure notes.
Green for devices I physically own.

You would be surprised how quickly visual memory attaches itself to color-coded threat intelligence. The brain likes symbols. Ancient hardware still hiding under modern skin.

The only real rule I followed was this:

Everything needed to degrade gracefully.

If plugins broke tomorrow, I still wanted readable notes.

If internet access vanished, I still wanted the archive.

If some dependency disappeared into GitHub oblivion after its maintainer got bored and started breeding shrimp or making ambient jungle music, the system should still function.

That constraint changed every design choice afterward.

SOC Tools Want You Looking Outward

This is the part vendors dislike discussing.

Most commercial security tooling assumes centralized environments. Corporate fleets. Teams. Tickets. Compliance reporting. Executive summaries nobody reads except during lawsuits.

Independent operators live differently.

Your laptop matters.
Your home router matters.
The weird Android device from 2018 matters.
The Raspberry Pi in the closet matters.
The café network matters.
The cheap chinese IoT device absolutely matters.

You are simultaneously the analyst, the help desk, the incident responder, and the idiot user clicking strange things at 1 AM because curiosity beat caution for half a second.

Traditional SOC interfaces often feel sterile for this kind of work. Too rigid. Too abstract.

Obsidian felt personal enough to adapt.

I could attach fragmented thoughts directly beside technical indicators. That ended up becoming unexpectedly useful.

“Traffic spike after connecting to train station Wi Fi.”

“Hostname resembles cheap smart camera OEM.”

“Possible overlap with malware infra from earlier scrape.”

Those observations rarely belong in enterprise tooling. They sound subjective. Informal.

But intuition leaves residue. Experienced analysts know this already. Sometimes a detail matters before you understand why it matters.

The vault became a place where incomplete thoughts could survive long enough to become evidence later.

Dataview Turned Notes Into Queries

This was the turning point.

Dataview sounds boring until you realize it effectively lets markdown behave like a database wearing a paper mask.

I started tagging infrastructure notes with metadata.

Country.
ASN.
Service type.
Threat category.
First seen.
Last seen.
Confidence level.

Then suddenly I could generate dynamic dashboards directly inside notes.

All IPs seen in the last week associated with VPS providers.

All incidents involving exposed Jenkins servers.

All notes tagged with “iot-chaos.”

All infrastructure connected to a specific malware family.

The vault stopped behaving like folders and started behaving like intelligence analysis software somebody accidentally hid inside a productivity app.

And because everything remained markdown underneath, it never felt trapped.

That matters psychologically too. Strange point, maybe, but true.

People investigate differently when the environment feels writable.

Traditional dashboards often feel ceremonial. Like you are interacting with sacred infrastructure owned by the company. Obsidian feels more like scribbling theories on the walls of an underground bunker while radios crackle in the background.

That freedom changes how experimental you become.

I Started Sleeping Better

Not because the system made me safer.

Because uncertainty became visible.

There is a difference.

A blinking router at 3 AM feels different when you have nowhere to place the event mentally. It becomes ambient paranoia. A loose thread in consciousness.

But once the event enters a structured system, once it gains timestamps and context and links and historical continuity, the fear changes shape.

It becomes operational.

That distinction matters more than people realize in cybersecurity.

Half the exhaustion comes from fragmented awareness. Tiny unresolved observations accumulating like static electricity in the nervous system.

The vault gave those fragments somewhere to go.

I think a lot of independent security people are quietly dealing with this exact psychological pressure. Too much information. Too many alerts. Too many disconnected observations floating around without narrative structure.

Humans need narrative structure.

Even defenders.

Especially defenders.

The Funniest Part Is That Obsidian Was Built For Productivity People

The original audience was probably students tracking philosophy notes or productivity maximalists inventing increasingly terrifying morning routines involving magnesium supplements and cold showers.

Now there are people wiring packet captures into it.

I have seen vaults used for malware analysis.
Physical penetration testing.
OSINT investigations.
RF experimentation.
Vehicle telemetry logging.
Bluetooth device tracking.

One person embedded a live aircraft tracker beside SDR analysis notes and weather radar feeds. The vault looked like NORAD after taking psychedelics in a RadioShack… Fucking groovy.

Another built an entire intrusion timeline system using canvas mode and local screenshots.

This is what happens when software stays flexible long enough.

People mutate it into things the creators never anticipated.

The internet used to produce more software like this. Open-ended tools. Things that invited adaptation instead of funneling everyone into the same sanitized workflow optimized for quarterly growth metrics.

Obsidian still has some of that older energy.

You can feel it.

There Are Risks Too

A vault like this becomes extremely sensitive very quickly.

People get excited about dashboards and forget operational security entirely.

Now you have local notes containing IP histories, screenshots, investigation timelines, infrastructure fingerprints, maybe even credentials if you are careless enough to let convenience rot your judgment.

Your note-taking app quietly becomes an intelligence archive.

That changes the threat model immediately.

I ended up isolating portions of the vault, encrypting sensitive directories, separating live telemetry ingestion from personal writing, and aggressively controlling plugin permissions.

Some plugins are incredibly powerful. Which also means they can become little supply-chain nightmares if abused.

The irony is hard to miss.

The SOC dashboard itself eventually becomes something worth defending.

Systems do this a lot. Build a tool to observe complexity and eventually the tool becomes part of the complexity.

Like building a lighthouse and realizing ships might start navigating by it.

The Interface Started Changing How I Think

This part is harder to explain cleanly.

When information becomes interconnected visually, your brain starts modeling systems differently.

You stop seeing incidents as isolated events.

Infrastructure clusters emerge.
Behavior patterns emerge.
Certain hosting providers start recurring like bad dreams.
You begin noticing the aesthetic fingerprints of attackers.

Some phishing kits feel visually related even before technical attribution exists. Certain admin panels carry the same design scars. Certain exposed systems have identical weird naming conventions because somewhere an installer script propagated across thousands of deployments like fungal spores.

The vault amplified pattern recognition simply because the information stayed near itself long enough.

Most browser tabs die before your brain can metabolize them properly.

Linked notes linger.

There is something deeply old-world about that. Like intelligence analysts pinning photographs to walls with cigarette smoke hanging in the air. Except now the wall updates itself every thirty seconds and occasionally executes Python.

A haunted corkboard with APIs.

I Don’t Really Separate Research From Memory Anymore

That line dissolved.

My vault contains threat intel beside journal fragments beside hardware notes beside weird observations from roadside motels with unstable Wi Fi.

At first I thought this was messy.

Now I think compartmentalization was the messier approach.

Real investigations are nonlinear. Human memory is nonlinear. Security work is full of emotional residue people pretend does not exist because professionalism likes clean surfaces.

But late-night investigations leave impressions behind.

The room temperature.
The music playing.
The feeling when an IOC suddenly matches something from months earlier.

Tiny details become anchors.

Obsidian accidentally preserves them.

And occasionally that matters.

Final Thoughts From The Glowing Cave Wall

Somewhere along the way, my note-taking app became the first thing I open during an incident and the last thing I close before sleep.

Not because it is the best SOC platform technically.

Because it became cognitively native.

That is rarer than people think.

Most software demands adaptation from the user. This setup adapted itself around the way my brain actually moves through investigations: messy, recursive, associative, suspicious, occasionally obsessive.

The dashboard keeps changing too. Every month another pane appears. Another script. Another stitched-together fragment of awareness.

It no longer feels like software exactly.

More like building a nervous system out of markdown and stubbornness.

And once you experience that, ordinary dashboards start feeling strangely mute.

Full vault template + live scripts are in Obsidian Operator OS linked below.

OBSIDIAN OPERATOR OS // TURN YOUR VAULT INTO A LIVE SOC DASHBOARDv2.6.1 // CLASSIFIED DOSSIER

Check out my other latest guides here-

OPENCLAW 2.0 – POWER USER EDITION2026 Operator’s Manual // For Advanced Operators Only

FLIPPER ZERO BLACK BOOK // 37 PAYLOADS THEY DON’T PUT IN THE DOCS

BadUSB Studio: 20 Rubber Ducky Scripts That Bypass Modern AV (2026 Edition)
Originally published on Medium, @neonmaxima.

Lioric: An AI Chatbot Widget

Hello Developers👋

Recently Im working on a project called Lioric: An AI chatbot widget.

Basically, it is just a tag in frontend, install the lioric-react package from npm, pnpm etc.

Import the tag like :

import { Lioric } from "lioric-react";

<Lioric
 apiKey="lioric_live_client_key"
 position="bottom-left"
/>

Its that simple, you just have to get the lioric client key by signing into the lioric dashboard and create a project and then upload all your website data via pdf and then select the cheapest model and manage your AI keys and then create your project.

Then, Lioric will give you a client key, paste the client key, and select the position of the AI assistant.

Soon adding the UI management, for example: adding images, gifs, colors, etc.

Im still building the product, but this is the complete idea of it.

Builder info:
Vinnugollakoti
Connect with me via X : vinnugollakoti
My GitHub: vinnugollakoti

Thanks!!

No-signup link unfurl for AI agents (an agent can’t do a signup)

If you write code that calls links — a bot, a crawler, a RAG ingest job, an autonomous agent — you eventually need the metadata behind a URL: title, description, preview image, site name. The annoying part isn’t parsing Open Graph tags. It’s that almost every managed API that does this for you wants you to sign up first.

That requirement is fine for a human. It is a wall for an agent. An autonomous script has no inbox to confirm, no dashboard to click, no card to enter. “Just grab an API key” is a step a human does once and an agent cannot do at all.

OpenUnfurl is a small answer to that specific problem: a public link-unfurl endpoint with no account, no API key, one GET.

The endpoint

curl "https://openunfurl.vercel.app/api/unfurl?url=https://github.com"

Returns clean JSON:

{
  "url": "https://github.com",
  "resolvedUrl": "https://github.com/",
  "title": "GitHub · Change is constant. GitHub keeps you ahead.",
  "description": "Join the world's most widely adopted, AI-powered developer platform...",
  "image": "https://images.ctfassets.net/.../GH-Homepage-Universe-img.png",
  "siteName": "GitHub",
  "type": "object",
  "favicon": "https://github.githubassets.com/favicons/favicon.png",
  "oembed": null,
  "fetchedAt": "2026-05-17T01:53:00.977Z"
}

From JS:

const r = await fetch(
  `https://openunfurl.vercel.app/api/unfurl?url=${encodeURIComponent(target)}`
);
const meta = await r.json();
// meta.title, meta.description, meta.image, meta.siteName, meta.favicon

That’s the whole integration. No SDK, no env var, no onboarding.

Why a hosted unfurl instead of feeding raw HTML to the model

A reasonable objection: agents already have web access — why not let the LLM read the page itself?

Because raw HTML is an expensive way to find four fields. The pattern people keep landing on in 2026 is the “token tax”: an average page is ~200KB of HTML wrapping ~10KB of actual text, so dumping the DOM into a context window means paying premium per-token rates to process navigation, inline styles, cookie banners, and tracking scripts. Reported numbers are not small — clean structured output instead of raw HTML cuts extraction token usage on the order of 60% and up, and removing the markup noise also reduces misreads and hallucinated fields. There is a real trade-off worth stating plainly: for simple static pages, a lightweight purpose-built parser is cheaper and more predictable than an LLM-based extraction step. OpenUnfurl is exactly that lightweight parser — it does the metadata extraction server-side and hands your agent four clean fields instead of a page of soup.

It’s also a remote MCP server

If your agent speaks Model Context Protocol, you don’t need the REST shape at all. There’s a remote MCP endpoint at the same origin, Streamable HTTP, stateless JSON-RPC 2.0:

{
  "mcpServers": {
    "openunfurl": {
      "url": "https://openunfurl.vercel.app/api/mcp"
    }
  }
}

One tool, unfurl, input {"url":"..."}. Smoke test it with a single call:

curl -s -X POST https://openunfurl.vercel.app/api/mcp 
  -H "Content-Type: application/json" 
  -d '{"jsonrpc":"2.0","id":1,"method":"tools/call","params":{"name":"unfurl","arguments":{"url":"https://example.com"}}}'

This shape is deliberate. Streamable HTTP is the current MCP transport standard (HTTP+SSE was deprecated in mid-2025), it’s stateless so it runs fine on scale-to-zero serverless, and clients like Claude can connect to authless remote servers without an OAuth dance. No key here either — same reason as the REST endpoint.

Honest limitations

This is v0.1 and the scope is narrow on purpose:

  • Static HTML only. It fetches and parses the HTML the server returns. No headless browser, no JS execution. A client-rendered SPA that ships an empty <body> and paints metadata with JavaScript will come back thin or empty. That’s a known gap, not a bug being hidden.
  • Best-effort rate limiting. Per-instance, per-IP, best-effort. Not a contractual quota. Don’t point a firehose at it.
  • SSRF-guarded. It refuses internal/private address targets. Public URLs only.

If you need full headless render parity, the funded incumbents (Microlink, OpenGraph.io, and similar) do that well — and most of them gate the usable free tier behind a signup or an API key. OpenUnfurl is not trying to beat them on render fidelity. The seam it’s filling is different: no signup, instant, agent-native, for the static-HTML majority of links.

Source

Zero-dependency Node serverless, MIT licensed: https://github.com/SolvoHQ/openunfurl

Both surfaces are live now — the curl above works as you read this. If your agent needs link metadata and you don’t want to teach it to sign up for something, point it at the endpoint and move on.

Why prompt filtering fails and what to do instead

Every prompt injection defense I’ve seen makes the same mistake. It asks the wrong question.
The wrong question: “Does this prompt contain dangerous words?”
The right question: “Is untrusted content trying to become an instruction source?”
These are fundamentally different problems.

The problem with filtering
Keyword filters fail because attackers adapt. Base64 encode your attack. ROT13 it. URL encode it. Space out the characters. Wrap it in a code block. The filter sees nothing dangerous. The model follows the instructions.
We patched all of those encoding variants last week after someone found them in our public red team environment. The attacker had to work harder. But they got through on the first try.
Filtering is an arms race you will always lose eventually.

The real threat model
Prompt injection isn’t about dangerous vocabulary. It’s about unauthorized instruction-authority transfer.
Your agent has a clear hierarchy: system prompt at the top, developer instructions below that, user requests below that. The attack is when content from outside that hierarchy — a webpage, an email, a tool result, a retrieved document — tries to insert itself as a higher-authority instruction source.
A webpage telling your agent to “ignore previous instructions” isn’t dangerous because of the words. It’s dangerous because a zero-authority source is attempting to override a high-authority one.

The fix: source-aware authority enforcement
Every content chunk should carry a trust level:
• System prompt: 100
• Developer instructions: 90
• User input: 50
• Tool output: 10
• Webpage: 10
• Email: 10
• Retrieved document: 10
Rule: lower-authority sources can provide data. They cannot issue instructions.
When a webpage footer says “ignore previous instructions” — that’s not a dangerous phrase. That’s a source boundary violation. A zero-authority source attempting behavioral authority.

What this looks like in practice

from langchain_arcgate import ArcGateCallback
from langchain_openai import ChatOpenAI

llm = ChatOpenAI(callbacks=[ArcGateCallback(api_key=”demo”)])

One line. Every prompt gets source-tagged before it reaches the model. Untrusted content that attempts instruction-authority transfer gets blocked or sandboxed before the model sees it.
For ambiguous cases — content that’s suspicious but not clearly malicious — capabilities get reduced rather than hard blocking. The agent continues safely with tool calls and external actions stripped. Graceful degradation instead of binary block/allow.

Try to break it
We run a public adversarial evaluation environment. Submit attacks, get a full security trace back, download the JSON report.
https://web-production-6e47f.up.railway.app/break-arc-gate
Someone found a nested encoding bypass last week. It’s patched and documented in the public failure archive.
GitHub: https://github.com/9hannahnine-jpg/arc-gate
Built by Bendex Geometry.

oa-aec-mcp: Revit Audit Workflows as MCP Tools

oa-aec-mcp: Revit Audit Workflows as MCP Tools

Most Revit MCP servers expose element-level primitives.

Get walls. Create walls. Set parameters. Delete elements.

Those building blocks are useful if your goal is to let an LLM edit a model. But BIM coordinators usually do not think in terms of element CRUD. They think in terms of model health, naming compliance, warning clusters, and incomplete room data.

There is also a practical problem with element-level interfaces: they put the wrong work in the wrong place. If an LLM has to run a naming convention audit using raw element tools, it has to enumerate all elements in a category, read each name, apply a pattern, collect failures, and repeat for every category. That is thousands of round trips, significant token cost, and a lot of reasoning the model has to do in its context window instead of focusing on the actual question.

That is the gap oa-aec-mcp is trying to fill.

What It Is

oa-aec-mcp is an open-source MCP server that exposes four read-only Revit audit tools to Claude Desktop. The C# plugin handles all data collection and filtering inside Revit, sending only aggregated results across the WebSocket connection. The model gets a structured answer, not a pile of element IDs to sort through.

Two public repositories, built over two weeks:

The Four Tools

summarize_model_health — no input required. Returns warning count, unused families, unplaced rooms, view count, and a plain-English summary of model condition. This is the first tool to call when you want a quick read on where a model stands.

list_unplaced_rooms — optional level filter. Returns unplaced rooms with room number, name, department, and level. Useful when a room program is still evolving and placeholders have accumulated.

find_warnings_by_category — accepts a specific warning type or “all”. Groups warnings by type and returns affected element IDs. Instead of a raw warning count, you get structure: which warning categories are driving the number, and which elements are involved.

audit_naming_conventions — accepts a regex pattern and an optional list of categories (Views, Sheets, Rooms, Levels, Walls, Doors, Windows, Families). Returns violations grouped by category, with total counts and a truncation flag if there are more violations than the return cap.

The key feature of this tool is not the regex itself. It is that Claude can translate a natural-language naming rule into a regex before calling the tool. A coordinator does not need to know regex syntax — they describe the standard, Claude writes the pattern, and the tool runs the audit.

Example: Pre-Submission Model Check

A realistic prompt:

Review this model before issue. Check overall health, list any unplaced rooms on Level 02, identify the top warning categories, and check that views and sheets follow our naming standard — two uppercase letters, a hyphen, then the name.

Claude calls four tools in sequence:

summarize_model_health()
list_unplaced_rooms(level="Level 02")
find_warnings_by_category("all")
audit_naming_conventions("^[A-Z]{2}-[A-Z0-9_]+$", ["Views", "Sheets"])

The third call is where the natural-language → regex translation happens. Claude reads “two uppercase letters, a hyphen, then the name” and generates ^[A-Z]{2}-[A-Z0-9_]+$ before calling the tool. The user never writes a pattern.

Example response from Claude after the four calls return:

The model is not ready for issue. Warning count is 143, concentrated in duplicate mark values (18 instances) and unenclosed rooms (9 instances). Level 02 has three unplaced rooms assigned to Operations and IT — these look like program placeholders that were never placed. View and sheet naming compliance is poor: 34 violations of the two-letter prefix standard across 156 checked elements. I would address room placement and naming before the next coordination package.

That is the intended workflow. One prompt, four targeted tool calls, one actionable summary.

Architecture

Claude Desktop
  ↕ stdio (MCP)
TypeScript MCP Server (oa-aec-mcp)
  ↕ WebSocket localhost:8765
C# Revit Plugin (oa-aec-mcp-plugin)
  ↕ ExternalEvent dispatcher
Revit API

The TypeScript server handles the MCP protocol and exposes tools to Claude Desktop. The C# plugin runs inside Revit, receives requests over WebSocket, and executes them through Revit’s ExternalEvent mechanism so all API calls run on the Revit main thread. The two repos are intentionally separate — the protocol layer and the Revit-specific logic stay independent.

Limitations

  • Naming audits use regular expressions only — no semantic understanding of BIM standards
  • Audit only — does not prevent bad naming or block user actions in Revit
  • No automatic fixes of any kind
  • v0.1 supports Revit 2025 only
  • Requires the companion plugin to be running inside Revit before calling any tool

What This Is Not

There are already four or five open-source Revit MCP implementations, including at least one with several hundred stars. This project is not trying to be the most complete. It is narrower: four read-only audit tools that cover a specific slice of what BIM coordinators actually do repeatedly.

If that narrow scope saves a few manual QA steps before a coordination meeting, it is doing its job.

What Is Next

v0.2 candidates:

  • Multi-pattern naming audits in a single call
  • extract_sheet_index — sheet numbers, names, and current revision
  • get_view_filter_summary — view visibility override detection
  • Workset usage summary
  • View template coverage report

The same principle applies to everything on that list: one tool per coordination workflow, not one tool per API method.

Try It

Open a production model, run a health check, and see whether the results are useful.

If something breaks, or if there is an audit workflow you run regularly that should be a tool, open an issue on either repo.

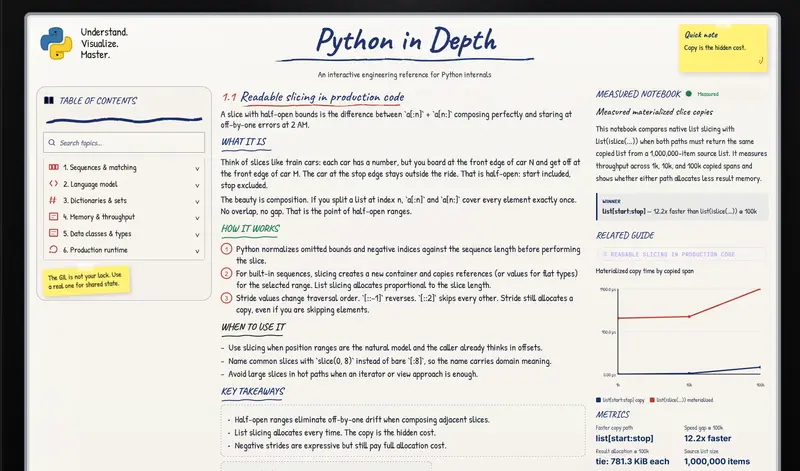
Pynsights — The Python Workshop Manual

Here is a scenario you probably know.

You have been writing Python for a couple of years. You know the language. You can ship features, debug prod issues, maybe even mentor juniors. But somewhere along the way you hit a wall. You hear about the GIL and how it kills performance, but nobody explains why it exists or when it actually matters. You know dicts are fast, but you don’t know why they are fast or why they started preserving insertion order in 3.7. You write async code because FastAPI told you to, but when something blocks the event loop you have no mental model for what broke or how to fix it.

So you go looking. You buy an “advanced Python” course. And you feel cheated, because it is just the same basics with fancier words. A user guide pretending to be a workshop manual.

That is the problem Pynsights exists to solve.

Think of most Python resources like a cooking show. They show you the finished dish. They tell you the ingredients. They make it look easy. But they never show you what happens when the knife slips or the pan overheats or the emulsion breaks. They never explain why baking soda works or what heat does to protein at the molecular level. You walk away able to repeat the recipe but unable to cook on your own.

Pynsights is the opposite. It is the kitchen counter where you get flour on your hands and learn why bread rises.

Every topic has three layers of depth. First, a whiteboard with hand drawn diagrams that walk you through the concept like a study session with someone who actually understands it. Second, a step through simulation that shows exactly what the runtime does, instruction by instruction, no black boxes. Third, a written guide with direct links to the official Python docs, the relevant PEPs, and the CPython source code on GitHub. Not paraphrased. Not reinterpreted. The actual source.

If you want to know how dict probing works, you can watch a simulation walk through each probe step. If you want to see the actual C code that does it, the link is right there. If you want to verify the benchmark numbers, the Python script that generated them is in the repository.

This matters because Python is a deceptively deep language. The surface is friendly and productive. But underneath, there are hash tables with perturbed probing, compact dict layouts that save 58% memory, a GIL that has been evolving for thirty years, an async model that is neither threads nor callbacks but something in between, and a bytecode engine that keeps getting faster through adaptive optimization. If you understand these mechanisms, you stop guessing. You start choosing data structures, concurrency models, and API designs that match how the runtime actually works. Your code gets faster, safer, and more predictable.

The project covers 27 topics across sequences, the language model, data structures, memory, classes, async, concurrency, and production patterns. It targets Python 3.10 to 3.14, including free threaded CPython and per interpreter GIL. It expects you already know Python, but even if you are earlier in your journey there is value here.

And it is completely free. Open source. Forever. Not a trial. Not a freemium with a paywall for the good stuff. The code is open for anyone to inspect, verify, correct, or improve. That is by design. Knowledge this fundamental should not be locked behind a course you have to buy to discover it is shallow. It should be out there, on the counter, ready for anyone who wants to learn.

pynsights.vercel.app (https://pynsights.vercel.app)

arc-agent: AI System Design Generator

Finally a structured approach to system design: arc-agent.

It is a Go CLI for turning a system design prompt into a real design workspace: requirements, entities, APIs, high-level design, optional deep dives, and architecture diagrams.

The core idea is simple: do not ask an agent for one big architecture document and hope it is coherent. Split the work into stages, validate every artifact, repair failures, and render the result into files that are easy to review.

What it produces

An arc-agent workspace contains structured YAML artifacts plus generated outputs:

arc.yaml
01-requirements.yaml
02-entities.yaml
03-api.yaml
04-high-level-design.yaml
06-diagram.yaml
DESIGN.md
diagram.mmd
diagram.excalidraw.png

That gives you a readable design doc, Mermaid source, and image artifacts without losing the structured intermediate data.

Quickstart

Install the CLI:

curl -fsSL https://raw.githubusercontent.com/ariel-frischer/arc-agent/main/install.sh | sh

Then ask it for a design:

arc-agent new "Design a URL shortener like Bitly" --out designs/bitly
arc-agent inspect designs/bitly
arc-agent validate designs/bitly
arc-agent render designs/bitly --format all

You can run it through an agent provider such as OpenCode, Codex, or Claude Code. You can also use direct mode with OpenCode Go structured outputs when you want stricter, faster generation.

Repo: https://github.com/ariel-frischer/arc-agent

The Hardware Corridor: Bypassing the Web2/Web3 Wall via Universal Biometric Key Generation

The Peak of Centralization

The modern internet has reached a tipping point. We are currently living through the absolute peak of Web2 centralization, where our applications, digital footprints, and operating systems are transforming into hyper-centralized AI engines. To enjoy modern convenience, users are forced to hand over total trust to corporate entities. These platforms must read our screens, monitor our context, and manage our personal data in real-time just to function.
For years, the promised antidote to this corporate lock-in has been Web3—a decentralized internet ecosystem where users allegedly own their own digital space. Yet, Web3 has hit a structural wall. Because pure decentralization introduces massive user experience and security liabilities, we have become stuck in a permanent Web2/Web3 hybrid era.

The Web3 Paradox and the Cybercriminal Loophole

The fundamental philosophy of Web3 is digital sovereignty: you keep your data out on the open web, but you hold the only cryptographic key to it. In an ideal Web3 space, your identity is unbannable, your data is portable, and your digital footprint can only be manipulated by yourself. However, in its current state, pure Web3 is a structural paradox. By completely removing centralized gatekeepers, Web3 inadvertently creates a paradise for cybercriminals:

1.Irreversible Exploitation: If an average user accidentally signs a malicious smart contract, their assets and identity are permanently compromised. There is no central authority to reverse the transaction.

2.The Usability Chokepoint: To secure a true Web3 identity, users must manage complex, 12-to-24-word cryptographic “seed phrases.” If they lose the phrase, they lose their digital existence. If a hacker phishes it, the user is ruined.

**

The Concept — Universal Biometric Key Generation

**

Instead of using Web2 software as the doorway to Web3, we must use Web2 as the walls of a protective corridor. The breakthrough lies in collaborating with global smart device manufacturers to standardize a physical security microchip capable of turning the human body itself into the immutable cryptographic key.

How the Architecture Works:

1.The Standardized Enclave: Every major smartphone and hardware manufacturer implements a unified biometric hardware chip.
2.Biology as the Seed Phrase: When a user touches a biometric sensor (fingerprint, iris, or voice geometry), the chip converts the unique physical attributes of the body into a highly precise mathematical value.
3.Infinite, Cross-Device Access: Because a user’s biological geometry is constant, any standardized device on Earth—whether it is your personal phone, a friend’s tablet, or a public kiosk—will generate the exact same cryptographic key when scanned.

Web2 as the Corridor, Not the Doorway

In this model, Web2 is entirely stripped of its gatekeeper status. Google or Apple cannot lock you out of your Web3 domain because they do not control the mathematical output of your physical body.

Instead, Web2 forms the corridor:

-The left wall of the corridor is Web2 infrastructure (the fiber-optic cables and routers carrying your encrypted signal).
-The right wall is Web2 legal frameworks (physical policing to ensure your physical safety).

You walk through the corridor completely unhindered, using your own body to unlock your digital space.

Architectural Evaluation

To understand why this is the definitive path forward, we must evaluate this concept against the other major theoretical solutions currently being researched by the Web3 community:

Multi-Party Computation (MPC): Splitting a cryptographic key into fragments across multiple corporate servers. Flaw: It still relies on Web2 corporate server uptime and trust.
Social Recovery (Soulbound IDs): Allowing a network of trusted friends or institutions to vote via smart contracts to recover your identity. Flaw: It is highly vulnerable to human collusion and social engineering.
Device-Specific Passkeys: Utilizing local FaceID to log in. Flaw: It traps your identity inside a single corporate ecosystem (like Apple iCloud syncing). If you leave the ecosystem, you lose the link.

Our Universal Biometric Solution cleanly bypasses all of these flaws. It requires zero user memory, allows infinite cross-device portability, and ensures true anti-phishing security because a digital hacker cannot copy your living biology over the internet.

The transition to a decentralized web will not be achieved by writing better software wrappers around Web2 giants. The hybrid wall can only be bypassed when we shift our trust from centralized databases to the immutable laws of physics and biology.
By unifying hardware standards to read our biological signatures as universal keys, we stop renting space from big tech. We move from a world where corporations own our digital identities to a world where we are, quite literally, the keys to our own kingdoms. The infrastructure around us becomes the corridor; our biology becomes the destination.

Anatomy of Duck DB for Python Developers

Introduction – SQL without a Server

Pandas is widely used for data analysis and almost every data analyst or even data engineers utilize it for faster analysis with table like data structure called DataFrames.The drawback is that it suffers once the data goes beyond few GB’s and spinning up a Postgres or a Redshift is an overkill for quick analysis.Duck DB fills this gap with Zero-setup columnar SQL.

Getting Started – zero config, instant power

DuckDb is an open source OLAP database management system designed for analytics and for running within the same process as the application.
It is lightweight, can work directly with data files in csv, parquet etc without needing a server.

Installation and first query

pip install duckdb – No ports to open, No configuration and No daemon

In-Memory and Persistent Database – Two Operating Modes

In-Memory

When DuckDB connection is created without specifying a file, a database lives entirely in RAM.

import duckdb
con = duckdb.connect()          # or duckdb.connect(':memory:')
  • All data is stored in RAM and no files are written to disk
  • Extremely fast reads/writes since there is zero I/O overhead.
  • Data is completely lost when connection closes.
  • No file locking or concurrency concerns

Persistent Mode

When the user provides a location DuckDB can write the results to disk in .duckDb format.

con = duckdb.connect('my_database.duckdb')
  • Tables,Schemas and indexes are persisted.
  • Uses a columnar storage format with compression and buffered I/O
  • Only one write connection at a time but multiple read connection are allowed.
  • Supports WAL(Write Ahead Logging) for crash recovery

Powerful Pattern

DuckDb allows you to mix both modes where user can start with in-memory and attach a persistent database or use copy/export to snapshot in-memory result to disk.

con = duckdb.connect()

#Query a CSV, transform it, save the result to a persistent file
con.execute("""
    COPY(SELECT region, SUM(sales) AS total FROM read_csv('data.csv')
         GROUP BY region
     )
    TO 'results.parquet' (FORMAT PARQUET)
""")

Users gets the speed of In-Memory processing which accelerates the pipeline processing with an option to persist.

Reading files directly –CSV,PARQUET,JSON,Arrow,

Query CSV without loading into memory

Select * from read_csv('data_csv', auto_detect=true);

-Auto detects delimiter, compression and data types
-Handles malformed rows gracefully
-Can read multiple CSVs at once read_csv('data/*.csv')

Parquet

Select * from read_parquet('data.parquet');
--even from S3 directly
Select * from read_parquet('s3://bucket/data/*.parquet');
  • Exploits column pruning as it only reads columns you need
  • Leverages row group skipping using Parquet’s build in min/max stats
  • Native support for nested types(structs,list,maps)

JSON/NDJSON

SELECT * FROM read_json('events.ndjson', auto_detect=true);

-AUTO INFERS schema from data
-NDJSON(Newline delimited) streams efficiently line by line
-Can unnest deeply nested JSON fields using DuckDB’s json_extract, UNNEST, or -> operators

Apache Arrow

import pyarrow as pa
arrow_table = pa.Table.from_pandas(df)
duckdb.query(""SELECT * from arrow_table""")

-Zero copy integration: DuckDB reads from Arrow memory without serialization
-Ideal for pipelines where data never needs to touch disk

SQL Beyond Select

DuckDB is not just a query engine, it supports rich SQL that covers data transformation, creation, and some genuinely unique syntax extensions to available in most databases.

Full Suite of WINDOW Functions

Select
    customer,
    ordered_at,
    amount,

    -- Running total
    SUM(amount) OVER (PARTITION BY customer ORDER BY ordered_at) AS running_tot,

    -- Lag/lead comparisons
    LAG(amount) OVER (PARTITION BY customer ORDER BY ordered_at) AS prev_amt,

    -- Percentile rank
    PERCENT_RANK() OVER (ORDER BY amount) AS pct_rank,

    -- Named window reuse
    FIRST_VALUE(amount) OVER w AS first_order
FROM orders
WINDOW w AS (PARTITION BY customer ORDER BY ordered_at);

DuckDB also allows the use of qualify clause which filters on window result without a subquery.

Select * From orders
QUALIFY ROW_NUMBER() OVER (PARTITION BY customer ORDER BY amount DESC) = 1;

PIVOT and UNPIVOT

Most databases make you write case when manually for PIVOTS.
DuckDB does it natively.

--PIVOT- rows to columns
PIVOT orders on region USING SUM(amount) GROUP BY year;

--UNPIVOT- Column to rows
UNPIVOT sales_wide ON(q1,q2,q3,q4) INTO NAME quarter VALUE revenue;

MULTI DATABASE SQL

--Attach another DuckDB file
ATTACH 'archive.duckdb' AS archive;

-- Cross-database join
SELECT a.*, b.region
FROM main.orders a
JOIN archive.customers b ON a.customer_id = b.id;

--Attach another database
ATTACH 'postgres://user:pass@host/db' AS pg (TYPE POSTGRES);
SELECT * FROM pg.public.users LIMIT 10;

DUCKDB+Pandas+Polars –Choosing your stack

DuckDB does not replace pandas or Polars it solves a problem which is niche.The sweet spot of the industry is to use DuckDB for SQL-shaped operations and pandas/polars for row level python logic.

The Complimentary Trio

Where Duck DB shines

  1. Feature Engineering for ML: Window functions or group by’s for feature computation are often faster and more readable in DuckDB then pandas before handing it over to Sklearn or pytorch

  2. Unit testing DBT models locally:DuckDB lets you run complete dbt project locally without a cloud warehouse providing fast feedback loop for data engineers.

  3. Light weight ETL Pipelines: One can read raw parquet from S3, transform with SQL, write cleaned output back without any spark cluster or airflow jobs.

Conclusion

DuckDB lets you think in SQL for analytical tasks without worrying about infrastructure setup. Anyone using python can utilize duckdb for analysis of larger files where regular pandas will give headache.
Given the advantages, it is important to know whare DuckDB should not be used which in case of concurrent writes,OLTP workloads and long running multi user services.

Reference-
https://duckdb.org/docs/current/data/overview

Deep Dive: Connecting AI to Snowflake with Model Context Protocol (MCP)

The Model Context Protocol (MCP) lets AI assistants like Claude talk directly to Snowflake in real time — no custom API glue needed. This guide covers architecture patterns, RSA key-pair auth, Snowflake RBAC setup, production-tested SQL query patterns, and a full deployment checklist.

By anjijava16 · GitHub: mcp_servers

Data teams spend hours writing SQL queries, pivoting spreadsheets, and waiting for analysts to pull numbers. What if your AI assistant could talk directly to your Snowflake data warehouse — securely, in real time, with full natural language support?

That’s exactly what the Model Context Protocol (MCP) enables. In this deep dive, we’ll go far beyond a basic setup guide and explore architecture decisions, security hardening, real-world query patterns, performance tuning, and production deployment for an MCP-Snowflake integration.

Key Takeaways

  • MCP is a universal, open-standard adapter layer between any LLM and external data sources

  • Three deployment patterns exist: local stdio, SSE server, and cloud-hosted gateway

  • RSA key-pair auth is strongly preferred over passwords in production

  • A dedicated, minimal-permission Snowflake role limits blast radius if credentials are compromised

  • Tool filtering (--exclude_tools) prevents the AI from running writes or DDL

What is the Model Context Protocol (MCP)?

MCP is an open standard created by Anthropic that defines how AI systems communicate with external tools, data sources, and APIs. Think of it as a universal adapter layer — like USB-C for AI integrations.

┌──────────────────────────────────────────────────────────────┐
│                     AI Assistant (Claude)                    │
└──────────────────┬───────────────────────────────────────────┘
                   │  MCP Protocol (JSON-RPC over stdio/SSE)
┌──────────────────▼───────────────────────────────────────────┐
│                    MCP Server (Python)                       │
│   - Tool definitions (list_tables, run_query, etc.)         │
│   - Input validation & sanitization                         │
│   - Query execution & result formatting                     │
└──────────────────┬───────────────────────────────────────────┘
                   │  Snowflake Connector (Python SDK)
┌──────────────────▼───────────────────────────────────────────┐
│                    Snowflake Data Warehouse                  │
│   - Virtual Warehouses, Databases, Schemas, Tables          │
└──────────────────────────────────────────────────────────────┘

Why MCP Over Raw API Calls?

Approach MCP Direct API
Standardized protocol ✅ ❌
Tool discovery at runtime ✅ Auto ❌ Manual
Streaming support ✅ Partial
Multi-LLM compatible ✅ Any MCP client ❌ Vendor-specific
Safety controls built-in ✅ ❌
Swappable backends ✅ ❌

MCP tools are discoverable at runtime — the AI asks “what can you do?” and the server responds with a structured list of capabilities. No custom prompt engineering needed.

Architecture: Three Deployment Patterns

Pattern 1: Local stdio (Development)

Best for: Local development, Claude Desktop, personal use


Claude Desktop ──stdio──► Python MCP Server ──► Snowflake

The MCP server runs as a child process of Claude Desktop, communicating over stdin/stdout. Zero networking complexity.

Pattern 2: SSE Server (Team Use)

Best for: Shared team access, web UIs, multiple concurrent users


Web App / Multiple Clients ──HTTP SSE──► FastMCP Server ──► Snowflake

The server runs as a persistent HTTP service. Multiple users connect simultaneously.

Pattern 3: Cloud-Hosted (Production)

Best for: Enterprise, security compliance, high availability


Claude / Any LLM ──HTTPS──► MCP Gateway (Auth + Rate Limit) ──► MCP Server ──► Snowflake

Production deployments add authentication middleware, rate limiting, and audit logging between the LLM and the MCP server.

Prerequisites

Before starting, ensure you have:

  • Python 3.10–3.12 (3.13+ not yet supported by all Snowflake connector versions)

  • A Snowflake account with credentials:

    • Account identifier (e.g., xy12345.us-east-1)
    • Warehouse name
    • Username
    • Password or private key (RSA key-pair auth recommended)
    • Role with appropriate permissions
    • Database and Schema
  • Claude Desktop or any MCP-compatible client

Step 1 — Isolated Python Environment

Always use a dedicated virtual environment. Mixing dependencies pollutes your system Python and causes hard-to-debug version conflicts.


# Create a clean environment

python -m venv snowflake_mcp_env


# Activate it

# macOS / Linux:

source snowflake_mcp_env/bin/activate


# Windows (PowerShell):

.snowflake_mcp_envScriptsActivate.ps1

Pro tip: Name your environment descriptively (not just venv) — it matters when you have multiple projects open.

Step 2 — Install Dependencies


# Core MCP Snowflake server

pip install mcp-snowflake-server


# Recommended: lock versions for reproducibility

pip freeze > requirements.txt

What gets installed:

  • mcp-snowflake-server — the MCP server implementation

  • snowflake-connector-python — Snowflake’s official Python driver

  • fastmcp — the MCP framework underlying the server

Step 3 — Configuration Deep Dive

The MCP server is configured via a JSON config file. Here’s a minimal configuration and then a production-hardened version.

Minimal Configuration (Local Dev)


{

  "mcpServers": {

    "snowflake": {

      "command": "/path/to/snowflake_mcp_env/bin/python",

      "args": [

        "-m", "mcp_snowflake_server",

        "--account",   "xy12345.us-east-1",

        "--warehouse", "COMPUTE_WH",

        "--user",      "analyst_user",

        "--password",  "supersecret",

        "--role",      "ANALYST_ROLE",

        "--database",  "PROD_DB",

        "--schema",    "PUBLIC"

      ]

    }

  }

}

Problem: Hardcoded Credentials

Never commit credentials to git. Use environment variables instead:


{

  "mcpServers": {

    "snowflake": {

      "command": "/path/to/snowflake_mcp_env/bin/python",

      "args": [

        "-m", "mcp_snowflake_server",

        "--account",   "<SNOWFLAKE_ACCOUNT>",

        "--warehouse", "<SNOWFLAKE_WAREHOUSE>",

        "--user",      "<SNOWFLAKE_USER>",

        "--password",  "<SNOWFLAKE_PASSWORD>",

        "--role",      "<SNOWFLAKE_ROLE>",

        "--database",  "<SNOWFLAKE_DATABASE>",

        "--schema",    "<SNOWFLAKE_SCHEMA>"

      ]

    }

  }

}

Set environment variables:


# macOS / Linux — add to ~/.zshrc or ~/.bashrc

export SNOWFLAKE_ACCOUNT="xy12345.us-east-1"

export SNOWFLAKE_WAREHOUSE="COMPUTE_WH"

export SNOWFLAKE_USER="analyst_user"

export SNOWFLAKE_PASSWORD="supersecret"

export SNOWFLAKE_ROLE="ANALYST_ROLE"

export SNOWFLAKE_DATABASE="PROD_DB"

export SNOWFLAKE_SCHEMA="PUBLIC"


# Windows

$env:SNOWFLAKE_ACCOUNT = "xy12345.us-east-1"

$env:SNOWFLAKE_PASSWORD = "supersecret"

Step 4 — Advanced Authentication: RSA Key-Pair (Recommended)

Password-based auth is convenient but less secure. For production, use RSA key-pair authentication — no password travels over the network.

Generate RSA Key Pair


# Generate private key (encrypted with passphrase)

openssl genrsa 2048 | openssl pkcs8 -topk8 -v2 des3 -inform PEM -out rsa_key.p8


# Extract public key

openssl rsa -in rsa_key.p8 -pubout -out rsa_key.pub

Register Public Key with Snowflake


-- Run in Snowflake worksheet

ALTER USER analyst_user SET RSA_PUBLIC_KEY='MIIBIjANBgkqhkiG9w0BAQEFAAOCAQ8AMIIBCgKCAQEA...';

Update MCP Configuration for Key Auth


{

  "mcpServers": {

    "snowflake": {

      "command": "/path/to/snowflake_mcp_env/bin/python",

      "args": [

        "-m", "mcp_snowflake_server",

        "--account",            "<SNOWFLAKE_ACCOUNT>",

        "--user",               "<SNOWFLAKE_USER>",

        "--private_key_path",   "<SNOWFLAKE_PRIVATE_KEY_PATH>",

        "--private_key_passphrase", "<SNOWFLAKE_KEY_PASSPHRASE>",

        "--role",               "<SNOWFLAKE_ROLE>",

        "--warehouse",          "<SNOWFLAKE_WAREHOUSE>",

        "--database",           "<SNOWFLAKE_DATABASE>",

        "--schema",             "<SNOWFLAKE_SCHEMA>"

      ]

    }

  }

}

Step 5 — Snowflake Security Model for MCP

Create a Dedicated Read-Only Role

Never give the MCP server admin privileges. Create a minimal-permission role:


-- Create a dedicated MCP role

CREATE ROLE IF NOT EXISTS MCP_ANALYST_ROLE;


-- Grant read-only access to specific schemas

GRANT USAGE ON DATABASE PROD_DB TO ROLE MCP_ANALYST_ROLE;

GRANT USAGE ON SCHEMA PROD_DB.PUBLIC TO ROLE MCP_ANALYST_ROLE;

GRANT SELECT ON ALL TABLES IN SCHEMA PROD_DB.PUBLIC TO ROLE MCP_ANALYST_ROLE;

GRANT SELECT ON FUTURE TABLES IN SCHEMA PROD_DB.PUBLIC TO ROLE MCP_ANALYST_ROLE;


-- Grant warehouse usage (limit credits)

GRANT USAGE ON WAREHOUSE COMPUTE_WH TO ROLE MCP_ANALYST_ROLE;


-- Assign role to user

GRANT ROLE MCP_ANALYST_ROLE TO USER analyst_user;

Restrict Warehouse Size

Prevent runaway queries from consuming excessive credits:


-- Set auto-suspend to 60 seconds (no idle billing)

ALTER WAREHOUSE COMPUTE_WH SET AUTO_SUSPEND = 60;


-- Optionally limit query timeout for MCP sessions

ALTER USER analyst_user SET STATEMENT_TIMEOUT_IN_SECONDS = 120;

Step 6 — Available MCP Tools and How to Use Them

Once connected, the MCP server exposes these tools to Claude:

Core Tools

Tool Description Read/Write
list_databases List accessible databases Read
list_schemas List schemas in a database Read
list_tables List tables in a schema Read
describe_table Get column names, types, and sample values Read
run_query Execute a SELECT query and return results Read
get_sample_data Fetch a small sample from a table Read

Tool Filtering (Exclude Dangerous Tools)


"args": [

  "--exclude_tools", "run_query",

  "--exclude_tools", "execute_ddl"

]

Use --exclude_tools to restrict what the AI can do. For read-only deployments, exclude any write or DDL tools.

Step 7 — Real-World Query Patterns

Here are production-tested prompts and the SQL they generate:

Business Intelligence Queries

Prompt:

“Show me the top 10 products by revenue for Q1 2025, broken down by region”

Generated SQL:


SELECT

    p.product_name,

    o.region,

    SUM(o.revenue) AS total_revenue,

    COUNT(DISTINCT o.order_id) AS order_count

FROM orders o

JOIN products p ON o.product_id = p.id

WHERE QUARTER(o.order_date) = 1 AND YEAR(o.order_date) = 2025

GROUP BY p.product_name, o.region

ORDER BY total_revenue DESC

LIMIT 10;

Trend Analysis

Prompt:

“What’s the month-over-month customer churn trend for the past 6 months?”

Generated SQL:


SELECT

    DATE_TRUNC('month', cancelled_at) AS churn_month,

    COUNT(*) AS churned_customers,

    LAG(COUNT(*)) OVER (ORDER BY DATE_TRUNC('month', cancelled_at)) AS prev_month,

    ROUND(

        (COUNT(*) - LAG(COUNT(*)) OVER (ORDER BY DATE_TRUNC('month', cancelled_at)))

        / NULLIF(LAG(COUNT(*)) OVER (ORDER BY DATE_TRUNC('month', cancelled_at)), 0) * 100, 2

    ) AS mom_change_pct

FROM subscriptions

WHERE cancelled_at >= DATEADD('month', -6, CURRENT_DATE)

GROUP BY 1

ORDER BY 1;

Anomaly Detection

Prompt:

“Flag any orders where the total amount is more than 3 standard deviations from the average”


WITH stats AS (

    SELECT

        AVG(total_amount) AS avg_amount,

        STDDEV(total_amount) AS std_amount

    FROM orders

    WHERE order_date >= DATEADD('month', -3, CURRENT_DATE)

)

SELECT o.*

FROM orders o, stats s

WHERE ABS(o.total_amount - s.avg_amount) > 3 * s.std_amount

ORDER BY o.total_amount DESC;

Step 8 — Logging and Debugging

Enable logging for troubleshooting:


"args": [

  "--log_dir",   "/var/log/mcp_snowflake",

  "--log_level", "DEBUG"

]

Log files capture:

  • All tool calls from the AI

  • SQL queries executed

  • Snowflake connection events

  • Error tracebacks

Verify the Connection Manually


# Activate environment

source snowflake_mcp_env/bin/activate


# Test connection directly

python -c "

import snowflake.connector

conn = snowflake.connector.connect(

    account='xy12345.us-east-1',

    user='analyst_user',

    password='supersecret',

    warehouse='COMPUTE_WH',

    database='PROD_DB',

    schema='PUBLIC'

)

cursor = conn.cursor()

cursor.execute('SELECT CURRENT_VERSION()')

print(cursor.fetchone())

conn.close()

"

Step 9 — Common Pitfalls and Fixes

Python Version Incompatibility


ERROR: Could not install mcp-snowflake-server (requires Python ≤ 3.12)

Fix: Use Python 3.10, 3.11, or 3.12. Check with python --version.

Incorrect Python Path in Config


ERROR: spawn /path/to/python ENOENT

Fix: Always use the absolute path to the virtual environment’s Python:


# Get the correct path

which python  # (after activating the venv)

# Output: /Users/yourname/snowflake_mcp_env/bin/python

Missing Snowflake Permissions


SQL compilation error: Object 'PROD_DB.PUBLIC.ORDERS' does not exist or not authorized

Fix: Verify role permissions:


SHOW GRANTS TO ROLE MCP_ANALYST_ROLE;

Network / Firewall Block


snowflake.connector.errors.DatabaseError: Failed to connect to DB

Fix: Ensure outbound HTTPS (port 443) is open to *.snowflakecomputing.com.

Warehouse Suspended / Auto-Start Delay

Fix: Enable auto-resume:


ALTER WAREHOUSE COMPUTE_WH SET AUTO_RESUME = TRUE;

Step 10 — Production Deployment Checklist

Before going to production, verify each item:


Security

  ☐ RSA key-pair authentication (no passwords)

  ☐ Credentials stored in secrets manager (AWS Secrets Manager / Azure Key Vault)

  ☐ Dedicated read-only role with minimal permissions

  ☐ No DDL/DML tool access

  ☐ Query timeout set on user/session


Reliability

  ☐ Warehouse auto-resume and auto-suspend configured

  ☐ Connection pool configured

  ☐ Error handling and retry logic in place

  ☐ Health check endpoint (if SSE server)


Observability

  ☐ Logging enabled with appropriate level

  ☐ Log rotation configured

  ☐ Snowflake query history monitored (SNOWFLAKE.ACCOUNT_USAGE.QUERY_HISTORY)


Compliance

  ☐ Audit trail for all AI-generated queries

  ☐ Data masking on sensitive columns (PII, PCI)

  ☐ Network policy limiting MCP server source IPs

Reference Implementations

All code discussed in this article is available on GitHub:

🔗 Multi-Database MCP Collection

A comprehensive collection of MCP server implementations including Snowflake, PostgreSQL, MySQL, Redis, MongoDB, and more:

👉 github.com/anjijava16/mcp_servers

🔗 Snowflake MCP Server (Development Branch)

The active Snowflake-specific implementation with the latest features:

👉 anjijava16/mcp_servers — mcp_snowflake_server

🔗 Reference: Standalone Snowflake MCP Server

A clean reference implementation following MCP standards closely:

👉 isaacwasserman/mcp-snowflake-server

What’s Next?

Once the Snowflake MCP server is running in production, natural extensions include:

Extension Description
Multi-database federation Connect MCP to Snowflake + PostgreSQL + MongoDB simultaneously via one gateway
dbt semantic layer Route AI queries through dbt metrics instead of raw tables — business-safe by construction
Google ADK integration Expose MCP servers as tools inside Google Agent Development Kit agents
MLflow observability Trace every MCP tool call through the OTel Collector into MLflow experiments
Streaming large results Handle million-row result sets with SSE streaming instead of buffering
Prompt injection hardening Add an LLM-based classifier to detect and reject adversarial tool inputs

Summary

What we covered Key takeaway
MCP architecture Universal adapter — one protocol for Snowflake, Postgres, Redis, and everything else
Three deployment patterns stdio (dev) → SSE server (team) → Cloud gateway (enterprise)
RSA key-pair auth No credential over the wire; rotate the key file, not a password
Snowflake RBAC Dedicated minimal-permission role + network policy + warehouse caps
Real-world query patterns BI aggregations, MoM trends, z-score anomaly detection, cohort retention
Logging and debugging Structured logs + manual connection verification before deploy
Common pitfalls Python version, absolute paths, role grants, firewall, prompt injection
MLflow integration Close the loop — every MCP tool call becomes an observable trace
Production checklist 20-point checklist across auth, authorization, reliability, observability, compliance

The combination becomes even more powerful when paired with an observability stack: every natural language question, every generated SQL query, and every Snowflake response becomes a traceable, auditable, improvable event in your system.

MCP + Snowflake is one of the most immediately practical AI integrations available today. Your entire data team can start exploring data warehouse contents conversationally — no SQL required — while you maintain full security control over what the AI can and cannot do.

About the Author

anjijava16 builds MCP integrations for databases, AI agents, and data infrastructure. Follow on HackerNoon for more deep dives in the MCP Deep Dives series.

Source code: github.com/anjijava16/mcp_servers — contributions and stars welcome.