What Makes a Job Dull, Dirty, or Dangerous?

For years, the field of robotics has used the terms “dull, dirty, and dangerous” (DDD) to describe the types of tasks or jobs where robots might be useful—by doing work that’s undesirable for people. A classic example of a DDD job is one of “repetitive physical labor on a steaming hot factory floor involving heavy machinery that threatens life and limb.”

But determining which human activities fit into these categories is not as straightforward as it seems. What exactly is a “dull” task and who makes that assumption? Is “dirty” work just about needing to wash your hands afterwards, or is there also an aspect of social stigma? What data can we rely on to classify jobs as “dangerous?” Our recent work (which was not dull at all) tackles these questions and proposes a framework to help roboticists understand the job context for our technology.

First, we did an empirical analysis of robotics publications between 1980 and 2024 that mention DDD and found that only 2.7% define DDD and only 8.7% provide examples of tasks or jobs. The definitions vary, and many of the examples aren’t particularly specific (e.g., “industrial manufacturing,” “home care”). Next, we reviewed the social science literature in anthropology, economics, political science, psychology, and sociology to develop better definitions for “dull,” “dirty,” and “dangerous” work. Again, while it might seem intuitive which tasks to put into these buckets, it turns out that there are some underlying social, economic, and cultural factors that matter.

Dangerous Work: Occupations or tasks that result in injury or risk of harm

It’s possible to measure the danger of a task or job by using reported information: there are administrative records and surveys that provide numbers on occupational injury rates and hazardous risk factors. While that seems straightforward, it’s important to understand how these data were collected, reported, and verified.

First, occupational injuries tend to be underreported, with some studies estimating up to 70% of cases missing in administrative databases. Second, injuries and risk factors are rarely disaggregated by characteristics like gender, migration status, formal/informal employment, and work activities. For example, because most personal protective equipment, such as masks, vests, and gloves, are sized for men, women in dangerous work environments face increased safety risks.

These caveats are an opportunity for robotics to be helpful: If we went out and looked for it, we could probably find some less obvious dangerous work where robotics might be an important intervention, not to mention some groups that are disproportionately affected and would benefit from more workplace safety.

Dirty Work: Occupations or tasks that are physically, socially, or morally tainted

Colloquially, most people might think of dirty work as involving physical dirtiness, like trash, cleaning, or hazardous substances But social science literature makes clear that dirty work is also about stigma. Socially tainted jobs are often servile or involve interacting with stigmatized groups (e.g., correctional officer) and morally tainted jobs include tasks that people commonly perceive as sinful, deceptive, or otherwise defying norms of civility (e.g., stripper, collection agent.)

“Dirty work” is a social construct that can vary across time (like tattoo industry stigma in the US) and culture (such as nursing in the US vs. in Bangladesh). One way to measure whether work is “dirty” is by using the closely related concept of occupational prestige, captured through quantitative surveys where people rank jobs. Another way to measure it is through qualitative data, like ethnographies and interviews. Similar to “dangerous,” we see some hidden opportunities for robotics in “dirty” work. But one of our more interesting takeaways from the data is that a lower-ranked job can be something that the workers themselves enjoy or find immense pride and meaning in. If we care about what tasks are truly undesirable, understanding this worker perspective is important.

Dull Work: Occupations or tasks that are repetitive and lacking in autonomy

When it comes to defining dull work, what matters most is workers’ own experiences. Outsiders can make a lot of false assumptions about what tasks have value and meaning. Sometimes things that seem boring or routine create the right conditions for developing skills and competence, such as the concentration needed for woodworking, or for socializing and support, when tasks are done alongside others. Instead of assuming that repetitive work is negative, it’s important to examine qualitative data on how people experience the work and what purpose it serves for them.

DDD: An actionable framework

In our paper, we propose a framework to help the robotics community explore how automation impacts individual jobs. For each term—dull, dirty, and dangerous—the framework gathers key pieces of information to reflect on what physical or social aspects of the task are, in fact, DDD. Worker perspective is an important part of all three considerations. The framework also emphasizes awareness of context, i.e. the physical and social environment of an occupation and industry that can influence the DDD nature of a task. Our corresponding worksheet suggests existing data sources to draw on, as well as encouraging us to seek out multiple perspectives and consider potential sources of bias in the information.

A diagram illustrating that tasks that are dangerous, dirty, or dull depend on how the workers feel about the social and physical environment. What makes tasks dull, dirty, or dangerous depends on the perspective of the humans doing those tasks.RAI

Let’s take, for example, the waste and recycling industry. The world generates over 2 billion tons of waste annually, and this figure is expected to rise to nearly 4 billion tons by 2050. Intuitively, trash collection seems like a job that hits all the Ds. Going through our worksheet, we confirm that globally, workers in this industry face significant health hazards (dangerous), and waste collection is ranked as a low-status job (dirty), although interestingly, many workers take pride in providing this essential service.

The job is also repetitive, but there are aspects that make it not dull. Specifically, workers cite the day-to-day interaction with their coworkers (which includes extensive insider vocabulary, work hacks, and mutual aid groups) and task variety as two of the most enjoyable aspects of the job. Task variety includes inspecting their vehicle and equipment, driving their truck, coordinating with crew members, lifting bins and bags, detecting incorrect sorting of waste, and unloading at the end destination.

This finding matters, because some types of robotic solutions will eliminate the parts of the job that workers most appreciate. For instance, the National Institute for Occupational Safety and Health (NIOSH) recommends the adoption of automated side loader trucks and collision avoidance systems. This innovation increases safety, which is great, but it also results in a sole worker operating a joystick in a cab, surrounded by sensor and camera surveillance.

Instead, we should challenge ourselves to think of solutions that make jobs safer without making them terrible in a different way. To do this, we need to understand all aspects of what makes a job dull, dirty, or dangerous (or not.) Our framework aims to facilitate this understanding.

Finally, it’s important to note that DDD is only one of many possible approaches to classify what work might be better served by robots–there are lots of ways we could think about which types of tasks or jobs to automate (e.g., economic impact, or environmental sustainability). Given the popularity of DDD in robotics, we chose this common phrase as a starting point. We would love to see more work in this space, whether it’s data collection on DDD itself, or the creation of other frameworks.

At RAI, we believe that the fusion of robotics and social sciences opens a whole new world of information, perspectives, opportunities, and value. It fosters a culture of curiosity and mutual learning, and allows us to create actionable tools for anyone in robotics who cares about societal impact.

Dull, Dirty, Dangerous: Understanding the Past, Present, and Future of a Key Motivation for Robotics, by Nozomi Nakajima, Pedro Reynolds-Cuéllar, Caitrin Lynch, and Kate Darling from the RAI Institute, was presented at the 21st ACM/IEEE International Conference on Human-Robot Interaction (HRI) in Edinburgh, Scotland.

Sony, “PlayStation Plus” ücretlerine zam yapıyor

Sony PlayStation 6 el konsolu LOG Tasarım

Sony PlayStation 6 el konsolu LOG TasarımSony bu akşam PlayStation Plus ücretlerine zam yapılacağını duyurdu. Bu konuda yaptığı resmi paylaşımda, “Bu fiyat değişikliği, mevcut aboneliğin değiştirilmesi veya iptal edilmesi durumları haricinde mevcut aboneleri etkilemeyecek. Ancak Türkiye ve Hindistan’daki kullanıcılar bu istisnanın dışında kalacak.” diyen şirket, “Mevcut piyasa koşullarına bağlı olarak yeni abonelere uygulanacak fiyatlar değişiyor. 1 aylık abonelikler 10,99 ABD Doları / 9,99 Avro / 7,99 İngiliz Sterlini, 3 aylık abonelikler ise 27,99 ABD Doları / 27,99 Avro / 21,99 İngiliz Sterlini seviyesine çıkarılıyor.” ifadelerini kullandı. Zamların 20 Mayıs itibarıyla devreye alınacağını duyuran Sony, Türkiye’deki “zamlı” fiyatları henüz paylaşmadı. Türkiye’deki mevcut abonelik ücretleri şu şekilde listeleniyor. -PS+ Essential: 1 ay için 270 TL / 3 ay için 710 TL / 12 ay için 2.160 TL -PS+ Extra: 1 ay için 405 TL / 3 ay için 1.148 TL / 12 ay için 3.645 TL -PS+ Deluxe: 1 ay için 474 TL / 3 ay için 1.354 […]

Sony, “PlayStation Plus” ücretlerine zam yapıyor yazısı ilk olarak Teknoloji haberleri – LOG üzerinde yayınlandı.

Memory management in C# – Part 2: hands-on

Let’s profile a real C# app!

Note: The tooling used in this article is linked at the end. The analysis approach is independent of tooling, but there is a practical bias here towards the Windows platform. I expect you have some familiarity with Visual Studio and the command line, but even without that, you should be able to follow along.

This will be more practical, so please keep in mind that the memory analysis one does is as good as an expected baseline and the experienced delta. In other words, we should try to pick a “control group” (the expected memory consumption) to compare it with a use case (the scenario of analysis, in which the memory consumption seems “too high”, as per some threshold). For example, C# ASP.NET Core applications can use from tens up to hundreds of MB at the start in debug mode. The gist for now is: this is not a micro optimization theoretical exercise – we’ll measure an application performance like in the real world.

Which app?

We need a long-running process. Let’s start by running a simple ASP.NET Core web application and having a look around the memory consumption.

For that, I’ve created a folder called complex-app and ran

dotnet new webapi

to download and set up a pre-configured app.

To run it, we can simply use

dotnet run

Or build our project using Visual Studio and run the executable. When assessing performance, prefer the Release build (not Debug), because it will be closer to the realistic production binary. Debug builds carry different symbols we simply don’t need for our purposes.

This will start a new .NET Core runtime process with our solution and bind it a to a HTTP port, exposing any available controller routes (the usual stuff, from the Program.cs entry point).

Profiling

To introduce some visualization and look into what’s happening memory-wise behind the scenes, let’s use PerfView. It’s a simple standalone .exe, so I’ve downloaded it and included it in our Release output folder (in my case complex-appbinReleasenet10.0).

For that, we’ll run PerfView and select the Collect -> Run option.

For the Command, I’ll select our program “complex-app.exe”.

And click on “Run command”. This is going to start our process from within the Profiler, collecting memory (and trace, and other) data from its execution. We can see the logs of our application by clicking on the “Log” button on the bottom-right corner.

Analyzing

To analyze our profiling session, all we have to do is click on “Cancel” on the bottom right corner. Then we can get the .etl (analysis) file that was produced as output and open it in PerfView.

Feel free to familiarize yourself with the structure of this file. I invite you to start by double clicking on “CPU Stacks” and selecting the “complex-app” process, like in the following screenshot:

Then double click on the “complex-app” process and we’ll see what is really consuming time in our program. And the winner is the coreclr! That’s expected, the Core Language Runtime will definitely be doing most of the heavy lifting of our app, in my case representing 36% of total execution time.

Tip: you can drill down by double clicking on the coreclr reference itself and checking individual method calls. Cool, isn’t it? Now we can see the likes of extensions, aspnetcore, logging and much more!

Let’s look at the memory.

For that, I’ll expand the “Memory” folder and navigate to “GC Heap Net Mem”, as this is the snapshot of the Garbage Collector.

So this is how my “complex-app” looks like, there’s a bunch of bytes of Int32, a few of String… We’ll make things more interesting in the next section.

Load

A few things to keep in mind before we increase the scale of our app and move to a more relevant analysis:

  • State of the art CPUs can process billions of instructions per cycle, so ultimately the memory can be allocated, detected in scope and cleared out very fast
  • Also due to the complexity of modern applications, when it comes to profiling and optimization we’re mostly interested in hot paths and benchmarks (remember the baseline and deltas)
  • There is a trade-off between clean code and performance, arguably that goes all the way down to design discussions between OOP and procedural programming
  • Load and scale are very important factors that usually come together: simplistic algorithms perform well with smaller inputs

Let’s work on some information retrieval functionality for our app. Generally, it’s a good practice to think about the data itself: different algorithms behave differently depending on the shape, quantity and quality of our data. Classes vs. structs, primitive vs. complex types, the more we understand about our data, the better. We’ll simulate a random list of users with the following user generator:

namespace complex_app.Data;

using complex_app.Models;
using System.Text;

public static class UserGenerator
{
    private static readonly Random _rand = new Random();

    private static readonly string[] FirstNames =
    {
        "John", "Maria", "Alex", "Sophie", "Daniel", "Lucas", "Emma", "Noah",
        "Isabella", "Liam", "Oliver", "Mia", "Ethan", "Amelia"
    };

    private static readonly string[] LastNames =
    {
        "Smith", "Johnson", "Brown", "Taylor", "Anderson", "Silva",
        "Kowalski", "Dubois", "Novak", "Rossi", "Fernandez"
    };

    public static List<User> GenerateUsers(int count)
    {
        var users = new List<User>(count);

        for (int i = 0; i < count; i++)
        {
            double roll = _rand.NextDouble();

            string name = roll switch
            {
                < 0.70 => NormalName(),
                < 0.85 => CaseNoiseName(),
                < 0.95 => LongName(),
                _ => EmailStyleName()
            };

            users.Add(new User
            {
                Id = i,
                Name = name
            });
        }

        return users;
    }

    private static string NormalName()
    {
        return $"{Rand(FirstNames)} {Rand(LastNames)}";
    }

    private static string CaseNoiseName()
    {
        return ToRandomCase(NormalName());
    }

    private static string LongName()
    {
        return $"{Rand(FirstNames)} {Rand(LastNames)} {Rand(LastNames)} III (Contractor - EU West Region)";
    }

    private static string EmailStyleName()
    {
        return $"{Rand(FirstNames).ToLower()}.{Rand(LastNames).ToLower()}@company-internal-domain.eu";
    }

    private static string Rand(string[] arr)
        => arr[_rand.Next(arr.Length)];

    private static string ToRandomCase(string input)
    {
        var sb = new StringBuilder(input.Length);

        foreach (var c in input)
        {
            sb.Append(_rand.Next(2) == 0
                ? char.ToLowerInvariant(c)
                : char.ToUpperInvariant(c));
        }

        return sb.ToString();
    }
}

Simulation is one of the most powerful tools in performance analysis. A late great simulation will never be the same as a memory production issue, but an early good simulation can definitely avoid the issue entirely.

Now we add the list to our app, in Program.cs – I’ll inject it as a global singleton dependency, with 20K users:

// ...
var users = UserGenerator.GenerateUsers(20_000);
builder.Services.AddSingleton(users);
// ...

Finally, we can come up with a small search behavior: I have the following interface, with the Search and SearchFast methods. You can probably see where we’re heading from here, but I promise looking at the memory footprint will be interesting and perhaps can give some unexpected insights even for experienced engineers.

using complex_app.Models;

namespace complex_app.Services;

public interface IUserSearch
{
    List<User> Search(string query);
    List<User> SearchFast(string query);
}

public class UserSearch : IUserSearch
{
    private readonly List<User> _users;

    public UserSearch(List<User> users)
    {
        _users = users;
    }

    public List<User> Search(string query)
    {
        query = query.ToLowerInvariant();

        var results = _users
            .Where(u => u.Name.ToLowerInvariant().Contains(query))
            .ToList();

        return results;
    }

    public List<User> SearchFast(string query)
    {
        return _users
            .Where(u => u.Name.Contains(query, StringComparison.OrdinalIgnoreCase))
            .ToList();
    }
}

Exercising the app

Now what we need to do is simply run our app like before, with the run command. For the sake of empirical analysis, we’ll compare:

  • A run using only the Search method, and
  • Another run using only the SearchFast method

In this experiment, each method will be called 10 times directly through the endpoints GET /seach?q=abc and GET /search-fast?q=abc, respectively.

While service warm up is definitely a factor influencing our performance, for this exercise start up times will be aggregated and neglected – for simplicity: both simulate the same piece of behavior with different implementations.

Final results

At last, let’s compare using Search against SearchFast. So we have two files open in PerfView, a PerfViewData.etl.zip and below it a PerfViewData_Fast.etl.zip (I’m not very good at naming things, as you can see).

Starting with CPU stacks, we have our UserSearch appearing with 3.4% of total CPU time when it comes to Search (highlighted):

In SearchFast, interestingly, the search method stopped appearing in CPU traces entirely. Not because it disappeared, but because it was no longer a meaningful contributor to execution time – its time was below the sampling threshold of PerfView. Why is that the case? Let’s look at the GC next.

We can do an in depth GC analysis by clicking on Memory -> GC Heap Net Mem. That will open a panel with our GC profile. Looking at Search first, we see 90% of garbage collection pressure was attributed to string operations. At first glance, it looked like the search logic was the bottleneck.

Comparatively, our User model took 0.8% of GC pressure, coming is as second place.

In SearchFast, after removing seemingly innocent allocations created by ToLowerInvariant, string-related GC pressure disappeared entirely. The dominant cost shifted to the user model itself.

The surprising part wasn’t that performance just improved, it was that the profiler stopped showing strings as a meaningful contributor at all.

Not only that, we see what looks like, for our purposes, a much healthier application, in which the GC is diving its time between our data models and JSON parsing for the HTTP pipeline.

Conclusion

What started as a seemingly simple search implementation ended up revealing something more fundamental about performance in .NET applications: the real cost of a feature is often not where we initially expect it to be.

At first glance, the Search and SearchFast methods appear almost identical in intent. Both iterate over the same dataset, both perform substring matching, and both return the same result type. From a purely algorithmic perspective, you might even assume their performance characteristics would be similar at this scale.

However, profiling tells a different story, and that’s the importance of understanding about how we leverage memory in practice.

Commonly in managed runtimes like .NET, the observed slowness or memory leak is actually introduced by a large volume of short-lived allocations. In our example, repeated string transformations, particularly using ToLowerInvariant. This shifts the workload away from CPU-bound computation and into garbage collection pressure, with the profiler showing strings as the dominant contributor to GC activity.

In the optimized version, removing these allocations did not simply “improve performance” fundamentally changed the shape of the application. As we saw, string-related GC pressure disappeared entirely from the trace, and the remaining cost shifted naturally toward the data model and pipeline processing.

This is the key insight: performance work is not always about making a single operation faster. More often, it is about changing what the runtime is actually spending its time and memory on.

I hope that was useful and see you on the next one 🙂

References and relevant tools

m0lz.02 — Stack Loops

Introduction

Stack Loops is the m0lz.02 workflow for checking a feature across its technology layers instead of treating the whole diff as one review contract. The failure class is a seam gap: app code, API shape, schema, infrastructure, deployment, and observability can each look acceptable in isolation while their boundary breaks. A frontend field rename that never reaches the API schema, or a new background queue that ships without the deploy/runtime wiring, is the kind of bug this workflow is designed to expose.

This launch post keeps the claim narrow. The current evidence shows that Stack Loops detects and configures the expected layer contracts for the reference projects, persists separate layer runs, surfaces an infrastructure review gate, and executes its parallel evaluator cohort under the published release-gate ratio. It does not claim live-model bug-detection lift over a named commercial reviewer.

What It Does

Stack Loops turns one feature review into a set of layer-scoped checks. m0lz.02 identifies the layers that matter for a project, writes those contracts into the PICE plan, runs the evaluator cohort per layer, and records a separate layer run for each activated layer before the feature is treated as passed.

The always-run policy matters because many production failures live outside application code. Infrastructure, deployment, and observability layers are configured to stay in the loop when they are active, even if the feature diff looks like a frontend or API change. This benchmark does not compare that policy against an ablated run that omits those layers, and it does not record per-fixture feature-diff scope; it captures the seven-layer set that discovery and configuration produced on the reference fixtures and the persisted layer runs that followed.

The concrete gate example is fastapi-postgres. In the captured acceptance run, that fixture hit a pending infrastructure review gate, recorded one gate decision, received approval, and resumed to passed. That is the workflow shape Stack Loops needs: pause at the cross-layer contract, make the decision auditable, then continue only after the gate is resolved. The capture does not include a negative-control run where an activated layer fails or a gate is rejected, so the fail-closed pass/fail aggregation is evidenced as plumbing and audit rather than as a refusal at aggregation time.

How It Works

The workflow starts with layer discovery. m0lz.02 reads project evidence from manifests, framework files, directory layout, config files, and explicit overrides. It then evaluates the feature against the per-layer contract files at .pice/contracts/{layer}.toml instead of asking a single reviewer to infer every boundary from one prompt. The per-layer contracts evaluated in this capture are the template contracts that pice init --upgrade writes from templates/pice/contracts/; their criteria headlines and template hashes are recorded under results.json.methodology.per_layer_contract_content. Bespoke per-fixture contracts that customize criteria to the schema/auth/deployment/observability risks of a specific project are out of scope for this launch capture.

Evaluation runs through the daemon. The CLI accepts terminal commands and renders status; pice-daemon owns background jobs, provider sessions, manifests, layer-run persistence, metrics, templates, audit rows, and review gates. The CLI talks to the daemon over the local socket. The daemon talks to providers over stdio, with provider stdout reserved for JSON-RPC frames.

That split is the main product boundary. The CLI stays a thin operator surface. The daemon owns orchestration and state, so status --follow, logs --follow, review-gate approval, and resumed background evaluation all read from the same job record instead of from terminal text.

Architecture

m0lz.02 is the companion repository for this launch: https://github.com/jmolz/m0lz.02. It contains the PICE CLI, the headless daemon, provider adapters, reference fixtures, release documentation, and acceptance scripts.

The architecture is built around a CLI/daemon split:

Boundary Responsibility
CLI Parse commands, connect to the daemon socket, display status/log streams, and send operator actions such as review-gate approval.
Daemon Own background evaluation, provider sessions, manifests, layer runs, metrics, templates, audit records, and gate state.
Provider stdio Carry JSON-RPC request and response frames between the daemon and the provider process.
SQLite state Persist evaluations, layer runs, pass events, seam findings, gate decisions, and audit records.

This matters for Stack Loops because layer evaluation is not a single synchronous terminal response. It needs resumable state, separate layer records, stream-json terminal frames, and human gate decisions that survive process boundaries.

Benchmark Results

The raw benchmark artifact is results.json in the benchmark workspace. The human-readable summary is below.

Check Result Evidence Boundary
Parallel cohort assertion passed Sequential mean 6.238500097s; parallel mean 3.147005138s; ratio 0.504 at or below target 0.625. Release-gate timing assertion only; three iterations and no confidence interval.
Phase 8 reference projects passed Five PICE-authored fixtures passed. Each produced seven detected layers, seven configured layers, seven distinct layer_runs rows, terminal exit code zero, and evaluate_status: passed. Reference-fixture mechanics, not external project coverage.
Infrastructure review gate passed fastapi-postgres recorded gate_decisions: 1, audit_id: 1, approval, and resumed to passed. Demonstrates gate plumbing and auditability, not general bug-detection lift.
Infrastructure contract tier recorded Each fixture reported infrastructure_contract_tier: 3. Tier three means the infrastructure layer used the agent-team evaluation contract configured by the fixture.
Provider mode stubbed The acceptance script used provider stub, model stub-model, and eight 9.5,0.001 stub-score pairs. Validates Stack Loops mechanics, not live provider judgment quality.

Three expected release-readiness targets were not run in this capture: the steady-state Criterion benchmark, the release artifact smoke test, and the local Linux CI script. The post therefore treats the capture as benchmark evidence for Stack Loops mechanics on one darwin arm64 machine, not as a complete release certification.

Methodology

The benchmark workspace now includes METHODOLOGY.md beside results.json and environment.json. That methodology file records the commands, repository revision, environment (including the Rust toolchain that produced the Cargo timing), provider mode, target provenance, omissions, and scope limits.

The speedup assertion is a release-gate check. It compares the sequential evaluator cohort path with the parallel evaluator cohort path and verifies that the ratio remains at or below the inherited target. The harness recorded the means and ratio, but it did not record raw per-iteration timings, variance, standard deviation, or a confidence interval. The ratio target came from the earlier release validation contract; it was not statistically re-derived in this capture.

The Phase 8 acceptance run is also bounded. It used PICE-authored reference fixtures and a stub provider. That is the right harness for checking layer discovery, layer persistence, stream termination, review-gate state, and daemon orchestration. It is not evidence that a live model would catch more real bugs than a single-contract reviewer, and it is not evidence that every framework topology is covered.

The environment snapshot records darwin 25.4.0 on arm64, Apple M3 Max x 16 CPUs, 128 GB memory, Node.js v22.15.0, and npm 11.12.1. The snapshot was captured before the results import, so it should be read as hardware and toolchain context rather than an exact same-process timing envelope.

Limitations

The comparator in this post is a one-contract-per-feature review workflow, not a named commercial product. That avoids a stronger claim than the evidence supports.

The reference fixtures are authored by the m0lz.02 project. They exercise canonical Next.js, FastAPI, Rails, Express, and SvelteKit shapes, but they do not cover polyrepo discovery, monorepo package-boundary inference, dynamic service-mesh topology, or live-provider disagreement cases.

The always-run layer policy was enforced, not ablated. To prove the policy improves defect detection, m0lz.02 still needs a comparison run that disables infrastructure, deployment, and observability layers against the same task set. The always-run trigger condition is also not separately evidenced in this capture: results.json records seven configured and seven persisted layer runs per fixture but does not record each fixture’s feature-diff scope, so the artifact supports always-run plumbing and persistence rather than the trigger condition that meta-layers ran despite an otherwise narrower diff.

The fail-closed pass/fail aggregation is not exercised by a negative control in this capture. Every fixture passed under the stub provider, and the one infrastructure gate decision was an approval that resumed to passed. A failing-layer, missing-layer-run, or rejected-gate negative-control run would prove that aggregation refuses to mark a feature passed; until that artifact exists, the post bounds the claim to plumbing, persistence, and approved-gate resume behavior.

The per-layer contract content evaluated in this capture is the m0lz.02 template content under templates/pice/contracts/, recorded with criteria headlines and template hashes in results.json.methodology.per_layer_contract_content. The artifact therefore evidences per-layer contract evaluation against named risk-class criteria, not bespoke per-fixture contracts authored for the schema, auth, deployment, or observability risks of a specific real project.

The seam-failure classes used to motivate the launch (frontend field rename that never reaches the API schema, background queue that ships without deploy/runtime wiring, the schema-to-API and deploy-to-runtime risks named in the conclusion) are not validated by this capture either. The acceptance harness evidences layer mechanics and per-layer template criteria; a seam-failure fixture or seam-finding negative control is the artifact that would prove detection of those specific risk classes.

The current capture is single-machine darwin arm64 evidence. Any Linux, CI, or cross-platform runtime claim needs a separate capture from the omitted release-readiness targets. The Rust toolchain that produced the speedup timing is recorded in environment.json under rust_toolchain (rustc 1.94.1, cargo 1.94.1, stable channel, no project toolchain pin, default dev test profile) so the Cargo target is reproducible.

Conclusion

Use Stack Loops when the risk lives between layers: schema to API, code to infrastructure, deploy to runtime, runtime to observability. This launch proves the workflow mechanics on the current reference capture and keeps the broader claim for later evidence.

The next work is clear: replay the same layer contracts with live providers, add harder non-canonical projects, run the omitted release-readiness targets, and publish the comparison only when those artifacts exist.

Self-hosting SimpleLogin: own your email aliases for $3 a month

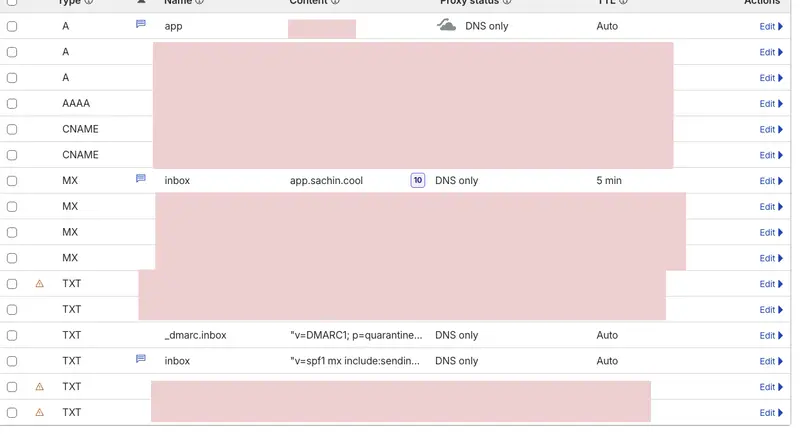
Cloudflare DNS panel showing all configured records

Originally published at harshit.cloud on 2026-02-07.

Self-hosting SimpleLogin: own your email aliases for $3 a month

I’d been running Cloudflare Email Routing for months. Free. Dead simple. Emails hit my custom domain, forwarded to Gmail. Privacy-friendly aliases without paying a dime.

Then I tried to reply from an alias. Couldn’t.

Cloudflare Email Routing is inbound-only. You receive emails at your alias, but when you hit reply, it goes out from your real Gmail address. The whole point of aliasing — gone in one click.

I’d already moved my infrastructure to a self-hosted Dokploy setup running on Hetzner. The server was sitting there at 8% CPU. Why not run my own email aliasing too?

Two hours later, I had full bidirectional email aliases running on SimpleLogin. Here’s every step, including the TLS trap that almost made me quit.

why Cloudflare email routing wasn’t enough

Credit where it’s due. Cloudflare Email Routing is genuinely great for what it does:

  • Free. No credit limits, no tier anxiety
  • 5-minute setup. Add MX records, create routes, done
  • Reliable inbound forwarding. Never lost an email

But the moment you need to reply from an alias or send a new email as your alias, you’re stuck. Cloudflare loosened Email Workers’ reply restrictions in March 2025 to let you programmatically process and reply to emails. But it’s a developer tool for automated responses, not a “hit reply in Gmail” solution.

Feature Cloudflare Email Routing SimpleLogin (Self-Hosted)
Cost Free ~$3/month (VPS)
Setup time 5 minutes ~2 hours
Receive to alias Yes Yes
Reply from alias No Yes
Send as alias No Yes
Custom domains Yes (CF nameservers required) Yes (any registrar)
Open source No Yes
PGP encryption No Yes
Self-hosted option No Yes

If all you need is inbound forwarding, stick with Cloudflare. It’s free and it works. But if you want actual email aliases, where you can reply and send and nobody ever sees your real address, you need SimpleLogin.

what you’ll need

Before diving in:

  • A VPS with ports 25, 465, and 443 open (Hetzner, Contabo, etc. — ~$3/month)
  • A domain with DNS you control
  • A Brevo account (free tier: 300 emails/day) for outbound SMTP relay
  • 30 minutes of focus for DNS, plus another hour for the stack

Key Insight: Most residential ISPs and some cloud providers block port 25. Hetzner doesn’t by default, but you might need to request it. Check before you start — no port 25, no self-hosted email.

architecture overview

Here’s how the pieces fit together:

Inbound Email Flow:
Internet → MX Record → Your Server:25 (Postfix) → SimpleLogin App → Your Mailbox

Outbound Email Flow:
SimpleLogin App → Postfix → Brevo SMTP Relay → Recipient

Four containers plus Postfix on the host:

Container Role Port
sl-db PostgreSQL database 5432
sl-app Web UI + API 7777
sl-email Email handler (SMTP) 20381
sl-job-runner Background tasks —

Plus Postfix running directly on the host, listening on port 25.

the DNS gauntlet

DNS is where most people give up. Don’t. It’s just a lot of records. Set them all up at once and verify later.

For a domain like sl.example.com with server IP 203.0.113.50:

A Record

Type: A
Name: sl
Value: 203.0.113.50
Proxy: OFF (DNS only)

MX Record

Type: MX
Name: sl.example.com
Value: sl.example.com
Priority: 10

SPF Record

Type: TXT
Name: sl.example.com
Value: v=spf1 mx a ip4:203.0.113.50 include:spf.sendinblue.com ~all

The include:spf.sendinblue.com is critical — Brevo (formerly Sendinblue) sends your outbound mail through that SPF record.

DKIM Record

Type: TXT
Name: dkim._domainkey.sl.example.com
Value: v=DKIM1; k=rsa; p=YOUR_DKIM_PUBLIC_KEY

You’ll generate this key during Docker setup. Come back and add it then.

DMARC Record

Type: TXT
Name: _dmarc.sl.example.com
Value: v=DMARC1; p=quarantine; pct=100; adkim=s; aspf=s

PTR Record (Reverse DNS)

Set this in your hosting provider’s panel, not your DNS. It maps your IP back to your domain. Most providers have a “Reverse DNS” or “rDNS” field in the server settings.

203.0.113.50 → sl.example.com

Key Insight: If you’re using Cloudflare DNS, the A record for your mail subdomain must be set to “DNS only” (grey cloud). Cloudflare’s proxy doesn’t pass through SMTP traffic on port 25. Orange cloud = your MX record points to Cloudflare’s proxy = mail delivery fails silently.

Cloudflare DNS panel showing all configured records

Verify Everything

Don’t move on until these pass:

# MX record
dig MX sl.example.com +short
# Should return: 10 sl.example.com.

# SPF record
dig TXT sl.example.com +short
# Should include: v=spf1 mx a ip4:203.0.113.50 include:spf.sendinblue.com ~all

# A record
dig A sl.example.com +short
# Should return: 203.0.113.50

# PTR record
dig -x 203.0.113.50 +short
# Should return: sl.example.com.

why Brevo? IP reputation is everything

Why not send directly from Postfix? You can. Gmail, Outlook, and Yahoo will just spam-folder it — or reject it outright.

Email deliverability depends on IP reputation. A fresh VPS IP has none. To the big providers, that looks identical to a spammer on a throwaway server. Building reputation takes weeks of careful warm-up. For a personal alias service sending 10 emails a day, it’s not worth it.

Brevo’s SMTP relay solves this. Your Postfix hands mail to Brevo, and Brevo sends it from IPs with years of established reputation. Your email lands in inboxes, not spam. Free tier: 300 emails/day.

setting up Brevo

Sign up at brevo.com. Then:

  1. Go to Settings > SMTP & API
  2. Generate an SMTP key
  3. Note your SMTP login (it’s your account email, not a generated username)
  4. Add and verify your domain under Settings > Senders & Domains

Brevo SMTP settings page

Save the SMTP key. You’ll need it for both the SimpleLogin env file and Postfix config.

docker setup

SSH into your server. Let’s build this.

Create the Network and Directories

docker network create sl-network

mkdir -p /sl/pgp
mkdir -p /sl/db
mkdir -p /sl/upload

Environment File

Create /sl/simplelogin.env:

# Domain
URL=https://sl.example.com
EMAIL_DOMAIN=sl.example.com
SUPPORT_EMAIL=[email protected]
ADMIN_EMAIL=[email protected]

# Email
EMAIL_SERVERS_WITH_PRIORITY=[(10, "sl.example.com.")]
DKIM_PRIVATE_KEY_PATH=/dkim.key
DKIM_PUBLIC_KEY_PATH=/dkim.pub.key

# Brevo SMTP Relay
POSTFIX_SERVER=host.docker.internal
POSTFIX_PORT=25

# Database
DB_URI=postgresql://sl_user:your_strong_password_here@sl-db:5432/simplelogin

# Flask
FLASK_SECRET=generate_a_long_random_string_here

# Features
DISABLE_ALIAS_SUFFIX=1
NOT_SEND_LINK_TO_SELF=1
ENABLE_SPAM_ASSASSIN=0

# PGP
GNUPGHOME=/sl/pgp

Generate your secrets:

# Flask secret
openssl rand -hex 32

# Database password
openssl rand -hex 16

Generate DKIM Keys

openssl genrsa -out /sl/dkim.key 1024
openssl rsa -in /sl/dkim.key -pubout -out /sl/dkim.pub.key

# Get the public key for your DNS record
cat /sl/dkim.pub.key | sed '1d;$d' | tr -d 'n'

Copy that output. Go back to your DNS and paste it as the p= value in your DKIM TXT record.

Start PostgreSQL

docker run -d 
  --name sl-db 
  --network sl-network 
  --restart always 
  -e POSTGRES_DB=simplelogin 
  -e POSTGRES_USER=sl_user 
  -e POSTGRES_PASSWORD=your_strong_password_here 
  -v /sl/db:/var/lib/postgresql/data 
  postgres:16

Initialize the Database

docker run --rm 
  --name sl-migration 
  --network sl-network 
  --env-file /sl/simplelogin.env 
  -v /sl/dkim.key:/dkim.key:ro 
  -v /sl/dkim.pub.key:/dkim.pub.key:ro 
  simplelogin/app:4.6.5-beta 
  alembic upgrade head

docker run --rm 
  --name sl-init 
  --network sl-network 
  --env-file /sl/simplelogin.env 
  -v /sl/dkim.key:/dkim.key:ro 
  -v /sl/dkim.pub.key:/dkim.pub.key:ro 
  simplelogin/app:4.6.5-beta 
  python init_app.py

Start the Application Containers

# Web app
docker run -d 
  --name sl-app 
  --network sl-network 
  --restart always 
  --env-file /sl/simplelogin.env 
  --add-host=host.docker.internal:host-gateway 
  -v /sl/dkim.key:/dkim.key:ro 
  -v /sl/dkim.pub.key:/dkim.pub.key:ro 
  -v /sl/upload:/code/static/upload 
  -p 127.0.0.1:7777:7777 
  simplelogin/app:4.6.5-beta

# Email handler
docker run -d 
  --name sl-email 
  --network sl-network 
  --restart always 
  --env-file /sl/simplelogin.env 
  --add-host=host.docker.internal:host-gateway 
  -v /sl/dkim.key:/dkim.key:ro 
  -v /sl/dkim.pub.key:/dkim.pub.key:ro 
  -v /sl/upload:/code/static/upload 
  -p 127.0.0.1:20381:20381 
  simplelogin/app:4.6.5-beta 
  python email_handler.py

# Job runner
docker run -d 
  --name sl-job-runner 
  --network sl-network 
  --restart always 
  --env-file /sl/simplelogin.env 
  --add-host=host.docker.internal:host-gateway 
  -v /sl/dkim.key:/dkim.key:ro 
  -v /sl/dkim.pub.key:/dkim.pub.key:ro 
  -v /sl/upload:/code/static/upload 
  simplelogin/app:4.6.5-beta 
  python job_runner.py

Docker containers running healthily

Four containers. All running. But we’re not done — Postfix is the piece that actually handles SMTP.

the Postfix config (and the TLS trap)

This is where I lost two hours. The setup itself is straightforward. The bug that follows is not.

Install Postfix

apt-get update && apt-get install -y postfix postfix-pgsql libsasl2-modules

Choose “Internet Site” when prompted. Set the system mail name to your domain.

Main Configuration

Replace /etc/postfix/main.cf with:

# Basic
smtpd_banner = $myhostname ESMTP
biff = no
append_dot_mydomain = no
readme_directory = no
compatibility_level = 3.6

# TLS - Outbound (Postfix → Brevo)
smtp_tls_security_level = encrypt
smtp_tls_note_starttls_offer = yes
smtp_tls_CAfile = /etc/ssl/certs/ca-certificates.crt
smtp_tls_loglevel = 1

# TLS - Inbound (Internet → Postfix)
smtpd_tls_cert_file = /etc/ssl/certs/ssl-cert-snakeoil.pem
smtpd_tls_key_file = /etc/ssl/private/ssl-cert-snakeoil.key
smtpd_tls_security_level = may

# Network
myhostname = sl.example.com
mydomain = sl.example.com
myorigin = $mydomain
mydestination = localhost
mynetworks = 127.0.0.0/8 [::ffff:127.0.0.0]/104 [::1]/128 172.16.0.0/12
inet_interfaces = all
inet_protocols = ipv4

# Relay through Brevo
relayhost = [smtp-relay.brevo.com]:587
smtp_sasl_auth_enable = yes
smtp_sasl_password_maps = hash:/etc/postfix/sasl_passwd
smtp_sasl_security_options = noanonymous

# Size limits
message_size_limit = 50000000
mailbox_size_limit = 0

# SimpleLogin integration
virtual_mailbox_domains = pgsql:/etc/postfix/pgsql-relay-domains.cf
virtual_mailbox_maps = pgsql:/etc/postfix/pgsql-transport-maps.cf
virtual_alias_maps = pgsql:/etc/postfix/pgsql-transport-maps.cf
transport_maps = pgsql:/etc/postfix/pgsql-transport-maps.cf

The TLS Trap

Here’s what happened. Everything looked right. Containers running. Postfix installed. DNS verified. Sent a test email to my alias.

Nothing arrived.

Checked the Postfix logs:

journalctl -u postfix -n 50
postfix/smtp[12345]: Untrusted TLS connection established to
  smtp-relay.brevo.com[1.2.3.4]:587: TLSv1.3 with cipher
  TLS_AES_256_GCM_SHA384 (256/256 bits)
postfix/smtp[12345]: certificate verification failed for
  smtp-relay.brevo.com: unable to get local issuer certificate

Untrusted TLS connection. Postfix was connecting to Brevo but refusing to send because it couldn’t verify the certificate chain.

The fix? Two lines:

smtp_tls_security_level = encrypt
smtp_tls_CAfile = /etc/ssl/certs/ca-certificates.crt

The CAfile line tells Postfix where to find the system’s CA certificates. Without it, Postfix has no root certificates to verify Brevo’s TLS cert against. It connects, sees an “untrusted” cert, and drops the mail.

If you’re on Ubuntu/Debian and the CA file is missing:

apt-get install -y ca-certificates
update-ca-certificates

Then restart Postfix:

systemctl restart postfix

Two hours. Two lines. Classic.

PostgreSQL Lookup Files

These let Postfix query SimpleLogin’s database to know which domains and addresses to accept.

Create /etc/postfix/pgsql-relay-domains.cf:

hosts = localhost
user = sl_user
password = your_strong_password_here
dbname = simplelogin
query = SELECT domain FROM custom_domain WHERE domain='%s' AND verified=true
  UNION SELECT domain FROM public_domain WHERE domain='%s'
  UNION SELECT '%s' WHERE '%s' = 'sl.example.com' LIMIT 1;

Create /etc/postfix/pgsql-transport-maps.cf:

hosts = localhost
user = sl_user
password = your_strong_password_here
dbname = simplelogin
query = SELECT 'smtp:127.0.0.1:20381' FROM alias WHERE email='%s' AND enabled=true
  UNION SELECT 'smtp:127.0.0.1:20381' FROM custom_domain WHERE domain=split_part('%s', '@', 2) AND verified=true
  UNION SELECT 'smtp:127.0.0.1:20381' WHERE split_part('%s', '@', 2) = 'sl.example.com' LIMIT 1;

SASL Authentication for Brevo

Create /etc/postfix/sasl_passwd:

[smtp-relay.brevo.com]:587 [email protected]:your-brevo-smtp-key

Lock it down and generate the hash:

chmod 600 /etc/postfix/sasl_passwd
postmap /etc/postfix/sasl_passwd

Expose PostgreSQL Port

Postfix runs on the host but needs to reach the Postgres container. Modify the sl-db container to expose the port:

docker stop sl-db
docker rm sl-db

docker run -d 
  --name sl-db 
  --network sl-network 
  --restart always 
  -e POSTGRES_DB=simplelogin 
  -e POSTGRES_USER=sl_user 
  -e POSTGRES_PASSWORD=your_strong_password_here 
  -v /sl/db:/var/lib/postgresql/data 
  -p 127.0.0.1:5432:5432 
  postgres:16

Start Postfix

systemctl restart postfix
systemctl enable postfix

nginx reverse proxy

SimpleLogin’s web UI runs on port 7777. Put Nginx in front for HTTPS.

server {
    server_name sl.example.com;

    location / {
        proxy_pass http://127.0.0.1:7777;
        proxy_set_header Host $host;
        proxy_set_header X-Real-IP $remote_addr;
        proxy_set_header X-Forwarded-For $proxy_add_x_forwarded_for;
        proxy_set_header X-Forwarded-Proto $scheme;
    }
}

Then get a real certificate:

apt-get install -y certbot python3-certbot-nginx
certbot --nginx -d sl.example.com

Certbot rewrites the Nginx config to add SSL and sets up auto-renewal. Done.

first login and lockdown

Go to https://sl.example.com and register your admin account using the email you set as ADMIN_EMAIL in the env file.

Now make yourself premium and lock the door:

# Enter the database
docker exec -it sl-db psql -U sl_user -d simplelogin

# Make your account premium (lifetime)
UPDATE users SET lifetime = true WHERE email = '[email protected]';

# Disable registration so nobody else can sign up
q

Add to your simplelogin.env:

DISABLE_REGISTRATION=1

Restart the app container:

docker restart sl-app

SimpleLogin dashboard with multiple aliases configured

Your instance. Your aliases. Your data.

persistence across reboots

Make sure everything survives a server restart:

# Docker containers (already set with --restart always, but verify)
docker update --restart always sl-db sl-app sl-email sl-job-runner

# Postfix
systemctl enable postfix

# Nginx
systemctl enable nginx

Reboot and verify:

reboot

# After reboot
docker ps
systemctl status postfix
systemctl status nginx

lessons learned

Six things I wish I’d known before starting:

  1. Cloudflare proxy kills mail. The orange cloud proxies HTTP traffic through Cloudflare’s network. SMTP on port 25 doesn’t go through that proxy. Grey cloud (DNS only) or your MX records point nowhere useful.

  2. Brevo domain verification is fussy. Verify your sending domain in Brevo before configuring Postfix. If Brevo doesn’t recognize your domain, outbound mail gets rejected at the relay, not at the destination. Hard to debug.

  3. The TLS CA certificate trap is real. Postfix doesn’t use the system CA store by default. You must explicitly point it to /etc/ssl/certs/ca-certificates.crt. Without this, outbound relay to Brevo fails silently with “untrusted TLS connection” in the logs.

  4. IP reputation matters more than you think. Fresh VPS IPs have zero reputation. Using Brevo as a relay piggybacks on their established reputation. Direct send from a new IP = spam folder.

  5. Pin your Postgres version. Use postgres:16, not postgres:latest. A major version bump (16 to 17) on a container restart will break your data directory without a manual migration.

  6. Use the app image, not app-ci. SimpleLogin publishes both simplelogin/app and simplelogin/app-ci. The app-ci image is for their CI/CD pipeline. Use simplelogin/app with a specific version tag.

the proof

Here’s what the full flow looks like in practice. Send a test email to your alias:

Sending a test email to the SimpleLogin alias

It arrives in your mailbox, forwarded through SimpleLogin. Check the headers — mailed by Brevo’s relay, signed by your domain:

Forwarded email showing Brevo relay and domain signature in headers

Now the real test. Hit reply. The recipient should see your alias, not your real email:

Reply sent from the alias address

Check the headers on the reply. From: your alias. Signed-by: your domain. Your real address is nowhere in sight:

Reply headers confirming alias as sender with TLS encryption

SimpleLogin’s dashboard confirms the reply went through:

SimpleLogin dashboard showing successful reply activity on the alias

browser extension bonus

SimpleLogin also ships a browser extension. Visit any site, click the icon, and create an alias on the fly — no need to open the dashboard:

SimpleLogin browser extension creating an alias on a website

Browser extension showing existing aliases for the current site

Between this and the Dokploy migration, my entire personal infrastructure runs on a single Hetzner box for under $5 a month. Email aliases, five websites, monitoring, backups. All mine. Two hours of setup, one of which was the TLS trap above.

How to Create Architecture Overviews from Existing Code

Most codebases don’t have accurate architecture documentation. Either it was never created, or it drifted so far from reality that nobody trusts it anymore. This creates real problems when onboarding new developers, trying to understand legacy systems, or explaining how things actually work to stakeholders.
The good news? You can generate architecture overviews directly from your existing code. Tools like Documint analyze your codebase and produce actual architecture diagrams without weeks of manual effort.

What is an Architecture Overview?

An architecture overview is a visual and textual representation of how your system is structured. It shows components, their dependencies, and how they interact with each other.
Think of it as a map. Not every detail. Just enough to understand what’s where and how things connect.

The C4 model gives us useful levels to work with here. System Context shows your system in relation to users and external systems. Container level shows the major deployable units. Component level digs into what’s inside each container. Code level gets into classes and functions.
Most architecture overviews live at the Container and Component levels. That’s where the useful abstraction happens.

Why Generate Architecture from Existing Code?

A few reasons this matters:

Faster onboarding. New developers can understand system structure in hours instead of weeks of code archaeology.

No documentation drift. Generated docs reflect actual code, not what someone remembered to update six months ago.

Understanding legacy systems. That codebase nobody fully understands? Now you can actually see how it’s organized.

Visual clarity for teams. Pictures communicate structure faster than anyone explaining it verbally in meetings.

Methods to Create Architecture Overviews from Code

Several approaches exist. They vary significantly in effort required and quality of output.

1. Manual Reverse Engineering

This is the old-school approach. Read the code. Understand it. Draw diagrams by hand or in a tool like Lucidchart.

It works. Eventually. But it’s time-consuming. Error-prone. And it doesn’t scale. A small service might take days. A large codebase? Weeks. And by the time you’re done, the code has changed.

I’ve done this. It’s painful. You learn the system deeply, which has value. But the documentation becomes stale almost immediately.

2. Static Code Analysis Tools

These tools parse your code automatically. They understand structure. Classes, functions, dependencies between files and modules.
Examples include Enterprise Architect and various code analyzers specific to languages.
The limitation? They generate low-level detail without useful abstraction. You get a diagram with 500 nodes and no sense of what actually matters. Technically accurate. Practically useless for understanding architecture.

3. AI-Powered Architecture Generation

Modern approach. LLMs analyze your codebase and generate architecture diagrams at appropriate abstraction levels.

The AI understands not just structure but intent. It can group related components. It can identify the important boundaries. It can produce diagrams humans actually find useful.

Benefits: automated, scalable, provides meaningful abstraction rather than overwhelming detail.

Tools in this space include Documint, CodeBoarding, and Swark. Documint specifically focuses on generating C4-style architecture diagrams from code analysis.

Step-by-Step: Creating Architecture Overviews with Documint

Here’s how to actually do this with Documint.

Step 1: Install and Setup

Documint is available on GitHub. Installation is straightforward.
bash
Copy
pip install documint
Or clone the repository directly if you prefer working from source. Check the GitHub documentation for specific requirements. Python 3.8+ is required. You’ll need an API key for the LLM backend.
Setup involves configuring your API credentials. The docs walk through this clearly.

Step 2: Point to Your Codebase

Tell Documint where your code lives. This can be a local directory or a repository URL.
bash
Copy
documint analyze –path /path/to/your/codebase
For remote repositories, you can point directly to GitHub URLs. The tool clones and analyzes automatically.
Works with monorepos too. Just specify the root directory and let it discover the structure.

Step 3: Configure Analysis Options

Several configuration options matter here.
Language settings tell Documint what you’re working with. It handles multiple languages but knowing the primary stack improves results.
Depth settings control how far into the weeds it goes. System-level overview? Component details? You choose.
Diagram types can be specified. Want only C4 Container diagrams? Only dependency graphs? Configure that upfront.
Configuration lives in a YAML file or command-line arguments. The defaults work reasonably well for most codebases.

Step 4: Generate Architecture Diagrams

Run the generation:
bash
Copy
documint generate –output ./architecture
What comes out depends on your configuration. Typically you get C4 diagrams at multiple levels. System Context showing external boundaries. Container views showing major components. Component diagrams for important modules.
Dependency graphs show what depends on what. Useful for understanding impact of changes.
Output formats include standard image formats, Mermaid code, and structured data you can feed into other tools.

Step 5: Review and Refine

Generated diagrams need human review. Always.
The AI gets structure right. Dependencies are accurate. But naming might be awkward. Groupings might not match how your team thinks about the system. Some components might deserve more prominence than others.
Review with team members who know the system. They’ll catch things that look technically correct but miss important context.

Export to whatever format works for your documentation system. Confluence, Notion, GitHub wikis, whatever. Mermaid output integrates particularly well with markdown-based docs.

Tools for Creating Architecture from Code

The ecosystem has options across different approaches.

AI-Powered Tools

Documint generates C4-style architecture diagrams from codebase analysis, handling abstraction automatically.
CodeBoarding focuses on creating onboarding documentation with architecture context for new developers.
Swark produces software architecture diagrams with emphasis on dependency visualization.
These tools represent the current state of the art. They understand code semantically, not just syntactically.

Diagram-as-Code Tools

Structurizr DSL lets you define C4 architecture in code, keeping diagrams version-controlled alongside your system.
PlantUML handles various diagram types with text-based definitions. Flexible but requires manual authoring.
Mermaid integrates directly into markdown. Good for documentation that lives in repos.
When to use these: when you want tight control over diagram content, or as output format from AI-powered analysis. They’re authoring tools, not analysis tools.

Static Analysis Tools

Enterprise Architect provides comprehensive modeling with reverse engineering from code.
Doxygen generates documentation including call graphs and dependency information.

Traditional approaches. They work. But they produce detailed technical diagrams rather than architectural understanding. The output often needs significant manual curation to be useful.

Best Practices

Start with High-Level Views First

Begin with System Context. What does your system interact with? Users, external services, other internal systems.

Then move to Container level. What are the major deployable pieces?
Only then dig into Components for areas that need detail.

Resist the urge to show everything immediately. Overwhelming diagrams communicate nothing. Start simple. Add detail where it matters.

Validate Generated Architecture

AI-generated diagrams need verification. The tool sees code structure. It doesn’t know your team’s mental model of the system.

Review outputs with people who know the system well. They’ll spot groupings that don’t make sense. Components named awkwardly. Missing context that matters.

Treat generated architecture as a starting point, not final output.

Keep Documentation Updated

Re-generate periodically. Monthly? After major features? Pick a cadence that works.

Better yet, integrate into CI/CD. Generate architecture docs on main branch merges. Treat documentation as code. Version it. Review changes.
Documentation that updates automatically doesn’t drift. That’s the whole point.

Combine with Architecture Decision Records (ADRs)

Visual diagrams show what exists. ADRs explain why.
Why did we choose this database? Why are these services separate? Why does authentication work this way?

Architecture diagrams plus ADRs give complete context. Structure and reasoning together. New team members understand not just the current state but the decisions that created it.

Common Challenges and Solutions

Large Codebase Complexity

Problem: Generated diagrams become overwhelming. Hundreds of components. Thousands of dependencies. Nobody can parse it.

Solution: Break analysis into subsystems. Focus on specific modules or services. Use filtering to show only what’s relevant for a particular question. Nobody needs the entire system in one diagram.

Generate multiple focused views rather than one comprehensive mess.

Missing Context

Problem: Code shows structure but not intent. The diagram is accurate but doesn’t explain why things are organized this way.

Solution: Supplement with human annotations. Add notes explaining key decisions. Combine generated diagrams with existing documentation where it exists and remains accurate.

Architecture diagrams show the “what.” Humans still need to provide the “why.”

Tool Integration

Problem: Another tool that doesn’t fit existing workflow. Developers won’t use it if it’s friction.

Solution: CI/CD integration so generation happens automatically. IDE plugins for on-demand views. Automated regeneration means nobody has to remember to run anything.

Make architecture documentation a side effect of normal development, not a separate task people have to schedule.

What tools can automatically generate architecture diagrams from code?

Documint analyzes codebases and generates C4-style architecture diagrams using AI. CodeBoarding creates onboarding documentation with architecture context. Swark focuses on dependency visualization and software architecture. Structurizr works with manually defined architecture-as-code.

How long does it take to create architecture documentation from existing code?

With AI-powered tools like Documint, minutes to a few hours depending on codebase size. Analysis runs quickly. Review and refinement take longer but you’re starting from something useful.

Manual approaches take days to weeks for any significant codebase. And then it starts drifting immediately.

Can AI accurately generate software architecture from code?

Yes, with validation. AI analyzes structure and dependencies accurately. It identifies components and their relationships from actual code, not guesses.

But AI doesn’t know your team’s intent or mental model. Generated architecture needs human review to verify it matches how you think about the system. Accuracy of structure is high. Appropriateness of abstraction needs human judgment.

What diagram types can be generated from source code?

C4 diagrams at various levels: System Context, Container, Component. Dependency graphs showing what relies on what. Class diagrams for detailed code structure. Sequence diagrams for interaction flows. State machines where code makes states explicit.

Different tools support different diagram types. C4 and dependency graphs are most common for architecture overviews.

Do I need to modify my code to generate architecture documentation?

No. Tools analyze existing code as-is. No annotations required. No special comments. No configuration embedded in source files.

Point the tool at your repository and it figures out the structure. That’s the whole point. Documentation from code that already exists, not code modified to support documentation.

Synchronization in Node.js: Why Single-Threaded Does Not Mean Safe From Concurrency Problems

One of the most common misconceptions about Node.js is:

“Node.js is single-threaded, so synchronization problems cannot happen.”

This is only partially true.

Yes, JavaScript execution in Node.js runs on a single thread using the event loop. But modern backend applications deal with asynchronous operations, external services, databases, queues, and distributed systems — all of which introduce concurrency challenges.

Understanding synchronization in Node.js is essential if you want to build scalable and reliable backend systems.

What Is Synchronization?

Synchronization is the process of controlling access to shared resources when multiple operations happen at the same time.

The goal is to prevent:

  • Race conditions
  • Data inconsistency
  • Duplicate processing
  • Lost updates
  • Unexpected behavior

Why Synchronization Still Matters in Node.js

Node.js applications commonly handle:

  • Multiple API requests simultaneously
  • Concurrent database updates
  • Shared cache access
  • Async file operations
  • Background job processing

Even though JavaScript itself runs on one thread, async operations can overlap in execution timing.

This creates situations where multiple operations interact with the same resource concurrently.

Example: Race Condition

Imagine a wallet service:

Initial balance = ₹1000

Two requests arrive:

  • Request A deducts ₹300
  • Request B deducts ₹500

If both requests:

  1. Read the same balance
  2. Update independently
  3. Save the result

…the final balance may become incorrect.

This is called a race condition.

Common Synchronization Techniques in Node.js

1. Database Transactions

Transactions ensure operations execute safely as a single unit.

Useful for:

  • Payment systems
  • Banking workflows
  • Order processing

2. Atomic Operations

Databases provide atomic update mechanisms.

Examples:

  • MongoDB $inc
  • PostgreSQL row locking
  • Optimistic locking

These reduce concurrency conflicts.

3. Redis Distributed Locks

In distributed systems, Redis locks help ensure only one worker processes a task at a time.

Commonly used in:

  • Payment handling
  • Cron jobs
  • Distributed workers

4. Mutexes

Mutexes restrict access to critical sections of code.

Only one async operation can enter at a time.

5. Message Queues

Queues serialize workloads and reduce concurrency problems.

Popular tools:

  • BullMQ
  • RabbitMQ
  • Kafka

Important Takeaway

Single-threaded does NOT mean concurrency-safe.

As applications scale, synchronization becomes critical for:

  • High-traffic APIs
  • Financial systems
  • Real-time platforms
  • Distributed architectures

The real complexity in backend engineering often comes from handling concurrency correctly.

Conclusion

Node.js provides excellent performance through asynchronous and non-blocking architecture.

But scalable backend systems still require proper synchronization strategies to maintain correctness and reliability.

Understanding concurrency is what transforms developers into backend engineers capable of designing production-grade systems.

NodeJS #JavaScript #BackendDevelopment #SystemDesign #Concurrency #SoftwareEngineering #Programming #DistributedSystems #WebDevelopment #Tech #codewithishwar

AI Coding Tools Need Better Boundaries, Not Better Prompts

One thing becoming increasingly obvious with AI-assisted development:

LLMs are great at generating code.
They’re not great at making architectural decisions.

A lot of teams are discovering the same pattern:

  • rapid prototyping feels amazing,
  • shipping gets faster,
  • but long-term maintainability starts degrading quietly in the background.

The problem usually isn’t the generated code itself.

It’s the lack of:

  • clear contracts,
  • deterministic workflows,
  • validation layers,
  • and shared engineering conventions before generation even starts.

Without those boundaries, AI tends to optimize for local correctness instead of system consistency.

That’s why workflows like Spec-Driven Development (SDD) are becoming more relevant as teams integrate AI deeper into production environments.

Instead of relying on increasingly complex prompts, SDD focuses on:

  • defining contracts first,
  • validating specs before implementation,
  • constraining generation scope,
  • and treating LLMs more like implementation engines than autonomous architects.

In practice, this tends to produce:

  • more predictable outputs,
  • cleaner collaboration between engineers,
  • and codebases that are actually maintainable months later.

We’ve been exploring this topic internally and recently put together a breakdown of how Spec-Driven Development can help create more reliable AI-assisted workflows in real-world engineering environments.

If the topic sounds interesting, here’s the discussion:

Stop “Vibe Coding” and Start Spec-Driven Development | Part 1

Curious how other teams here are approaching this shift:

  • Are you introducing stricter boundaries around AI-generated code?
  • Have specs become more important in your workflow?
  • Or are you still experimenting with prompting strategies first?

Feels like the industry is slowly moving from: “AI can generate code”

to: “How do we engineer systems around probabilistic generators?”

And that’s a much more interesting problem…

11 Agentic Testing Tools to Know in 2026

Agentic testing tools help teams plan, generate, adapt, and run tests with far less manual effort. They’re quickly becoming part of how modern QA scales without slowing delivery.

One thing to get right from the start is scope. Not all agentic testing tools operate at the same level of scope or strategic impact. They vary significantly in what they do and where they fit. Some are point solutions that help you author or run tests faster. Others sit inside broader AI-driven quality platforms that prioritize risk, optimize test portfolios, and enforce quality gates across the pipeline.

This post covers 11 agentic testing tools to know about in 2026. They’re grouped so you can compare them based on scope, strengths, and fit for your organization.

What is an agentic testing tool?

An agentic testing tool is software that uses AI agents to autonomously plan, generate, maintain, and execute tests. It often makes decisions based on context, such as requirements, code changes, risk signals, or past results.

It goes beyond AI-assisted automation by adding initiative and workflow-level decision-making. Instead of only suggesting what to do next, it takes action within defined boundaries.

Here are 11 agentic testing tools grouped by scope. Each includes a summary and key strengths and considerations. Let’s go!

Enterprise AI-driven quality platforms

These platforms extend beyond test creation to orchestrate automation, intelligence, and governance at scale. They are suited for organizations that require stability, risk prioritization, and release confidence across complex environments.

1. Tricentis Tosca

Tricentis Tosca is designed for enterprise test automation where stability, scale, and governance matter. In an agentic context, the shift is moving from “write and maintain scripts” to “orchestrate outcomes,” especially across complex apps and high-change environments.

Tricentis enables AI-driven testing and agentic quality engineering across your delivery pipeline. It also positions MCP as a way to bridge AI and testing tools through a universal integration approach, which matters if you’re thinking about agentic workflows that span multiple systems.

Strengths

  • Suitable for large regression suites and complex end-to-end workflows.

  • AI-assisted resilience helps reduce long-term maintenance costs.

Considerations

  • The highest value shows up when teams commit to governance and standardization (not “ad hoc scripts”).

  • Adoption typically requires alignment across QA, engineering, and release stakeholders.

2. SmartBear

SmartBear is best viewed as a broad testing portfolio vendor that has been positioning around AI across testing workflows.

Strengths

  • Covers multiple testing disciplines.

  • Suitable for consolidated vendor strategies.

Considerations

  • AI depth varies across products.

  • Portfolio integration matters.

3. UiPath Test Suite

UiPath Test Suite extends testing into broader automation ecosystems. In an agentic context, it is relevant for teams that want testing integrated into AI-driven business process automation and orchestration environments.

Strengths

  • Aligns testing with broader automation initiatives.

  • Fits organizations standardizing around enterprise automation platforms.

Considerations

  • Strongest value when already invested in the UiPath ecosystem.

  • Organizations must evaluate how deeply autonomous testing workflows integrate with CI/CD.

AI-native testing platforms

AI-native testing platforms are built with AI at the core of test creation and execution workflows. They aim to reduce friction from requirements to automation and help teams maintain speed and stability as systems evolve.

4. ACCELQ

ACCELQ positions itself around AI-powered automation and end-to-end testing acceleration. For agentic buyers, the key question is whether the platform reduces friction from requirements to automation to execution and whether it can keep pace as systems change.

Strengths

  • Faster ramp-up for automation.

  • Structured automation workflows.

Considerations

  • Like any platform, success depends on fit with your stack and operating model.

  • Ensure governance and explainability are strong enough for enterprise release standards.

5. mabl

mabl is an AI-native testing vendor geared toward continuous testing and reducing maintenance overhead. For agentic tool evaluation, focus on whether AI helps you run reliably at speed, not just generate tests during setup.

Strengths

  • CI/CD integration.

  • Automation resilience focus.

Considerations

  • Primarily web-centric workflows.

  • Enterprise governance depth varies.

6. Functionize

Functionize is commonly positioned as AI-forward test automation focused on reducing manual work across authoring, execution, and maintenance. In a practical agentic sense, tools like this aim to do more of the work for you, especially around test upkeep as systems evolve.

Strengths

  • Lifecycle focus: value isn’t only authoring, but also keeping tests healthy over time.

  • AI-forward orientation fits teams pushing toward higher autonomy.

Considerations

  • Scope depends on team maturity.

  • Organizations may need to evaluate governance needs more deeply.

Point-solution agentic tools

Point-solution agentic tools focus on solving a specific testing bottleneck rather than managing the full quality lifecycle. They are often used to accelerate test authoring, execution, or UI interaction without requiring a broader platform shift.

7. testRigor

testRigor is typically associated with natural-language-driven test creation and reducing scripting complexity. For agentic buyers, it often lands in the “make authoring easier” category.

Strengths

  • Lower barrier to authoring.

  • Rapid initial automation.

Considerations

  • Primarily focused on UI regression.

  • Potential trade-off between depth and creation speed.

8. QA Wolf

QA Wolf is often positioned around fast test creation and managed execution models for teams that want results without building everything in-house. In an agentic tooling conversation, this fits as a way to compress time-to-value, especially when internal bandwidth is limited.

Strengths

  • Fast time to coverage.

  • Managed execution support.

Considerations

  • The operational model differs from in-house-only tools.

  • Evaluate long-term scaling fit.

9. Virtuoso QA

Virtuoso is frequently grouped with AI-led UI testing approaches that aim to reduce manual scripting and increase resilience. Its relevance depends on whether it meaningfully adapts and maintains tests as the app changes, not just how quickly it creates them.

Strengths

  • Faster UI automation creation.

  • Reduced scripting complexity.

Considerations

  • Validate the reality of flake handling and maintenance in your environment (dynamic UIs expose gaps quickly).

  • Ensure pipeline integration and evidence output meet enterprise needs.

10. AskUI

AskUI approaches automation through UI perception and interaction. That can matter when you test across varied front ends, remote desktops, or environments where DOM-level automation is not always feasible.

Strengths

  • Useful for UI-driven automation challenges.

  • Works across heterogeneous UI surfaces.

Considerations

  • Typically narrower in scope than end-to-end platforms.

  • Validate stability and evidence outputs for long-running regression usage.

11. CoTester by TestGrid

CoTester lands in the agentic assistant space for testing workflows. Tools in this category typically let you offload specific tasks, helping your team by generating tests, suggesting validations, or scaling coverage with less effort.

Strengths

  • Assistant-style support for testing tasks.

  • Accelerates defined QA activities.

Considerations

  • Not a full end-to-end platform.

  • Best as a complementary capability.

How agentic technology applies to modern testing

Agentic testing brings the agent loop into quality workflows. It decides what to test, executes the work, evaluates results, and adjusts based on context.

Here’s what that looks like in real delivery pipelines:

  1. Planning: Interpreting requirements, code changes, and risk signals to select the right tests.

  2. Execution: Running tests and collecting evidence.

  3. Adaptation: Repairing brittle selectors and managing flakiness as systems change.

  4. Governance: Enforcing quality gates based on measurable signals such as coverage and change impact.

Agentic testing is not AI that writes tests. It is AI that runs a quality workflow.

How to choose the right agentic testing tool

Buying decisions usually fail for one of two reasons: teams choose a point tool when they actually need a platform, or they buy a platform when they need quick, targeted relief. Use this checklist to avoid both mistakes.

1. Start with scope: assistant, point solution, or platform?

Ask one blunt question: Do you need help authoring tests, or do you need help governing release confidence?

2. Demand measurable outcomes, not demos

Demos can look impressive, but real value shows up in production metrics. Look for clear improvements in regression time, maintenance effort, flake rate, defect escapes, and coverage visibility. If success cannot be measured, ROI will be hard to prove.

3. Validate governance: explainability, auditability, control

Agentic systems take action, so your team must understand why. You should be able to explain test selection, recent changes, and the evidence behind a release decision, especially in regulated and enterprise environments.

If you want agentic testing that scales beyond a single team or application, you need more than a test generator. You need an AI-driven approach that connects automation, intelligence, and governance.

FAQ: Agentic testing tools in 2026

What makes a testing tool truly agentic?

A testing tool is truly agentic if it can independently plan and execute testing actions based on context, such as code changes, requirements, or risk signals. It does not just suggest next steps. It selects tests after a pull request, generates tests from requirements, repairs broken locators, and enforces quality gates with minimal human input.

Are agentic testing tools the same as AI test automation?

No. AI test automation typically assists with parts of automation, such as smarter locators or faster script creation. Agentic testing tools go further by automating decision-making across workflows. They can decide which tests to run for a build, identify untested code changes, and prioritize high-risk areas without manual triage.

What results should I expect from agentic testing?

Most teams see measurable improvements in regression cycle time and maintenance effort when agentic workflows are implemented correctly. A realistic benchmark is reducing regression runtime by 30–70% through change-based test selection and cutting maintenance effort by 30–50% through self-healing automation and flake reduction.

I Replaced a Polling Loop With Three React Hooks and a Firestore Rule

The first version of the VORTEX dashboard polled an API endpoint every five seconds. It worked. It also meant the UI was always up to four seconds behind reality, and every agent write to Firestore required a separate read path just to surface it on screen. I replaced the whole thing with three custom hooks and onSnapshot listeners. The dashboard has been real-time since, with no polling, no message queue, and no separate read model.

The Data Model First

Before writing a single hook, I mapped out exactly which Firestore collections existed and who owned them:

Collection Writers Readers
leads Agent 1, Agent 7 Dashboard, Agent 4
activity_feed All agents (append only) Dashboard
product_intelligence Agent 6 Dashboard
agent_logs All agents Dashboard (Debate Log)

This table is the reason the security rules look the way they do:

// firestore.rules
match /activity_feed/{eventId} {
  allow read:   if true;
  allow create: if true;    // All agents append
  // No update, no delete — the feed is append-only by design
}

match /leads/{leadId} {
  allow read:  if request.auth != null;
  allow write: if request.auth != null;
}

The activity_feed collection is append-only deliberately. No agent ever updates or deletes a feed entry. This means the feed is a reliable audit trail of what happened, in order — you can replay it from any point without worrying about entries being mutated after the fact.

The Three Hooks

The entire dashboard data layer is three hooks: useLeads, useActivityFeed, and useProductIntel. Each one owns one collection and one onSnapshot listener.

// hooks/index.jsx — useLeads
export function useLeads() {
  const [leads, setLeads] = useState(INITIAL_LEADS);

  useEffect(() => {
    const q = query(
      collection(db, 'leads'),
      orderBy('intent_score', 'desc'),
      limit(50)
    );
    return onSnapshot(q, (snapshot) => {
      const fbLeads = snapshot.docs.map(doc => ({
        id: doc.id,
        ...doc.data(),
      }));
      if (fbLeads.length > 0) setLeads(fbLeads);
    });
  }, []);

  return leads;
}

Three things worth noting here:

The if (fbLeads.length > 0) guard. Without this, an empty Firestore collection on first load would wipe the seed data. The hook falls back to INITIAL_LEADS — a hardcoded set of mock leads — until real data arrives. This means the dashboard is never blank, even before Firebase is configured.

onSnapshot returns its own unsubscribe function. Returning it directly from useEffect means React calls it on unmount, cleaning up the listener automatically. No manual cleanup needed.

orderBy('intent_score', 'desc') means the Kanban always shows highest-intent leads first within each column, without any client-side sorting logic.

The activity feed hook is similar but has a time-based limit instead:

// hooks/index.jsx — useActivityFeed
export function useActivityFeed() {
  const [events, setEvents] = useState(INITIAL_EVENTS);

  useEffect(() => {
    const q = query(
      collection(db, 'activity_feed'),
      orderBy('timestamp', 'desc'),
      limit(20)
    );
    return onSnapshot(q, (snapshot) => {
      const fbEvents = snapshot.docs.map(doc => ({
        id: doc.id,
        ...doc.data(),
      }));
      if (fbEvents.length > 0) setEvents(fbEvents);
    });
  }, []);

  return events;
}

Twenty events, most recent first. Every agent write to activity_feed triggers this listener and the feed item appears in the UI within milliseconds.

The Metrics Hook Problem

useMetrics caused the most grief. The original version returned an array:

// The version that broke everything downstream
export function useMetrics(leads) {
  return useMemo(() => [
    { label: "Total Leads", value: leads.length, trend: "+12%" },
    { label: "Hot Leads Today", value: hotLeads, trend: "+5" },
    // ...
  ], [leads]);
}

Six components consumed this hook. Three of them destructured it as an array. Three treated it as a named object — metrics.totalLeads, metrics.hotLeads, metrics.conversionRate. The array-consuming components worked. The object-consuming components silently got undefined for every value and displayed nothing.

The fix was making useMetrics return a proper object:

export function useMetrics(leads) {
  return useMemo(() => {
    const totalLeads = leads.length;
    const hotLeads = leads.filter(l => l.status === 'HOT_LEAD').length;
    const conversionRate = 12.4;
    const highestScoreLead = leads.reduce(
      (max, l) => (!max || l.intent_score > max.intent_score ? l : max),
      null
    );
    return {
      totalLeads,
      hotLeads,
      emailsSent: 312,
      callsPlaced: 89,
      demosBooked: 12,
      conversionRate,
      highestScore: highestScoreLead?.intent_score || 0,
      highestScoreLead,
    };
  }, [leads]);
}

The lesson: if a hook returns structured data that multiple components consume, make it a named object from day one. Arrays are fine for lists. They’re not fine for typed data shapes where consumers care about specific fields.

The useCountUp Hook

The sidebar metrics animate from zero to their real value on load. That required a useCountUp hook — something the codebase was importing but that didn’t exist yet.

export function useCountUp(target, duration = 1000) {
  const [value, setValue] = useState(0);
  const rafRef = useRef(null);

  useEffect(() => {
    const start = performance.now();
    const to = Number(target) || 0;

    const tick = (now) => {
      const elapsed = now - start;
      const progress = Math.min(elapsed / duration, 1);
      const eased = 1 - Math.pow(1 - progress, 3); // ease-out cubic
      setValue(Math.round(to * eased));
      if (progress < 1) rafRef.current = requestAnimationFrame(tick);
    };

    rafRef.current = requestAnimationFrame(tick);
    return () => cancelAnimationFrame(rafRef.current);
  }, [target, duration]);

  return value;
}

Ease-out cubic means the number counts up fast at first and slows as it approaches the target. requestAnimationFrame keeps it tied to the display refresh rate rather than a fixed interval. The rafRef holds the animation frame ID so the cleanup function can cancel it properly on unmount — without this, switching tabs mid-animation would leave a hanging rAF loop.

The StrictMode Bug

React’s StrictMode runs effects twice in development — mount, unmount, remount. This exposed a bug in the DebateTerminal component that replays the Hindsight agent log line by line:

// The broken version
useEffect(() => {
  let idx = 0;
  const show = () => {
    if (idx >= allLines.length) return;
    setDisplayed(prev => [...prev, allLines[idx]]);
    idx++;
    setTimeout(show, 60); // recursive — never cleaned up
  };
  const t = setTimeout(show, 300);
  return () => clearTimeout(t); // only cancels the first timeout
}, []);

The cleanup only cancelled the initial 300ms delay. Once show started calling itself recursively, those timeouts had no handle. In StrictMode, the simulated unmount left the first chain running, then the remount started a second chain. Two parallel loops, both writing to displayed state with independent idx counters, producing duplicate and out-of-order lines.

The fix was storing every timeout ID in a ref:

const timeoutRef = useRef(null);

useEffect(() => {
  let idx = 0;
  const show = () => {
    if (idx >= allLines.length) { setPlaying(false); return; }
    const line = allLines[idx];
    setDisplayed(prev => [...prev, line]);
    idx++;
    timeoutRef.current = setTimeout(show, line.isHeader ? 400 : 60);
  };
  timeoutRef.current = setTimeout(show, 300);
  return () => clearTimeout(timeoutRef.current); // cancels the whole chain
}, []);

Now the cleanup always cancels whichever timeout is currently pending. The chain breaks cleanly on unmount.

Seed Data as the Demo Mode

The hooks layer has a deliberate fallback: if Firestore returns empty or throws, the UI renders from INITIAL_LEADS and INITIAL_EVENTS. This means the entire dashboard works without a Firebase project configured — useful for demos, useful for development, useful when the backend is down.

const [leads, setLeads] = useState(INITIAL_LEADS); // fallback always set first

return onSnapshot(q, (snapshot) => {
  const fbLeads = snapshot.docs.map(doc => ({ id: doc.id, ...doc.data() }));
  if (fbLeads.length > 0) setLeads(fbLeads); // only overwrite if real data exists
});

The VITE_USE_DEMO_DATA environment flag extends this further — when set, the Firebase initialization is skipped entirely and the hooks return seed data without attempting any Firestore connection.

Takeaways

onSnapshot is simpler than it looks. It returns its own cleanup function, it handles reconnection automatically, and it pushes updates to all listeners simultaneously. For a dashboard that needs to reflect agent writes in real time, it’s the right tool and it requires less infrastructure than a polling setup.

Return named objects from data hooks, not arrays. The useMetrics bug would have been caught immediately with TypeScript. Without it, the silent undefined failures are hard to trace because the component renders without errors — it just shows nothing.

StrictMode is a useful stress test. The DebateTerminal bug only appeared in development because of StrictMode’s double-invoke behavior. That’s the point — it surfaces cleanup bugs before they reach production.

Seed data is infrastructure. Having realistic fallback data in the hooks layer means the dashboard is always demonstrable, always developable, and always recoverable. It’s not a hack — it’s a design decision.

Closing

The dashboard started as a polling loop hitting a REST endpoint. It’s now three hooks, each owning one Firestore collection, each cleaning up after itself on unmount. The real-time behavior came for free once the data model was right. The hard part wasn’t the Firestore integration — it was making the hooks clean enough that six different components could consume them without knowing anything about the underlying data source.