In my last articles, How to install RabbitMQ and Unraveling RabbitMQ we installed and deep dived into RabbitMQ, one of the most popular and mature message brokers in the open-source ecosystem. Its capability to handle queues, routes, and message publish/subscribe functionality is essential to ensure asynchronous communication, resilience, and scalability in modern applications.
In this article, I present you the RabbitMQ Management interface. This is a user-friendly web interface that allows operators to monitor and configure the RabbitMQ Server from a web browser. This is a practical guide on how to get the most out of this web interface, which transforms broker management into a transparent and controllable task.
This article will guide you to:
- Access and navigate the management dashboard.
- Monitor crucial metrics, such as message rates, node status, and overall system health.
- Manage and interact with essential entities like Connections, Channels, Exchanges, and Queues.
- Use the administrative tools to configure Virtual Hosts (VHosts), Users, and Permissions.
The Management interface
After starting RabbitMQ, you can monitor and manage it from the administration console. The web interface operates on port 15672 and you can access it by the URL: http://localhost:15672/ . Use the defaultcredentials: username: guest and password: guest to login for the first time.
It is strongly recommended that these default credentials be modified immediately in any non-development environment.
From RabbitMQ Management it is possible to:
- Manage exchanges, queues, bindings, users, virtual hosts, policies, runtime parameters and user permissions.
- Export and import schema (vhosts, users, permissions, queues, exchanges, bindings, parameters, policies).
- Monitor queue length, message rates, resource usage of queue, node GC activity, data rates of client connections, and more.
- Force close client connections, purge queues.
- Send and receive messages for debugging.
- Monitor node resource use: sockets and file descriptors, memory usage breakdown, available disk space, and bandwidth usage on inter-node communication links.
The overview page
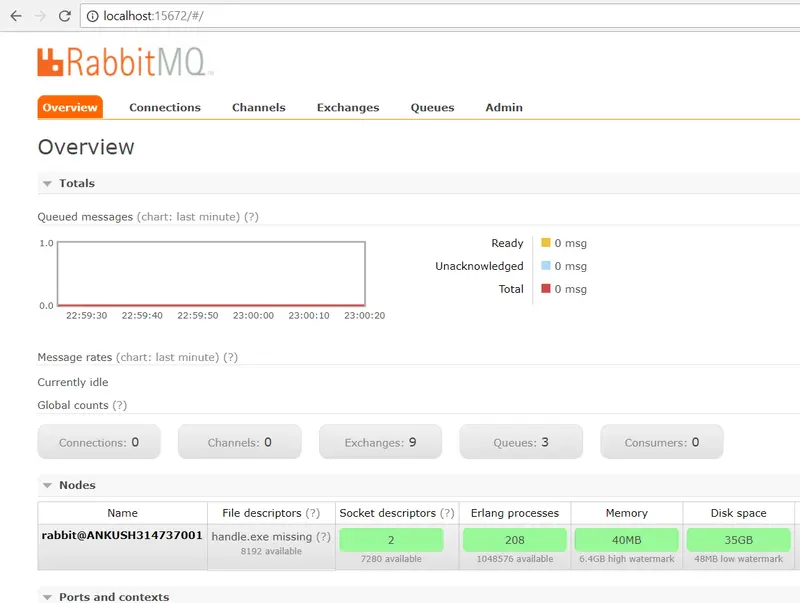
After logging in, the Overview page is the default landing screen, presenting a real-time assessment of the broker’s operational state and performance metrics. You will see the following stats:

The Overview page displays 2 charts: The current Queued Messages volume and the Messages Rate.
The time series displayed in these charts can be adjusted (e.g., last minute, last hour) for historical analysis. Information about all the different states of the messages can be found by pressing ? link.

Queued messages: This graph shows the total number of messages in all Queues. These statistics are essential to identify message backlogs and potential throughput limitations.
-
Ready: Indicates the number of messages that are currently available for delivery and consumption by connected consumers.
-
Unacked: The number of messages that server is waiting for confirmation. Represents messages that have been delivered to a consumer but the server has not yet received a positive acknowledgment (ACK). These messages are retained for potential redelivery, ensuring message reliability.
-
Total: The total number of messages queued in all Queues, calculated as the sum of Ready and Unacked messages.
Messages rate: The chart shows the rate of processing messages, typically measured in messages per second. This is a primary indicator of system performance and workload.
-
Publish: Displays the rate at which producers are submitting new messages to the server/broker.
-
Publisher confirm: Indicates the rate at which the server is confirming receipt of messages back to the producers. Applicable when the publisher confirm mechanism is used.
-
Deliver (manual ack) / Deliver (auto ack): Displays the delivery rate of messages from queues to consumers, segregated based on whether the consumer requires manual acknowledgment (
manual ack) or utilizes automatic acknowledgment (auto ack).
-
Get (manual ack) / Get (auto ack): Displays the rate at which consumers are actively fetching messages from the queue using the
basic.get method, also categorized by acknowledgment mode.
-
Redelivered: The rate at which the server/broker is resending messages to consumers, typically following connection interruptions or negative acknowledgments (NACKs).
-
Disk read/write: The frequency of disk I/O operations (reads and writes) executed by the broker, primarily related to managing persistent messages and durable queue data.
Global Count: Static panel that provides instantaneous totals for key operational entities. It summarizes the count of all active Connections, Channels, Exchanges, Queues, and Consumers across ALL virtual hosts, offering a rapid assessment of current resource utilization.
Nodes
Provides critical system-level details for each Node operating within your RabbitMQ cluster. A cluster is essentially a logical grouping of RabbitMQ server instances running on separate machines or processes. Monitoring these metrics is vital for capacity planning and troubleshooting performance issues across the cluster.
Here you can observe key resource utilization statistics:
-
Memory: Displays the amount of system memory currently consumed by the node.
-
Erlang Processes: Shows the total number of underlying Erlang processes running on the node. RabbitMQ is built on Erlang, and managing this count is essential as there is a finite limit to the number of processes a node can handle.
-
Disk Space: Indicates the remaining available disk space on the host machine. If disk space drops below a defined watermark, the broker may block producers to prevent data loss.
-
Uptime: Displays the duration since the RabbitMQ node was last started.

Churn statistics
Displays the rate of new (created) or closed (closed) connections, channels, and queues.
“Churn” refers to the velocity at which these resources are instantiated and destroyed in the broker. High churn rates can sometimes indicate issues with client connection management or rapid scaling events.
This panel displays the rate (per second) of:
-
Connections: New client connections being opened or existing connections being closed.
-
Channels: Channels being created or shut down within connections.
-
Queues: Queues being created or deleted.

Ports and contexts
This simple but important section serves as a reference for network configuration. Here you can find the network interfaces and listening ports configured for various protocols that RabbitMQ uses to communicate with clients and other nodes.
You can quickly verify the ports used for:
- AMQP (standard client connections)
- HTTP (management interface)
- Inter-node communication (clustering)

Import export definitions
It is possible to import and export definitions to configure all information of the RabbitMQ broker. This functionality is crucial for configuration management, backup, and restoration. It allows the complete definition of the RabbitMQ broker’s state to be exported or imported as a single artifact.

Exporting the definitions, we get a JSON file representing the broker (RabbitMQ). This can be used to restore Exchange, Queue, virtual host, policy, user, etc. This feature can be used as a backup. Every time you change the configuration, you can keep the old settings to restore when needed.
When definitions are exported, we get a JSON file that encapsulates the entire configuration of the broker. This file includes all defined Exchanges, Queues, Virtual Hosts, Policies, Users, and Permissions. This feature can serve as backup mechanism and for replicating configurations across development, staging, and production environments. It ensures consistency and allows quick rollback to previous settings state in case of issues.
Connections
A RabbitMQ Connection is a TCP connection between the application and the RabbitMQ broker. This connection acts as the secure and stable pipe through which all messaging traffic flows. When the client disconnects for any reasons, or a system failure occurs, the underlying TCP connection will be terminated and closed by the broker.
The Connections page provides a list of active connection to the RabbitMQ server.
Key details displayed for each connection include:
-
Overview: Displays essential metadata, such as the client IP address (source), the username used for authentication, and the current Connection Status (e.g., running, blocked).
-
Channels: Indicates the current number of Channels that have been opened and are actively running within this specific connection.
-
SSL/TLS: A flag indicating whether the connection is utilizing SSL/TLS encryption for secure data transmission.

Clicking on one of the connections, you will get an overview of that specific connection, and view channels in connection and data rate. You can see the Client properties and close the connection if you want (Force Close).
-
View Channels: The list of all active channels currently multiplexed over this connection.
-
Data Rate: The current inbound and outbound message and byte traffic rates associated with the connection.
-
Client Properties: Metadata provided by the connecting application, such as the application name, version, and client library used.
-
Force Close: Manually terminate the connection. This administrative action is useful for troubleshooting unresponsive clients or managing resource utilization.


Channels
A RabbitMQ Channel is a virtual connection inside a connection. It reuses a connection, to avoid the need to reauthorize and open a new TCP stream. When messages are published or consumed, it is done over a channel. Many channels can be established within a single connection.
The Channels page displays information about all current Channels: Displays the username the user is associated with the channel, connection status, confirmation, Message exchange rate, etc..

If you click on one of the Channels, you will get a detailed overview of that Channel.

Exchanges
The RabbitMQ Exchange entity is in charge of applying routing rules for messages, making sure that messages are reaching their final destination. In other words, the exchange ensures that the received message ends up in the correct queues. Which queue the message ends up in depends on the rules defined by the exchange type. A queue needs to be bound to at least one exchange to be able to receive messages.
Routing rules include:
-
Direct (point-to-point): a message goes to the queue(s) with the binding key that exactly matches the routing key of the message.
-
Topic (publish-subscribe): route messages to queues based on wildcard matches between the routing key and the routing pattern, which is specified by the queue binding.
-
fanout (multicast): ignores routing key and broadcast a message to all queues.
-
header exchanges: similar to topic exchanges, but route messages based on header values instead of routing keys.
All Exchanges can be listed from the Exchange tab.
-
Name: displays the name of the Exhange created.
-
Type: is the type of Exchange like direct, topic, fanout and header.
-
Feature: displays parameters for Exchange (eg: D is durable, and AD is auto-delete).
-
Message rate in/out: Rate of processing incoming and outgoing Messages.
In this list there are several Exchange amq.* and Default Exchange (default exchange unnamed), which are created by default.

It is possible to add a new Exchange in this page:

By clicking on the Exchange name, a detailed page about the Exchange is displayed.

You can view and add biding for the Exchange.
Bindings
The Binding is the fundamental relationship mechanism in RabbitMQ. it defines the routing logic between an Exchange and a Queue (or between two Exchanges). Without a binding, a queue cannot receive messages from any exchange.
Essentially, a binding is a directive that tells an exchange how to send data to a queue or another exchange. The binding also contains routing keys and arguments that customize message passing:
-
Source: The Exchange that receives the message.
-
Destination: The Queue (or another Exchange) where the message is sent.
-
Routing Key: An optional parameter supplied by the producer, which the exchange uses to match against the binding.

In the Management Interface, bindings are configured on the detail page of the Exchange or Queue, allowing the operator to define precisely which messages flow to which destinations based on the Exchange’s type (direct, topic, etc.).
You can also publish a message to Exchange in this page:

Queues
A RabbitMQ Queue is the central storage component, an ordered sequence of items, in this case, messages waiting for consumers to process them. The queue exists within the broker context (RabbitMQ server or Cluster).
Queues have different parameters and arguments depending on how they were created, which determine their behavior and resilience:
-
Name: The unique identifier of the created queue.
-
Features: Displays the primary configuration attributes that define the queue’s persistence and lifecycle:
-
Durable Queues: Indicated by
D. If the RabbitMQ node is restarted, the queue and any persistent messages within it will be recovered. This is essential to guarantee data is not lost in case of failure.
-
Auto-delete Queues: Indicated by
AD. The queue will be automatically deleted by the broker as soon as its last consumer disconnects or is canceled (e.g., when the TCP connection with the server is lost or the channel is closed). This is useful for temporary queues.
-
Message Ready: Displays the number of messages currently available to be delivered to consumers.
-
Message Unacked: Represents the number of messages that have already been delivered to consumers, but for which the server has not yet received an acknowledgment of processing (ACK). These messages remain in the queue and will be redelivered if the consumer fails.
-
Message Total: The total number of messages currently queued. This is the sum of Ready and Unacked messages.
-
Message Rate in/out: The real-time processing rates. In shows the speed at which messages are arriving at the queue (publish rate), while Out shows the speed at which messages are being processed/delivered to consumers (delivery rate).

A new Queue can be added in this same page:

By clicking on the Queue name, a Queue detail page will be displayed:

A Consumer is an application (or application instance) that consumes messages. The consumer sub page displays consumers/channels that are connected to the Queue. you can view and add constraints for Queue:

It is also possible to publish a message to the Queue:

A Queue can be deleted by clicking the Delete Queue button. You can aslo delete all Messages in the Queue by clicking the Purge Messages button:

Admin page
From the Admin page, we can add m users, change user permissions, set up vhosts, policies, limit the number of connections or change the cluster name.

Click on the Virtual Hosts menu on the left to view a list or add new Virtual Hosts:

Policy can be added or updated in the Policies sub-menu on the left:

Similarly click on the Limits sub-menu to limit the number of Connections, Queues of a Virtual Host.

By default, RabbitMQ names the cluster rabbit@, and we can rename it in the cluster sub-menu.
This article mainly introduces you to the features that we can use from RabbitMQ Management Interface.
Virtual Hosts (VHosts)
Virtual Hosts (VHosts) are the primary administrative partitions within a single RabbitMQ broker. They provide a way to group and isolate user permissions, exchanges, queues, and bindings. From a multi-tenant or multi-application perspective, a VHost functions like a separate, logical broker instance, ensuring that resources and messaging data from one application environment (e.g., ‘production’ or ‘development’) cannot interfere with another.
Advanced Debugging Tools
Beyond the standard Overview metrics, the Management Interface provides specialized tools for deep-level diagnostics, particularly useful when troubleshooting complex routing or delivery issues.
Message Tracing (Tracer)
The Tracer is a powerful debugging feature used to inspect the path messages take through the broker. When enabled, the Tracer logs every message event, including when a message is published, routed by an exchange, and delivered to a queue.
-
Usage: Operators enable tracing on a specific virtual host to capture detailed logs of all message activity within that environment.
-
Benefit: This allows developers to definitively confirm if a message arrived at the correct queue, or if it was dropped due to an incorrect binding or routing key.
Alarms and Health Checks
The Alarms sub-menu, found under the Admin section, provides a centralized view of system-critical alerts. RabbitMQ nodes trigger alarms when they encounter severe resource constraints, such as:
-
Disk Alarm: Triggered if available disk space drops below the configured watermark, preventing the writing of persistent messages.
-
Memory Alarm: Triggered if the node exceeds a pre-set memory utilization limit.
Monitoring these alarms is crucial for preemptive capacity management and avoiding producer throttling, when the broker blocks incoming messages to prevent a more severe failure.
That’s all foks!
The RabbitMQ Management Web Interface is not just an optional tool. It is an important component for any operator or developer working with asynchronous systems. The interface provides complete and real-time visibility into the operational core of the broker, making management tasks that were once, complex command-line operations, an intuitive web console action.
Mastering this interface allows you to manage the messaging infrastructure, ensuring high availability and message reliability. Always remember to prioritize security by managing user permissions and regularly updating credentials, transforming your RabbitMQ instance from a simple message relay into a resilient and scalable communication hub.



 Vivo, kamera performansına odaklanan yeni amiral gemisi modeli X300 Ultra’yı resmen tanıttı. Gelişmiş kamera donanımı ve güçlü işlemcisiyle cihaz neler sunuyor?

 Vodafone, 1 Nisan’da tarihinde 5G teknolojisiyle birlikte müşterilere sunulacak avantajları açıkladı. Tüm müşterilere sınırsız internet paketi hediye edilecek.

 Samsung, yeni RISC-V tabanlı PCIe 5.0 SSD’si BM9K1 ile depolamada performans ve verimliliği artırmayı hedefliyor. Yeni SSD’lerin 2027’de piyasaya sunulması planlanıyor.