
Building Confidence with Testcontainers
Problem Story

Modern Node.js applications rarely live in isolation. They depend on databases, caches, message brokers, and third-party APIs. Unit tests validate business logic, but they cannot guarantee everything will still work once your service runs in a real environment with real dependencies.

This is where Testcontainers comes in: it lets you run integration tests against real services inside disposable Docker containers, both locally and in CI.

The Classic Deployment Failure Scenario

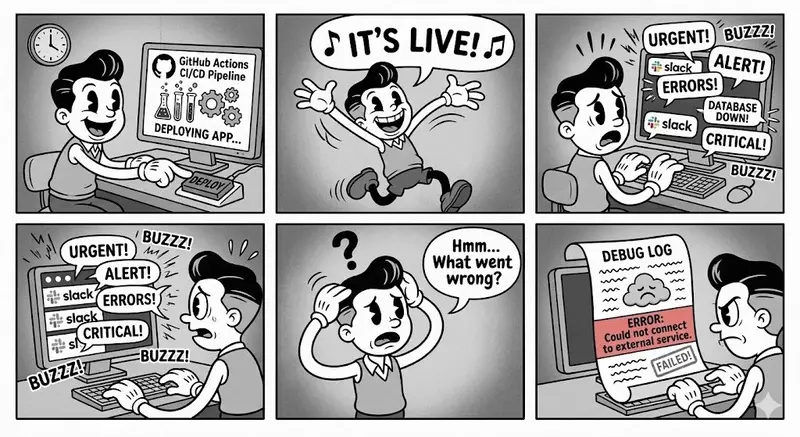
Problem Story
Story generated with Nano Banana 2

A familiar story:

  • You implement a new feature.
  • Your unit tests are green.
  • CI passes, you deploy, and everything looks good.
  • Shortly after, alerts start firing and messages arrive: requests are failing, the database can’t be reached, or some external service integration is broken.

Looking into the logs, you discover that your service failed to connect to another service—maybe a database, maybe a cache, maybe a message broker. The root cause is often that integration paths were never validated end-to-end. The code was tested in isolation, but the system was not.

In modern architectures—microservices and distributed systems—each service is just a small cog in a much larger machine. Services communicate over HTTP, gRPC, queues, and streams. If we only test in isolation with mocks, we ignore the very thing that often breaks in production: the integrations.

Why Integration Tests Are Hard

Integration tests are traditionally considered “hard” because:

  • They require external infrastructure, such as databases, brokers, or cloud services.
  • Managing these dependencies locally is painful (installing and configuring Postgres, Redis, Kafka, etc.).
  • Shared staging/sandbox environments are fragile and rarely reliably mirror production.
  • Cleaning up after tests is error-prone and often left to manual work.

A common workaround is to deploy to a sandbox or test environment and run manual or partially automated tests there. But these environments can drift from production and are often shared between teams, leading to flaky tests and fragile pipelines.

What Testcontainers Solves

Testcontainers addresses these pain points by wrapping real services inside lightweight, disposable Docker containers, managed directly from your tests.

At a high level, Testcontainers:

  • Starts a real service (for example, PostgreSQL or Redis) inside a container before your tests run.
  • Exposes connection details (host, port, credentials) to your test code.
  • Runs your tests against this real instance.
  • Automatically tears down the container afterwards.

This gives you:

  • Real services instead of mocks.
  • Isolated infrastructure per test suite (or even per test).
  • Repeatable, production-like testing both locally and in CI.
    ## Testcontainers vs. Docker Compose

It might be tempting to reach for Docker Compose for integration tests, but there are several drawbacks:

  • Port conflicts: Different projects or versions of the same service (e.g., PostgreSQL 8 vs 16) can’t share the same host port.
  • Networking complexity: You need to understand Docker’s networking model and set it up correctly.
  • Manual lifecycle management: It’s easy to start services in detached mode and forget to stop or remove them, leaving containers and volumes around.

Testcontainers abstracts all of this:

  • It picks free host ports automatically.
  • It hides Docker networking details behind a simple API.
  • It ensures containers are cleaned up when tests complete.

Instead of managing YAML files and Docker commands, you work entirely in code.

Example: Node.js (Bun) + Redis

Consider a simple Node.js/Bun application that uses Redis for caching. The application provides two functions: one to set a value in the cache and one to read it.

Application code (simplified):

import { createClient } from 'redis';

export async function setCache(redis: any, key: string, value: string) {
  await redis.set(key, value);
}

export async function getCache(redis: any, key: string) {
  return await redis.get(key);
}

Without Testcontainers, you would either:

  • Install Redis locally and assume it’s running on a given port, or
  • Mock Redis entirely and never hit a real instance.

With Testcontainers, you can spin up a real Redis container just for your tests.
Integration test with Testcontainers and Bun’s Redisclient:

import { RedisClient } from "bun";
import { describe, beforeAll, afterAll, it, expect } from 'bun:test'
import { RedisContainer, StartedRedisContainer } from "@testcontainers/redis";
import { getRedis, setRedis } from ".";

describe("Redis", () => {
  let container: StartedRedisContainer;
  let redisClient: RedisClient;

  beforeAll(async () => {
    container = await new RedisContainer("redis:8").start();
    const connectionUrl = container.getConnectionUrl();

    redisClient = new RedisClient(connectionUrl);
    await redisClient.connect();
  }, 30000);

  afterAll(async () => {
    if (redisClient) {
      redisClient.close();
    }
    if (container) {
      await container.stop();
    }
  });

  it("works", async () => {
    await setRedis("key", "val", redisClient);
    const cache = await getRedis("key", redisClient);
    expect(cache).toBe("val");
  });
});

This test:

  • Starts a Redis container dynamically.
  • Connects to it using the mapped host and port.
  • Runs a real end-to-end operation (set + get).
  • Cleans up everything afterwards.

No manual Docker commands, no global Redis install, no mock behavior hiding integration issues.
How it works
How Testcontainers work

The good thing is you can easily swap the docker images out. So instead of using redis, you could use the open source module valkey 👇

import { RedisClient } from "bun";
import { describe, beforeAll, afterAll, it, expect } from 'bun:test'
import { ValkeyContainer as RedisContainer, StartedValkeyContainer as StartedRedisContainer } from "@testcontainers/valkey";
import { getRedis, setRedis } from ".";

describe("Redis", () => {
  let container: StartedRedisContainer;
  let redisClient: RedisClient;

  beforeAll(async () => {
    container = await new RedisContainer("valkey/valkey").start();
    const connectionUrl = container.getConnectionUrl();

    redisClient = new RedisClient(connectionUrl);
    await redisClient.connect();
  }, 30000);

  afterAll(async () => {
    if (redisClient) {
      redisClient.close();
    }
    if (container) {
      await container.stop();
    }
  });

  it("works", async () => {
    await setRedis("key", "val", redisClient);
    const cache = await getRedis("key", redisClient);
    expect(cache).toBe("val");
  });
});

And you will notice the logic did not change.

Running Testcontainers in CI/CD

Testcontainers can be used in CI environments as long as Docker is available. Typical setup:

  • Ensure the CI runner has Docker installed and the test process has permission to talk to the Docker daemon.
  • Run your test suite as usual (npm test, bun test, pnpm test, etc.).
  • Testcontainers spins up and tears down containers on the fly.

This brings the same level of integration testing you have locally into your automated pipeline, giving you much higher confidence before each deployment.

When to Use Testcontainers

Testcontainers is particularly useful when:

  • Your service talks to databases, caches, or message brokers and you want to test those interactions realistically.
  • You want to avoid maintaining dedicated integration environments.
  • You want reproducible tests with self-contained infrastructure, both locally and in CI.

It doesn’t replace unit tests, but complements them by validating that the whole system behaves correctly when real dependencies are involved.

Go check it out.

Choosing the Right AI for Your Boat Shop: Beyond the Buzzwords

You know the drill: a customer’s engine repair is stalled because a gasket is backordered, and your phone is buzzing with scheduling conflicts. Manual inventory and calendar juggling eat hours you could spend on actual repairs. AI promises relief, but how do you pick a tool that actually works for a small, mobile operation?

The Core Principle: Actionable Intelligence Over Generic Reports

The key is to distinguish between basic automation and true, actionable AI intelligence. Many systems offer automated notifications—like “Parts Arrival” or “30-Day Follow-Up”—which are helpful. But the real value lies in predictive forecasting that uses your future workload to guide decisions today. An AI that only analyzes past sales data is reactive. One that analyzes your scheduled jobs for the coming month to predict parts demand is proactive and transformative.

For example, Jobber is a field service management platform that incorporates AI-driven scheduling and inventory insights. Its purpose is to centralize your jobs, client details, and parts, allowing its algorithms to work with your upcoming schedule.

Consider this mini-scenario: You input five scheduled water pump replacements for next week. A basic system might flag low pump inventory. An advanced AI analyzes those jobs, cross-references them with your historical data on associated belts and hoses often replaced during pump service, and recommends stocking those specific ancillary parts now, preventing secondary delays.

Implementing a Practical AI Tool

  1. Audit Your Data Foundation First. Before any demo, clarify your “minimum viable data.” Can you list your Tier 1 parts (name, SKU, quantity, cost)? If your inventory is a mess, clean it up. AI requires clean input.
  2. Test the Mobile Experience Rigorously. Your life is in the field. In the demo, insist the rep switches to the mobile app. Create a fake customer (“John Smith, 2004 Bayliner…”) and test: Can they find a part and log its use in under 30 seconds? Verify offline capability.
  3. Ask Specific, Scenario-Based Questions. Go beyond generic features. Apply your busiest season scenario. Ask the vendor: “Show me the predictive inventory report for my peak month based on my *scheduled jobs, not just past sales.”* Evaluate if the output is actionable.

Key Takeaways

Focus on software that provides intelligence tied to your future schedule, not just past trends. Prioritize a flawless, fast mobile experience. Remember, the typical effective investment zone is $100-$300/month for core AI functions, but always factor in necessary hardware like rugged tablets. Choose tools that turn your planned work into precise, preemptive actions.

Project Loom: Java’s Virtual Threads – From Nightmares to Modern Concurrency Bliss

In 2006, I worked on a large logistics system for transporting wood for pulp production. One of the most critical modules managed the entry and exit of trucks from a storage yard. We implemented it using Threads in Delphi 7. The debugging process was an absolute nightmare.

Hundreds of trucks arriving and leaving, each one triggering database checks, sensor readings, queue management, and synchronization logic. Every thread was a heavyweight OS thread. Memory usage skyrocketed, context switching killed performance, and when something went wrong (which happened constantly), the debugger would freeze or show you a stack trace that made zero sense because the threads were all fighting for the same resources.

Sound familiar?

That exact pain — the same pain Java developers have felt for 30 years with regular Thread objects and ExecutorService backed by platform threads — is what Project Loom was created to eliminate.

Today, with Java 21+ (and fully mature in 2026), Virtual Threads are production-ready and change the game completely.

Let’s demystify Project Loom and see, with real Java code, why Virtual Threads are not just “better threads” — they are a completely different beast.

The Problem with Traditional (Platform) Threads

Since Java 1.0, every new Thread() or thread from a ThreadPoolExecutor is a platform thread:

  • It maps one-to-one to an OS thread.
  • It consumes ~1 MB of stack space (configurable, but rarely less).
  • Creating thousands of them is expensive and risky.
  • Blocking operations (I/O, sleep(), database calls, HTTP requests) block the entire OS thread.
  • Context switching is handled by the operating system (expensive).

In the 2006 Delphi system, we could barely handle a few hundred concurrent trucks before the server started thrashing. The same limitation existed in Java until Project Loom.

Classic Platform Thread Example (The Old Way)

Here’s how we used to handle concurrent truck processing in Java (pre-Loom):

* All examples are in Java 25, you MUST enable preview features to execute them.

// OLD STYLE - Platform Threads
public class TruckYardPlatformThreads {

    public static void main(String[] args) {
        ExecutorService executor = Executors.newFixedThreadPool(200); // Limited by OS

        for (int i = 0; i < 10_000; i++) {  // Imagine 10,000 trucks arriving
            final int truckId = i;
            executor.submit(() -> processTruck(truckId));
        }

        executor.shutdown();
    }

    private static void processTruck(int truckId) {
        try {
            System.out.println("Truck #" + truckId + " entering yard [Thread: "
                               + Thread.currentThread() + "]");

            // Simulate blocking I/O (database, sensor, loading/unloading)
            Thread.sleep(1000);  // This BLOCKS an entire OS thread!

            System.out.println("Truck #" + truckId + " leaving yard");
        } catch (InterruptedException e) {
            Thread.currentThread().interrupt();
        }
    }
}

Problems with this code:

  • Maximum practical concurrency: ~200–500 threads on most servers.
  • Memory usage: 200 threads × 1 MB stack = 200 MB just for stacks.
  • Debugging deadlocks or race conditions? Good luck.

Enter Project Loom and Virtual Threads

Project Loom (started in 2017) introduced Virtual Threads — lightweight threads managed entirely by the JVM, not the OS.
Key differences:

Feature Platform Threads (Old) Virtual Threads (Loom)
Mapping 1:1 with OS thread Many:1 with carrier (platform) thread
Stack size ~1 MB (fixed) “A few KB (dynamic, grows as needed)”
Creation cost Expensive Extremely cheap
Maximum practical count Thousands Millions
Blocking behavior Blocks OS thread Does not block carrier thread
Scheduling OS scheduler JVM scheduler (work-stealing)
Debugging experience Same as before Identical to platform threads

Virtual threads are not a new abstraction like coroutines or reactive streams. They are real Thread objects — you can use Thread.currentThread(), synchronized, locks, ThreadLocal (though ScopedValue is preferred now), and they behave exactly like the threads you already know.

The magic is under the hood: when a virtual thread blocks (e.g., sleep(), I/O, waiting for a lock), the JVM unmounts it from its carrier thread and mounts another virtual thread. The carrier thread (a real OS thread) never blocks.

Creating Virtual Threads – The New Way

// NEW STYLE - Virtual Threads (Java 21+)
try (var executor = Executors.newVirtualThreadPerTaskExecutor()) {
    for (int i = 0; i < 1_000_000; i++) {  // ONE MILLION trucks? No problem!
        final int truckId = i;
        executor.submit(() -> processTruck(truckId));
    }
}

Blocking calls like Thread.sleep(), database queries, or HTTP requests no longer waste carrier threads.

Structured Concurrency (The Missing Piece)

Project Loom also introduced Structured Concurrency (via StructuredTaskScope), which makes concurrent code safer and more readable.

Old way (fire-and-forget):

// OLD STYLE - Fire-and-forget with platform threads
// Hard to manage lifecycle, cancellation, and errors
for (int i = 0; i < 5; i++) {
    new Thread(() -> {
        try {
            processTruck(i);
        } catch (Exception e) {
            // Error handling is scattered and unreliable
            e.printStackTrace();
        }
    }).start();
}
// No guarantee that threads will finish, no easy way to wait or cancel

This approach often leads to thread leaks, orphaned tasks, and difficult debugging — the same issues I faced 20 years ago in Delphi.

New way with Structured Concurrency:

// NEW STYLE - Structured Concurrency with Virtual Threads
private static String processTruckWithResult(int truckId) throws InterruptedException {
    System.out.println("Truck #" + truckId + " entering yard [Virtual Thread: "
                       + Thread.currentThread() + "]");

    // Simulate blocking work (DB, sensor, etc.)
    Thread.sleep(1000);

    String result = "Truck #" + truckId + " processed successfully";
    return result;
}

public static void main(String[] args) throws InterruptedException {
    try (var scope = StructuredTaskScope.open(
            StructuredTaskScope.Joiner.allSuccessfulOrThrow())) {
        List<StructuredTaskScope.Subtask<String>> subtasks = new ArrayList<>();

        for (int i = 0; i < 5; i++) {
            final int truckId = i;
            subtasks.add(scope.fork(() -> processTruckWithResult(truckId)));
        }

        scope.join(); // Wait for all subtasks

        for (var subtask : subtasks) {
            // Results are available and exceptions are propagated cleanly
            System.out.println(subtask.get());
        }
    }
    // Scope automatically shuts down and cleans up all subtasks
}

Benefits:

  • Tasks are confined to a lexical scope (like try-with-resources for threads).
  • If one task fails, remaining tasks are cancelled automatically.
  • No thread leaks.
  • Clear ownership and predictable lifecycle.

Additional Loom Features You Should Know

  • ScopedValue (modern, safer replacement for ThreadLocal in many cases).
  • Excellent backward compatibility — most existing thread-based code works with virtual threads with zero or minimal changes.

When Should You Use Virtual Threads?

Use Virtual Threads when:

  • Your application is I/O bound (web services, APIs, databases, logistics systems).
  • You need high concurrency with simple code.

Use Platform Threads (or combine) when:

  • Pure CPU-bound heavy computation.

Final Thoughts

The 2006 logistics system I worked on would have been radically simpler and more reliable with Virtual Threads and Structured Concurrency. No more thread pool tuning nightmares. No more “out of threads” errors at 3 AM.

Project Loom delivers scalable concurrency without forcing you to abandon the familiar threaded programming model.

If you’re still managing fixed thread pools in 2026… it’s time to upgrade.

Have you migrated any production systems to Virtual Threads yet? What was your experience?

Drop your thoughts in the comments below. I’ll see you in the next post where we’ll explore Structured Concurrency and Scoped Values in much more depth.
Until then — keep those memory leaks under control. 🚚

Originally posted on my blog, Memory Leak

React 19 migration traps your AI keeps falling into (and how to fix them with .mdc rules)

Every AI coding assistant was trained on React 18 patterns. When you’re building with React 19 + Next.js 15, the AI generates code that compiles perfectly but fails at runtime or behaves unexpectedly.

Here are the 4 most common React 19 traps I’ve documented, with .mdc rules to prevent each one.

1. useFormStatus() returns { pending: false } forever

The trap: The AI places useFormStatus() in the same component that renders the <form>. This will NEVER work — useFormStatus only reads status from a parent <form>.

// ❌ AI generates this — pending is ALWAYS false
'use client'
export function MyForm() {
  const { pending } = useFormStatus()
  return (
    <form action={createItem}>
      <Button disabled={pending}>Submit</Button>
    </form>
  )
}

// ✅ Extract the button to a child component
function SubmitButton() {
  const { pending } = useFormStatus()
  return <Button disabled={pending}>{pending ? 'Saving...' : 'Submit'}</Button>
}

export function MyForm() {
  return (
    <form action={createItem}>
      <SubmitButton />
    </form>
  )
}

2. useFormState is deprecated — AI still imports it

React 19 renamed useFormState to useActionState and moved it from react-dom to react. The AI generates the old import because its training data is 99% React 18.

// ❌ Deprecated — AI generates this
import { useFormState } from 'react-dom'

// ✅ React 19
import { useActionState } from 'react'
const [state, formAction, isPending] = useActionState(serverAction, initialState)

3. forwardRef is no longer needed

In React 19, ref is a regular prop. The AI wraps every component in forwardRef() because that’s what it learned from thousands of React 18 examples.

// ❌ Unnecessary boilerplate in React 19
const MyInput = forwardRef<HTMLInputElement, Props>((props, ref) => {
  return <input ref={ref} {...props} />
})

// ✅ React 19 — ref is a regular prop
function MyInput({ ref, ...props }: Props & { ref?: React.Ref<HTMLInputElement> }) {
  return <input ref={ref} {...props} />
}

4. params are Promises in Next.js 15

This is the #1 runtime crash. In Next.js 15, params and searchParams are Promise objects. The AI generates synchronous destructuring because Next.js 14 used synchronous params.

// ❌ Compiles in dev, crashes in production
export default function Page({ params }: { params: { id: string } }) {
  const { id } = params
}

// ✅ Next.js 15 — params are async
export default async function Page({ params }: { params: Promise<{ id: string }> }) {
  const { id } = await params
}

The .mdc solution

Each of these traps has a corresponding .mdc rule file that activates based on file globs. When the AI opens a .tsx file, the rules inject the correct patterns into the context window, overriding the stale training data.

I’ve documented 29 of these patterns (React 19, Next.js 15, Supabase SSR, Stripe) as open source .mdc rule files:

GitHub: github.com/vibestackdev/vibe-stack

Quick install (5 free rules):

npx vibe-stack-rules init

What React 19 traps have you hit with AI code generation? I’d love to add them to the rule set.

Taming AI Glitches: Your E-Book Formatting Troubleshooting Guide

AI tools are revolutionizing self-publishing, turning complex formatting into a simple prompt. But when your beautifully drafted manuscript upload fails with cryptic errors, the frustration is real. The glitch isn’t you—it’s the AI interpreting instructions a little too literally.

The Golden Rule: Validate, Don’t Just Trust

The core principle for troubleshooting AI formatting is systematic validation. Never assume the AI’s output is ready for publishing. You must proactively check its work using the specialized tools built for e-book standards. Think of the AI as a talented but overeager intern; you are the manager who must review and approve its final deliverable.

Mini-Scenario: Your AI-formatted e-book passes a visual check, but KDP rejects it. Running it through Kindle Previewer’s Validate button reveals a fixed-layout error from an errant pixel-based width rule the AI introduced.

Your Three-Step Debugging Framework

  1. Isolate with Elimination. When faced with odd spacing, breaks, or alignment, use the “comment-out” method. In your CSS, find a suspect class (like .special-text), disable it completely, and re-convert the file. If the problem vanishes, you’ve isolated the culprit CSS rule the AI created or misapplied.

  2. Enforce Consistency. AI can introduce subtle variations that break the reading experience. Audit your file: Are all chapter titles using the exact same “Heading 1” style? Are all blockquotes uniform? Manually enforce this consistency; the AI might have used multiple, slightly different styles for the same visual element.

  3. Purview for Platform-Specific Flaws. AI often imports unnecessary code from web design. Scrutinize the CSS for experimental prefixes (-webkit-) and properties like float or position for images, which break in reflowable e-books. Also, ensure images are compressed and correctly embedded—AI can link to a huge, unoptimized original file.

Key Takeaways

Always validate your AI-generated files with tools like epubcheck or Kindle Previewer. Your role is to enforce consistency and strip out web-centric code that e-book platforms cannot process. By adopting this review framework, you leverage AI’s speed while ensuring professional, error-free results.

How to Use Shaders in React (2026 WebGPU / WebGL Tutorial)

A hero section with a liquid glass and dither background

We’ve got it easy, and that’s a problem

It’s getting easier and easier to build for the frontend.

Frameworks are better. Tooling is better. AI can generate entire UI layouts. You can spin up a clean, responsive, modern-looking site in a day. But that also means everyone else can too. As the barrier to building goes down, the bar for standing out goes up.

The places where things still stand out tend to be motion, interactivity, and visuals — the parts that AI struggle with and that still feel a bit like magic. GPU-powered shaders are a big part of that next frontier.

A hero section with a liquid glass and dither background

If you’ve ever seen effects like:

  • Liquid glass distortions
  • Dithering or ASCII renders
  • Interactive ripple/distortion backgrounds
  • Animated gradients that feel alive

…those are typically powered by fragment shader math running on the GPU (via WebGL or WebGPU). The problem is that shader programming is nothing like normal frontend work. You’re suddenly dealing with trigonometry, UV coordinates, noise functions, render passes, memory buffers, and a lot of concepts that feel very far removed from writing React components or CSS.

The shaders homepage

Shader magic for modern frontends

That’s the challenge that led me to build the Shaders component library — instead of writing GLSL or WGSL directly, you work with shader effects as components that you can drop into your app, pass props to, and compose together.

You can treat GPU effects more like UI building blocks:

  • Use them in hero sections
  • Use them as animated backgrounds
  • Wrap images or SVGs with effects
  • Add interactivity with mouse position
  • Animate values over time with props

No more context switching into heavy shader math or fighting AI over floating point math — you’re working at the same level you normally work at: components and props.

Creating shader effects in 10 minutes flat

Shaders is currently in public beta, and is already being used in a bunch of production projects. It’s available for Vue, React, Svelte, Solid and vanilla JS.

Here’s a short video that walks through how to use the components inside a React project, explores some of the available presets, and shows how the design editor fits into your workflow.

An example shader showing an SVG shape being used to generate a metallic logo effect

If you want to try it yourself, you can find everything here:

Docs: https://shaders.com
npm: https://www.npmjs.com/package/shaders

If you need help, or end up shipping something awesome using Shaders, let us know in Discord here: https://discord.gg/Mfqmb2jCQT

It’s never been easier to build for the web — which means it’s never been more important to build something that feels different 🔥

The 5th Agent Orchestration Pattern: Market-Based Task Allocation

Most conversations about agent orchestration patterns settle on the same four: pipeline, supervisor, router, blackboard. Each solves coordination differently. Pipelines chain steps linearly. Supervisors centralize control. Routers classify and dispatch. Blackboards let agents coordinate through shared state without direct communication.

These four cover a lot of ground. But there is a fifth pattern that comes from an older field, and it solves a problem the other four handle poorly: dynamic allocation across heterogeneous agents when cost matters.

The Pattern: Auction-Based Task Allocation

Instead of a supervisor deciding which agent handles a task, you let agents bid on it.

The mechanism works like this. A task enters the system. It gets broadcast to all available agents. Each agent evaluates the task against its own capabilities, current load, and estimated cost, then submits a bid. An auction engine evaluates the bids and assigns the task to the winner.

This is not a theoretical concept. The Consensus-Based Auction Algorithm (CBAA) and its extension, the Consensus-Based Bundling Algorithm (CBBA), have been used in multi-robot task allocation for over a decade. The research originated at CMU and the University of Maryland, primarily for coordinating robot fleets where each unit has different sensors, battery levels, and proximity to targets.

The core idea transfers directly to LLM agent systems. Replace “battery level” with “context window utilization.” Replace “sensor capability” with “tool access and specialization.” Replace “proximity” with “relevant cached context.” The allocation logic is the same.

How It Works in Practice

A market-based orchestration layer has four phases:

1. Broadcast. The system publishes an available task with metadata (type, estimated complexity, required capabilities, deadline).

2. Bid. Each agent that can handle the task submits a bid. The bid includes a capability score (how well the agent matches the task requirements), a load factor (how busy the agent currently is), and a cost estimate (tokens, time, or whatever resource you are optimizing for).

3. Auction. The auction engine scores bids using a weighted function. A simple version: score = capability * (1 - load) / cost. More sophisticated versions factor in deadline urgency, agent track record, and bundle efficiency (assigning related tasks to the same agent to reduce context switching).

4. Assignment. The winning agent gets the task. Other agents free their reserved capacity.

class TaskAuction:
    def __init__(self, agents, weights=None):
        self.agents = agents
        self.weights = weights or {
            "capability": 0.5,
            "availability": 0.3,
            "cost": 0.2
        }

    def broadcast(self, task):
        bids = []
        for agent in self.agents:
            if agent.can_handle(task):
                bids.append({
                    "agent": agent,
                    "capability": agent.assess_capability(task),
                    "load": agent.current_load(),
                    "cost": agent.estimate_cost(task)
                })
        return bids

    def select_winner(self, bids):
        scored = []
        for bid in bids:
            score = (
                self.weights["capability"] * bid["capability"]
                + self.weights["availability"] * (1 - bid["load"])
                - self.weights["cost"] * bid["cost"]
            )
            scored.append((score, bid))
        scored.sort(key=lambda x: x[0], reverse=True)
        return scored[0][1]["agent"] if scored else None

The interesting property is adaptiveness. When the agent pool changes (new agents come online, existing ones hit capacity), the allocation adjusts automatically. No one rewrites routing rules. The market handles it.

When This Pattern Fits

Market-based orchestration works best in specific conditions.

Heterogeneous agent pools. If your agents have meaningfully different capabilities, costs, or specializations, the bidding mechanism surfaces the best match dynamically. A supervisor could do this too, but the supervisor needs to know about every agent’s current state. The market distributes that knowledge.

Variable workloads. When task volume and type shift unpredictably, static routing rules break. A market adjusts. During a spike of code review tasks, agents with code analysis capabilities naturally absorb more work because their capability scores are higher for those tasks.

Cost optimization matters. If you are paying per token and different models have different price points, the auction mechanism can factor cost directly into allocation. A GPT-4 class agent might bid high capability but high cost. A smaller model bids lower capability but lower cost. The auction weights decide the tradeoff based on task priority.

Adaptive fallback. A recent paper on the Agent Exchange concept describes a hybrid approach: use auction-based allocation when competition exists (multiple agents can handle the task), fall back to direct assignment when only one agent qualifies. This avoids the overhead of running auctions for tasks with obvious owners.

When This Pattern Does Not Fit

The auction mechanism adds latency. Every task needs a broadcast, a bid collection window, and a scoring pass before work begins. For latency-sensitive workflows where you need a response in milliseconds, this overhead is disqualifying.

Small agent counts make the mechanism pointless. If you have three agents with non-overlapping specializations, a simple router is faster and equally effective. The market shines when there are many potential handlers and the “best” choice depends on runtime conditions.

Deterministic routing requirements also rule it out. If compliance or auditability demands that task type X always goes to agent Y, a market that might route it to agent Z based on load is the wrong pattern. Regulated industries often need predictable routing over optimal routing.

The Bigger Picture

What makes the market pattern interesting is that it distributes the coordination intelligence. In a supervisor pattern, the supervisor carries the full cognitive load of understanding every agent’s state and capability. In a market pattern, each agent carries only the knowledge of its own state. The auction engine is stateless. It just scores bids.

This mirrors a pattern from distributed systems design. The more you centralize decision-making, the more fragile the center becomes. Markets distribute decisions to the edges, where the relevant information already lives.

The four established patterns (pipeline, supervisor, router, blackboard) handle most production use cases. But as agent pools grow larger and more heterogeneous, and as cost optimization becomes a real constraint rather than a nice-to-have, market-based allocation becomes worth considering. The robotics community figured this out years ago. The LLM agent community is starting to catch up.

I write about agent architecture and systems design on Substack. Building Sigil, a Python framework for structured LLM workflows.

14-Package Monorepo: How We Structured WAIaaS for AI Agent Builders

When you’re building complex AI infrastructure like WAIaaS—a Wallet-as-a-Service that lets AI agents interact with blockchains—you face a classic problem: how do you organize code that spans everything from transaction pipelines to admin UIs to MCP integrations? The answer isn’t a single massive codebase, but a carefully structured monorepo that makes it easy for AI agent builders to grab exactly what they need.

Why Monorepo Architecture Matters for AI Agent Infrastructure

WAIaaS isn’t just a wallet service—it’s a complete ecosystem. AI agents need wallets, but they also need policy engines, transaction pipelines, admin interfaces, SDK integration, and connections to 14 different DeFi protocols. When your users are building autonomous agents that handle real money, every component needs to work together seamlessly.

The traditional approach of separate repositories creates dependency hell. Version mismatches between the core daemon and the SDK. Breaking changes in the transaction schema that don’t propagate to the admin UI. MCP tools that work with v1.2 of the API but break with v1.3. For developers building AI agents, this friction is deadly—they want to focus on agent logic, not infrastructure debugging.

The 15-Package Structure: Separation by Purpose, Not Technology

WAIaaS uses a 15-package monorepo that separates concerns by what developers actually need, not by technical implementation details. Here’s how it breaks down:

Core Infrastructure (3 packages):

  • core — Schemas, types, and shared business logic
  • daemon — Main API server with 39 REST routes and 7-stage transaction pipeline
  • shared — Network definitions and utilities

Developer Interfaces (4 packages):

  • sdk — TypeScript SDK with 40+ methods for agent builders
  • mcp — 45 MCP tools for Claude Desktop integration
  • openclaw-plugin — 5 tools for external AI frameworks
  • cli — 20 commands for setup and management

User Interfaces (2 packages):

  • admin — Preact-based web UI for wallet management and policy configuration
  • desktop-spike — Desktop wallet prototype

Protocol Integration (2 packages):

  • actions — 14 DeFi protocol providers (Jupiter, Aave, Hyperliquid, etc.)
  • adapters — Blockchain adapters for EVM and Solana

Supporting Services (4 packages):

  • push-relay — Real-time notifications for transaction approvals
  • wallet-sdk — Low-level wallet operations
  • skills — Pre-built agent skills
  • e2e-tests — Integration test suite

This structure means AI agent builders can import exactly what they need. Building a trading bot? You want the SDK and maybe the MCP package. Integrating with a custom framework? Grab the actions package directly. Need to extend DeFi support? The actions package is self-contained with clear provider interfaces.

How the Packages Work Together

Let’s trace through what happens when an AI agent wants to swap tokens on Jupiter:

Step 1: Agent calls SDK

import { WAIaaSClient } from '@waiaas/sdk';

const client = new WAIaaSClient({
  baseUrl: 'http://127.0.0.1:3100',
  sessionToken: process.env.WAIAAS_SESSION_TOKEN,
});

const result = await client.executeAction('jupiter-swap', 'swap', {
  inputMint: 'So11111111111111111111111111111111111111112', // SOL
  outputMint: 'EPjFWdd5AufqSSqeM2qN1xzybapC8G4wEGGkZwyTDt1v', // USDC
  amount: '1000000000' // 1 SOL
});

Step 2: SDK calls daemon API
The SDK (TypeScript, zero dependencies) makes an HTTP request to the daemon’s /v1/actions/jupiter-swap/swap endpoint.

Step 3: Daemon validates and routes
The daemon (packages/daemon) validates the session token, checks policies from core schemas, and routes to the Jupiter provider in actions.

Step 4: Jupiter provider executes

// In packages/actions/src/providers/jupiter-swap/
export async function swap(params: SwapParams) {
  const quote = await getQuote(params);
  const transaction = await buildSwapTransaction(quote);
  return { transaction, quote };
}

Step 5: Transaction pipeline processes
The daemon runs the transaction through its 7-stage pipeline (validate → auth → policy → wait → execute → confirm → stages), using policy types from core and network definitions from shared.

Step 6: Real-time updates
If the transaction needs approval, push-relay sends real-time notifications. The admin UI updates the pending transactions view.

Every package has a clear role, but they compose into a complete system. The agent builder only sees the SDK interface, but underneath, the entire monorepo is working together.

MCP Integration: 45 Tools in One Package

The MCP integration showcases why the monorepo structure works so well. Claude Desktop users get 45 tools through a single npm package:

{
  "mcpServers": {
    "waiaas": {
      "command": "npx",
      "args": ["-y", "@waiaas/mcp"],
      "env": {
        "WAIAAS_BASE_URL": "http://127.0.0.1:3100",
        "WAIAAS_SESSION_TOKEN": "wai_sess_<your-token>"
      }
    }
  }
}

The MCP package (packages/mcp) provides tools like get-balance, send-token, execute-action, and x402-fetch, but it doesn’t reimplement any business logic. Instead, it:

  1. Uses schemas from core for request validation
  2. Makes API calls to daemon endpoints
  3. Leverages shared utilities for address formatting
  4. Benefits from the full DeFi integration in actions

Because everything is in the same repo with shared tooling, the MCP tools stay in sync with API changes automatically. When we add a new policy type to core, the MCP tools immediately understand it. When actions adds a new DeFi protocol, the execute-action tool can use it without updates.

Docker Deployment: Multiple Images, Single Repo

The monorepo also simplifies deployment. We ship 2 Docker images from the same codebase:

services:
  daemon:
    image: ghcr.io/minhoyoo-iotrust/waiaas:latest
    ports:
      - "127.0.0.1:3100:3100"
    environment:
      - WAIAAS_AUTO_PROVISION=true
    restart: unless-stopped

The main Dockerfile builds the daemon with the admin UI bundled in. A separate Dockerfile in packages/push-relay/ builds the notification service. Both use the same shared and core packages, ensuring consistency.

For AI agent builders, this means one docker compose up -d gets you the entire wallet service, with all 14 DeFi protocols and the full API surface available immediately.

Policy Engine: 21 Types, 4 Tiers

The policy engine demonstrates the power of the monorepo structure. It uses 21 policy types and 4 security tiers (INSTANT, NOTIFY, DELAY, APPROVAL), but the complexity is hidden behind clean interfaces:

curl -X POST http://localhost:3100/v1/policies 
  -H 'Content-Type: application/json' 
  -H 'X-Master-Password: <password>' 
  -d '{
    "walletId": "<wallet-uuid>",
    "type": "SPENDING_LIMIT",
    "rules": {
      "instant_max_usd": 10,
      "notify_max_usd": 100,
      "delay_max_usd": 1000,
      "delay_seconds": 300,
      "daily_limit_usd": 500
    }
  }'

The policy definitions live in core/src/enums/policy.ts, the validation logic in core/src/schemas/policy.schema.ts, the enforcement in daemon/src/pipeline/stage3-policy.ts, and the UI in admin/src/components/PolicyEditor.tsx. But they’re all validated by the same TypeScript compiler, tested by the same test suite, and versioned together.

What This Means for AI Agent Builders

This structure gives you flexibility without complexity:

Option 1: Use the SDK (most common)

import { WAIaaSClient } from '@waiaas/sdk';
// Full wallet functionality, 40+ methods, zero dependencies

Option 2: Use MCP with Claude

waiaas mcp setup --all  # Auto-register with Claude Desktop
# Claude gets 45 wallet tools automatically

Option 3: Build custom integrations

import { executeAction } from '@waiaas/actions';
// Direct access to DeFi protocols

Option 4: Extend the system

// Add new DeFi protocols in packages/actions/src/providers/
// Add new policy types in packages/core/src/enums/policy.ts
// Everything stays in sync

You can start simple with the SDK and grow into deeper integration as your agent becomes more sophisticated. The monorepo ensures that whatever level you engage at, you’re working with a consistent, well-tested system.

Getting Started: From Zero to AI Agent Wallet

Here’s how to get your AI agent connected to the blockchain in under 5 minutes:

  1. Install and start WAIaaS:
npm install -g @waiaas/cli
waiaas init
waiaas start
waiaas quickset --mode mainnet  # Creates wallets + MCP sessions
  1. Set up Claude integration:
waiaas mcp setup --all  # Auto-configure Claude Desktop
  1. Test with your AI agent:
import { WAIaaSClient } from '@waiaas/sdk';

const client = new WAIaaSClient({
  baseUrl: 'http://127.0.0.1:3100',
  sessionToken: process.env.WAIAAS_SESSION_TOKEN,
});

const balance = await client.getBalance();
console.log(`Agent wallet: ${balance.balance} ${balance.symbol}`);

The monorepo structure means this simple setup gives you access to everything: 14 DeFi protocols, 21 policy types, NFT support, cross-chain bridging, liquid staking, and more. All from packages that are tested together, versioned together, and designed to work together.

Ready to Give Your AI Agent a Wallet?

WAIaaS’s 15-package monorepo isn’t just about code organization—it’s about making blockchain integration as simple as adding another tool to your AI agent’s toolkit. Whether you’re building with Claude’s MCP, LangChain, or custom frameworks, the structured approach means you can start simple and scale up without architectural rewrites.

Check out the full codebase and documentation at https://github.com/minhoyoo-iotrust/WAIaaS, or visit https://waiaas.ai to see what’s possible when your AI agents can finally handle their own money.

The Hidden Cost of Copy-Pasting Code Into ChatGPT

AI coding tools promise faster development. The METR study found the opposite: experienced developers were 19% slower on complex tasks when using AI, even though they perceived themselves as 20% faster. The biggest contributor wasn’t bad code generation. It was the workflow around it.

Every time you alt-tab from your editor to a chat window, paste a function, explain what it does, describe the bug you’re seeing, read the response, mentally translate it back to your codebase, switch back to your editor, and apply the changes, you’re paying a productivity tax that compounds across a day of work. Microsoft Research found that context switches during programming require an average of 10-15 minutes to regain deep focus. If you’re switching to ChatGPT 20 times a day, the math is brutal.

What you lose in the copy-paste loop

When you paste a function into ChatGPT, the AI sees text. It doesn’t see:

  • What file this function lives in
  • What other files import it
  • The test suite that covers it
  • The error log that prompted your question
  • The project structure or framework conventions
  • Whether the variable names match your codebase

You end up spending time explaining context that your editor already has. The AI hallucinates a response based on incomplete information. You debug the hallucination. The December 2025 CodeRabbit analysis found AI co-authored code contains 1.7x more major issues than human-written code, and much of that comes from missing context rather than model capability.

The spectrum of AI integration depth

Not all AI coding tools are equal. They fall on a spectrum from “zero context” to “full project awareness”:

Integration level What AI sees Example tools
Chat window Only what you paste ChatGPT, Claude.ai
Editor autocomplete Current file + open tabs GitHub Copilot
IDE-native AI Full project, terminal, git Cursor, Windsurf
Domain-specific Project + runtime + engine state Ziva (Godot), Copilot for Xcode

Each level down this table gives the AI more context, which means fewer hallucinations, less time spent explaining, and less debugging of AI output.

Why the METR study developers were slower

The METR study tested 16 experienced open-source developers on tasks from their own repositories. These developers knew their codebases intimately. When they used AI tools, they spent time on activities that felt productive but weren’t:

  1. Reviewing AI suggestions that didn’t match their codebase conventions
  2. Debugging AI-generated code that missed project-specific constraints
  3. Re-prompting after bad outputs
  4. Context-switching between their own mental model and the AI’s suggestions

The study noted that less experienced developers showed higher productivity gains from AI tools. This makes sense: a junior developer working on an unfamiliar codebase has less context to lose. The AI’s guess is as good as theirs. An expert’s context is valuable, and the copy-paste workflow throws it away.

What the faster developers do differently

The developers who actually get speed gains from AI tools share common patterns:

They keep AI in the editor. Tools like GitHub Copilot, Cursor, and Windsurf run inside the IDE where the AI can see the full project. No alt-tab, no copy-paste, no explaining what file you’re working on.

They use AI for generation, not consultation. Instead of asking “how do I implement X?” and reading a response, they describe what they want in a comment or prompt and let the AI generate code in place. The feedback loop is tighter because the output appears where it needs to go.

They pick tools that match their domain. A React developer using Cursor gets AI that understands JSX, component lifecycle, and the project’s import structure. A game developer using something like Ziva in Godot gets AI that can read the scene tree, analyze debugger output, and see what’s happening in the editor. The AI’s context matches the developer’s context.

They treat AI output as a first draft, not a solution. The METR study developers who were slowest were the ones who trusted AI output and spent time debugging it later. The faster developers used AI for initial scaffolding, then reviewed and adapted immediately.

Measuring your own context-switching cost

If you want to see how much the copy-paste workflow costs you, track it for a day. Count how many times you switch from your editor to a browser-based AI chat. Multiply by the number of minutes you spend there per visit (including the time re-reading the AI’s response and figuring out how to apply it). For most developers, this number lands between 45 and 90 minutes per day.

Then try the same tasks with an in-editor tool for a week. Cursor’s free tier is enough to test. If you’re working in a specific domain like game development, check if a specialized tool exists (Copilot for Xcode, Ziva for Godot, etc.). The difference isn’t subtle.

The context investment

Setting up AI tools that understand your project takes time upfront. Writing a good CLAUDE.md or .cursorrules file, configuring your MCP servers, or installing domain-specific plugins is an investment. But it’s a one-time cost that pays off across every interaction.

The alternative, explaining your project from scratch every time you open a chat window, is an ongoing cost that never decreases. It’s the difference between teaching someone your codebase once versus re-explaining it every conversation.

The METR study measured developers using AI tools as they existed in early 2025. The integration depth of AI tools has increased significantly since then. Chat windows are being replaced by in-editor assistants that see what you see. The productivity gap should narrow as context improves, but only for developers who stop treating AI as a separate tool and start treating it as part of their editor.

What Is New In Helm 4 And How It Improves Over Helm 3

The release of Helm 4 marks a massive milestone in the Kubernetes ecosystem. For years developers and system administrators have relied on this robust package manager to template deploy and manage complex cloud native applications. When the maintainers transitioned from the second version to Helm 3 the community rejoiced because it completely removed Tiller. That removal drastically simplified cluster security models and streamlined deployment pipelines. Now the highly anticipated Helm 4 is stepping into the spotlight to address the modern challenges of DevOps workflows. This comprehensive blog post will explore exactly what is new in Helm 4 and how it provides a vastly superior experience compared to the aging architecture of Helm 3.

To truly appreciate the leap forward we must understand the environment in which Helm 3 originally thrived. It served as the default standard for bundling Kubernetes manifests into versioned artifacts called Helm charts. However the cloud native landscape has evolved incredibly fast over the past few years. We have seen a massive push towards strict software supply chain security standardized artifact storage and advanced declarative GitOps workflows. While Helm 3 received incremental updates to support these new paradigms it eventually reached an architectural plateau. The core maintainers realized that bolting new features onto legacy code paths was no longer sustainable. Helm 4 was born out of the necessity to build a leaner faster and more secure package manager that natively understands the current state of Cloud Native Computing Foundation technologies.

The most fundamental shift in Helm 4 is the complete and unwavering embrace of Open Container Initiative standards. In the early days of Helm 3 hosting charts required a dedicated web server like ChartMuseum. You had to maintain a separate index file and manage specialized infrastructure just for your package management needs. Eventually the community introduced experimental support for OCI registries which allowed you to store your charts alongside your container images. While this feature eventually became generally available in Helm 3 it always carried legacy baggage that required specific command flags or awkward workarounds.

Helm 4 changes the paradigm by making OCI registries the absolute default and primary method for chart distribution. This means you can seamlessly use platforms like Amazon Elastic Container Registry Google Artifact Registry or GitHub Container Registry to store your deployments without any complex configuration. By dropping support for legacy repository index files Helm 4 dramatically reduces the complexity of managing private chart repositories. DevOps engineers no longer need to run scripts to regenerate index files every time they push a new chart version. Instead pushing a Helm chart to a registry is now as straightforward and reliable as pushing a standard Docker image.

Another area where Helm 4 shines incredibly bright is in its handling of Custom Resource Definitions. If you have ever managed complex Kubernetes operators with Helm 3 you are intimately familiar with the massive headache that CRDs present. By design Helm 3 only installs a Custom Resource Definition during the very first deployment of a chart. If the chart maintainer updates the CRD in a subsequent release running an upgrade command in Helm 3 will completely ignore the new definition. This limitation was originally implemented to prevent accidental data loss but it created a massive operational burden. Cluster administrators were forced to manually apply updated definitions using standard command line tools before they could safely upgrade their Helm charts.

Helm 4 tackles the CRD dilemma head on by introducing native lifecycle management for custom resources. The new architecture provides opt in mechanisms that allow Helm to safely patch update and manage the lifecycle of a Custom Resource Definition during an upgrade process. This is a game changer for teams heavily invested in the Operator Pattern or platforms like Istio Prometheus and ArgoCD which rely heavily on custom resources. The update mechanism includes safeguards and dry run capabilities to ensure that an automated upgrade does not accidentally strip critical fields from a running cluster. This greatly reduces the friction of automated Continuous Deployment pipelines and empowers Site Reliability Engineers to manage operator upgrades with total confidence.

Advanced values validation is another critical area where Helm 4 significantly outperforms Helm 3. In previous iterations deploying a chart with a massive configuration file often felt like playing a game of chance. If you made a slight typographical error in your configuration file Helm 3 would often silently ignore the unknown field and deploy the application with default settings. This could lead to underprovisioned resources missing environment variables or massive security vulnerabilities. While Helm 3 introduced basic JSON Schema validation it was optional loosely enforced and somewhat difficult to debug.

With the release of Helm 4 strict schema validation takes center stage. The engine now deeply integrates with modern JSON Schema drafting standards to ensure that every single value provided by the user is meticulously validated before any templates are rendered. If a user attempts to pass an undocumented variable or uses a string where an integer is expected Helm 4 will immediately halt the deployment and provide a highly legible error message pointing directly to the offending line. This shift towards strict default validation saves Kubernetes administrators countless hours of debugging failed deployments. Furthermore chart developers now have access to richer validation rules allowing them to enforce complex conditional logic right inside the schema file.

Software supply chain security has become a paramount concern for the entire technology industry. Over the past few years we have witnessed a massive increase in malicious actors targeting open source package managers to distribute compromised code. Helm 3 attempted to address provenance and integrity using basic cryptographic signing features tied to older PGP standards. Unfortunately the key management overhead associated with these legacy security models prevented widespread adoption. Most organizations simply ignored chart signing entirely because it was too difficult to integrate into an automated CI/CD pipeline.

Helm 4 modernizes package security by deeply integrating with the Sigstore ecosystem and leveraging modern keyless signing technologies. By natively supporting tools like Cosign Helm 4 allows developers to digitally sign their Helm charts using short lived identity tokens bound to their cloud provider or source control identity. When a Kubernetes cluster pulls down a chart the new engine can automatically verify the cryptographic signature against a transparent public ledger. This guarantees that the chart was created by a trusted entity and has not been tampered with during transit. By making these modern security frameworks the default standard Helm 4 ensures that zero trust security principles can be effortlessly applied to all of your cluster deployments.

Beyond major architectural shifts Helm 4 introduces a massive decluttering of the command line interface and the underlying codebase. The maintainers took this major version bump as an opportunity to completely strip away years of deprecated flags legacy environment variables and outdated command aliases. In Helm 3 the command line interface had grown somewhat bloated with overlapping commands and inconsistent output formats. Automation tools often struggled to parse the output of commands because certain errors were printed to standard output rather than standard error.

The Helm 4 command line tool features a beautifully standardized output model. Almost every single command now supports strict machine readable output formats like structured JSON and YAML. This standardization is a massive win for platform engineering teams who wrap the command line tool inside custom automation scripts orchestration platforms or internal developer portals. You no longer need to rely on fragile string matching algorithms to determine if a release was successful. You can simply parse the structured output to programmatically react to the state of your deployments. Additionally the internal codebase was extensively refactored to utilize modern Go programming patterns resulting in significantly faster execution times and reduced memory consumption when templating exceptionally large charts.

The relationship between Helm and modern declarative GitOps controllers has also been greatly refined in this new major release. Tools like FluxCD and ArgoCD have largely redefined how modern infrastructure teams interact with their clusters. Instead of manually running imperative commands from a local terminal engineers push their configuration files to a centralized repository and allow a specialized controller to synchronize the state. While Helm 3 works reasonably well in these environments the lack of standard machine readable output and the complicated CRD management often caused synchronization failures.

Helm 4 was built with GitOps principles natively in mind. The streamlined OCI artifact retrieval process allows in cluster controllers to fetch external dependencies much faster and with greater reliability. The strict schema validation ensures that configuration errors are caught immediately preventing broken manifests from ever reaching the live cluster. Because the core rendering engine is now decoupled from legacy repository retrieval logic external tools can import the underlying libraries much more efficiently. This creates a deeply symbiotic relationship between your package manager and your automated deployment controllers.

Migration and backward compatibility were heavily prioritized by the maintainers during the design phase of Helm 4. Unlike the painful transition from the second version which required massive cluster migrations and the total destruction of the Tiller deployment migrating to the new version is designed to be incredibly smooth. Existing release secrets stored in the cluster are fully recognized by the new engine. Most users will find that their existing well formed charts deploy perfectly under the new system without requiring any modifications. The primary required changes revolve around updating pipeline scripts to utilize the new strict OCI registry commands and resolving any schema validation errors that previous versions silently ignored.

For chart developers Helm 4 provides a much richer set of templating functions and built in helpers. The included templating engine has been upgraded to support newer string manipulation logic advanced mathematical operations and better dynamic dictionary generation. These additions allow developers to write significantly cleaner template logic with fewer nested conditionals and less repetitive boilerplate code. You can now easily implement complex routing logic inject dynamic sidecar containers and manage complex affinity rules using highly readable helper functions. The overarching goal is to make the chart developer experience as intuitive and powerful as possible while maintaining a clean separation between configuration values and the underlying manifest generation.

Testing and debugging also receive a significant overhaul. The built in testing suite has been expanded to support more comprehensive dry run simulations. When you execute a test command Helm 4 can perform a deeply thorough mock deployment against your live cluster state without actually committing any changes to the database. It will evaluate resource quotas check for naming collisions and validate your generated manifests against the actual application programming interface versions currently running on your cluster. This deep integration with the cluster control plane ensures that any simulated deployment accurately reflects reality drastically reducing the chances of a failed production release.

In conclusion the transition from Helm 3 to Helm 4 represents a critical maturation of the entire Kubernetes package management ecosystem. By ruthlessly shedding legacy support for outdated repository formats and fully committing to modern OCI registries the maintainers have future proofed the project for years to come. The elegant solutions provided for lifecycle management of Custom Resource Definitions alone make the upgrade entirely worthwhile for complex engineering organizations. Coupled with strict configuration validation keyless cryptographic signing and improved structured output the new version empowers teams to build robust secure and highly automated delivery pipelines.

As the cloud native computing environment continues to grow in complexity having a deeply reliable package manager is non negotiable. Helm 4 proves that even the most established tools in the ecosystem can adapt innovate and evolve to meet the demanding requirements of modern DevOps methodologies. Whether you are managing a small personal cluster or a massive multi tenant enterprise platform upgrading to Helm 4 will provide you with a cleaner safer and dramatically more efficient operational experience. Start evaluating your existing deployment scripts begin migrating your legacy repositories to modern container registries and prepare your infrastructure to fully leverage the incredible power of this next generation deployment engine.