Designing accessible color systems and ensuring contrast across themes

  • [Why contrast still breaks at scale (WCAG fundamentals and common blind spots)]
  • [How to structure color tokens so themes don’t betray accessibility]
  • [Practical test matrix: how to test contrast across themes, states, and components]
  • [Developer handoff and CI: tokens, Storybook, and automated contrast checks]
  • [A ready-to-run checklist and step-by-step protocol]

Color contrast is the accessibility failure you’ll still discover the day before release — not because WCAG is vague, but because the system around your colors is fragile. Treating palette values as static hex strings guarantees regressions when themes, overlays, or component states multiply.

The previous release cycle illustrated the pattern: designers hand over a brand palette; engineers wire the hex values into components; QA flags a dozen contrast failures across hover, focus, and dark-mode states; designers push new swatches; the system ends up with local fixes and visual drift. That cascade costs time, creates inconsistent UX, and — most importantly — leaves users with reduced access.

Why contrast still breaks at scale (WCAG fundamentals and common blind spots)

  • The measurable targets are simple and non-negotiable: normal text needs at least a 4.5:1 contrast ratio, large text (≥ 18pt / 24px, or 14pt bold / 18.66px) needs 3:1.
  • UI controls, icons and meaningful graphical objects must meet a non-text contrast minimum of 3:1 against adjacent colors (this is a WCAG 2.1 addition, SC 1.4.11).
  • Contrast is computed using the relative luminance of colors and the ratio formula (L1 + 0.05) / (L2 + 0.05) where L1 is the lighter luminance. Use that rule when you compute checks.
Content type WCAG target
Normal body text 4.5:1
Large text (≥18pt or 14pt bold) 3:1
UI components & graphical objects 3:1

Important: Visible keyboard focus and state indicators must not rely on color alone; the focus indicator itself must be perceivable and meet non-text contrast where it is required.

Common blind spots (real bugs we see in production)

  • Using brand hex values directly inside components instead of semantic tokens: brand palettes often fail when placed on a neutral surface or inside translucent overlays.
  • Assuming a pass on a single canvas equals pass everywhere: hover, focus, visited, active, disabled, error, success states each create new color pairings to validate. WebAIM’s walkthrough of a simple checkbox demonstrates how many checks a single control can induce.
  • Forgetting alpha/transparency: semi-transparent icons or overlays composite with underlying surfaces and change effective contrast; compute composite colors during tests.
  • Ignoring forced-colors / high contrast or prefers-contrast scenarios: browsers or OS settings can remap colors, so test with forced color modes as part of your matrix.

Practical consequence: automated tools catch a lot, but not everything — axe and similar engines find many issues early, yet manual review and stateful tests remain necessary.

How to structure color tokens so themes don’t betray accessibility

Design tokens must be semantic and themed — not a long list of hex pairs. Treat tokens as the contract between design and code.

Principles

  • Define a small set of role-based tokens (color-bg-default, color-surface-elevated, color-text-primary, color-text-muted, color-border, color-focus-ring, color-icon-default, color-state-error-bg) and map brand colors to aliases of those tokens.
  • Keep base (brand) colors separate from semantic tokens. semantic tokens express intent; base colors are raw inputs that feed generators and export pipelines.
  • Use a perceptual color space (LCH / OKLCH) to produce tints and shades predictably across hues. In practice, oklch() or lch() lets you change lightness without surprising hue shifts, which makes contrast generation more reliable.

Example token (DTCG-style JSON) — base + semantic aliasing:

{
  "color": {
    "base": {
      "brand": { "value": "#0f62fe", "comment": "raw brand blue" },
      "neutral-0": { "value": "#ffffff" },
      "neutral-900": { "value": "#0b0b0b" }
    },
    "semantic": {
      "bg-default": { "value": "{color.base.neutral-0}" },
      "text-primary": { "value": "{color.base.neutral-900}" },
      "button-primary-bg": { "value": "{color.base.brand}" },
      "button-primary-text": { "value": "{color.base.neutral-0}" }
    }
  }
}

Export strategy

  • Produce platform-specific outputs: CSS custom properties, JS modules, iOS/Android tokens. Use a token transformer like Style Dictionary or a DTCG-compatible exporter to generate :root variables and @media (prefers-color-scheme: dark) overrides.
  • Store tokens in a single versioned package (@company/design-tokens) and import into both application and Storybook. This single source of truth reduces ad-hoc overrides.

Example CSS output pattern:

:root {
  --color-bg-default: #ffffff;
  --color-text-primary: #0b0b0b;
  --color-button-primary-bg: #0f62fe;
  --color-button-primary-text: #ffffff;
}

@media (prefers-color-scheme: dark) {
  :root {
    --color-bg-default: oklch(0.13 0.02 260); /* dark surface */
    --color-text-primary: oklch(0.95 0.01 260);
    --color-button-primary-bg: oklch(0.58 0.18 248);
  }
}

Naming conventions that scale

  • Use color.<role>.<intent> or color.<category>.<role> rather than enumerating shades by number when the token drives component semantics. Example: color.button.primary.bg, color.icon.default, color.error.bg.

Contrarian note: Resist creating separate color scales per component. A limited, semantically-driven palette plus algorithmic shade generation keeps maintenance manageable and predictable.

Practical test matrix: how to test contrast across themes, states, and components

Create an explicit test matrix and automate as much as possible.

Minimal matrix (rows you must check)

  • Themes: light, dark, forced-colors/HC, high-contrast emulation (where supported).
  • Component states: default, hover, focus, active, disabled, visited (links), error/success decorations.
  • Element types: body copy, headings, button labels, icon-only buttons, form placeholders, focus outlines, charts/legends.

Sample table excerpt

What to test Exact pairing to check WCAG target
Body text on surface text-primary vs bg-default 4.5:1
Button label on button bg button-text vs button-bg 4.5:1 (or 3:1 if large)
Icon on button icon fill vs button-bg 3:1 (non-text)
Focus ring on button focus-color vs adjacent surface 3:1 (non-text)
Link color vs surrounding text link-color vs surrounding-text 3:1 (distinctness)

Automated contrast calculation (code)

  • Use the WCAG relative luminance / contrast formula; when alpha is present, composite the foreground over the background in linear space before computing luminance. The example below uses the standard WCAG conversion and composite math.
// contrast-utils.js (simplified)
function hexToRgb(hex) {
  const v = hex.replace('#','');
  const bigint = parseInt(v.length===3 ? v.split('').map(c=>c+c).join('') : v, 16);
  return [(bigint >> 16) & 255, (bigint >> 8) & 255, bigint & 255];
}
function srgbToLinear(c) {
  c = c / 255;
  return c <= 0.04045 ? c / 12.92 : Math.pow((c + 0.055) / 1.055, 2.4);
}
function relativeLuminance(hex) {
  const [r,g,b] = hexToRgb(hex).map(srgbToLinear);
  return 0.2126 * r + 0.7152 * g + 0.0722 * b;
}
function contrastRatio(hexA, hexB) {
  const L1 = relativeLuminance(hexA);
  const L2 = relativeLuminance(hexB);
  const lighter = Math.max(L1, L2);
  const darker  = Math.min(L1, L2);
  return (lighter + 0.05) / (darker + 0.05);
}

Citation: use the luminance/contrast formulas defined in WCAG.

Testing tips for alpha/blended layers

  • Compute the composited color for a semi-transparent foreground over the dynamic background, then compute contrast against the (resulting) background. Do not assume the alpha value maintains the original contrast.

Automated scanning in E2E/component suites

  • Use Playwright + axe to scan stories and pages programmatically, running scans in both light and dark emulation using browser.newContext({ colorScheme: 'dark' }) or the Playwright test.use({ colorScheme: 'dark' }) fixture.

Example Playwright + axe snippet:

import { test, expect } from '@playwright/test';
import AxeBuilder from '@axe-core/playwright';

test('component stories should have no accessible contrast violations - light', async ({ page }) => {
  await page.goto('http://localhost:6006/iframe.html?id=button--primary');
  const results = await new AxeBuilder({ page }).analyze();
  expect(results.violations).toHaveLength(0);
});

test('component stories should have no accessible contrast violations - dark', async ({ browser }) => {
  const ctx = await browser.newContext({ colorScheme: 'dark' });
  const page = await ctx.newPage();
  await page.goto('http://localhost:6006/iframe.html?id=button--primary');
  const results = await new AxeBuilder({ page }).analyze();
  expect(results.violations).toHaveLength(0);
});

Playwright’s colorScheme option lets you emulate prefers-color-scheme.

Visual regression vs. contrast checks

  • Use visual diffs (Percy, Chromatic) to catch regressions in appearance, and automated accessibility scanners (axe, lighthouse) to surface semantic contrast failures. Automated tools will find many contrast issues but leave some cases as incomplete where human review is required.

Developer handoff and CI: tokens, Storybook, and automated contrast checks

Make the tokens the single source of truth, wire Storybook to those tokens, and gate merges with automated accessibility tests.

Storybook + a11y integration

  • Add the Storybook a11y addon (@storybook/addon-a11y) so component authors get real-time feedback while building stories. Configure parameters.a11y.test = 'error' in your Storybook test runner to fail CI when axe finds violations in stories.
  • Run the Storybook test runner (with axe-playwright or the Storybook test-runner) to scan every story in CI. This converts per-story visual checks into deterministic, automatable tests.

Example .storybook/preview.js snippet:

export const parameters = {
  a11y: { 
    config: { /* axe config */ },
    options: {}
  }
};

CI recipe (high level)

  1. Build tokens and export platform artifacts (npm run build:tokens).
  2. Build Storybook with the token output.
  3. Run Storybook test-runner / Playwright accessibility tests across light and dark emulations (npx playwright test or node scripts/a11y.js).
  4. Fail PRs when critical contrast violations appear (error level).

Sample GitHub Actions job (abridged):

name: a11y
on: [pull_request]
jobs:
  test:
    runs-on: ubuntu-latest
    steps:
      - uses: actions/checkout@v4
      - uses: actions/setup-node@v4
        with: { node-version: '18' }
      - run: npm ci
      - run: npm run build:tokens
      - run: npm run build-storybook
      - run: npx playwright install --with-deps
      - run: npx playwright test --project=chromium

Add npx playwright test or node scripts that run axe scans for Storybook stories and attach HTML reports on failure. Tools like expect-axe-playwright or axe-playwright simplify assertion plumbing.

Metadata and handoff docs

  • Export a tokens-a11y-report.json listing each semantic token and the contrast ratios against surfaces it’s intended for. Attach that artifact to releases so product teams review the accessibility status of tokens before they reach products.

A ready-to-run checklist and step-by-step protocol

  1. Create a minimal semantic color token set.

    • color.bg.default, color.surface.raised, color.text.primary, color.text.secondary, color.icon, color.border, color.focus, color.brand.primary, color.state.error.bg, color.state.success.bg.
  2. Author brand inputs in a base group and alias into semantic tokens.

    • Store in a token repo and version it: packages/design-tokens.
  3. Use a transformer (Style Dictionary / DTCG tool) to export:

    • CSS variables for web, JS modules for runtime, platform tokens for iOS/Android.
  4. Implement theming strategy:

    • Default :root values + @media (prefers-color-scheme: dark) overrides, or use color-scheme and oklch() for perceptual steps.
  5. Add Storybook and wire tokens into stories.

    • Add @storybook/addon-a11y and set parameters.a11y.test = 'error'. Use decorators to toggle prefers-color-scheme and component states.
  6. Write automated accessibility tests:

    • Component-level Playwright tests that load stories and run AxeBuilder.analyze() under light and dark contexts. Use expect(results.violations).toHaveLength(0) for gating.
  7. Calculate alpha and overlay effects:

    • For every translucent UI element (dialogs, badges, overlays), compute the composited color and then compute contrast. Add the composite step to the contrast utility function.
  8. CI enforcement:

    • Run token build → Storybook → Playwright/axe scans as part of PR checks. Fail when new violations are introduced or when token changes reduce contrasts below thresholds.
  9. Manual and assistive-tech checks:

    • Pair automated checks with keyboard-only navigation, screen reader spot checks and high-contrast/forced-colors checks to catch the gaps automation misses.
  10. Capture and ship artifacts:

    • Produce an accessibility report per build (JSON + HTML) and attach to PRs. Store audit evidence as part of your release notes.

Quick operational rule: Make token changes require a review that includes automated reports. Treat token changes like library upgrades — expect a follow-up test sweep.

Sources:
Understanding Success Criterion 1.4.3: Contrast (Minimum) – Official WCAG explanation of 4.5:1 and 3:1 thresholds, rationale and exceptions used for text contrast requirements.

Understanding Success Criterion 1.4.11: Non-text Contrast – W3C guidance on the 3:1 non-text contrast requirement for UI components and graphical objects.

WCAG 2.1 definitions: Contrast ratio & relative luminance – The exact formula and the relative luminance conversion steps that underpin contrast calculations.

prefers-color-scheme — MDN Web Docs – Browser-facing guidance for detecting user theme preference and practical theming examples.

CSS Color values — MDN Web Docs (oklch / oklab) – Rationale and examples for using perceptual color spaces like oklch()/oklab() in theming.

Evaluating Color and Contrast — WebAIM blog – Practical, state-aware examples showing the number of checks required for simple controls (links, checkboxes, focus states).

Accessibility tests — Storybook Docs – How Storybook’s a11y addon leverages axe-core, plus configuration for running accessibility tests in Storybook and CI.

axe-core (Deque) — GitHub repository – Axe-core’s documentation and API for automated accessibility testing; guidance on what automated engines catch and how to integrate.

Style Dictionary — design tokens tooling – Practical tooling and concepts for exporting design tokens to platform artifacts (CSS, iOS, Android, JS).

Design Tokens Community Group / Designtokens.org – The DTCG effort and spec framing the modern, interoperable approach for design tokens and cross-tool workflows.

Accessibility testing — Playwright Docs – Playwright examples for running accessibility checks with @axe-core/playwright and using colorScheme emulation for prefers-color-scheme.

WebAIM Color Contrast Checker – A practical, browser-based contrast checker to test single color pairs interactively.

Media Queries Level 5 — forced-colors – Specification text explaining forced-colors and how forced/high contrast modes interact with author styles.

Automate accessibility tests with Storybook (Storybook blog) – Example patterns for using the Storybook test runner and axe-playwright to automate accessibility checks for stories.

Treat your color system as code: make tokens the single source of truth, apply automated contrast checks across themes and states, and require token-level accessibility evidence before releases so the next “surprise” is a single failing test in CI rather than a production outage.

Agents are slow

A scene from the TV show Stranger Things, featuring the character Eleven looking overwhelmed and intense, symbolizing the chaos of managing multiple tasks or agent sessions.

Coding with agents definitely gives you more power. With a couple of sentences in natural language, you can create something that would take weeks. Yet I feel there is a fundamental flaw in this process: you need to wait too long for a result. Agents give you superpowers, but they destroy flow state.

Before we start with agents, I must confess that I freak out when there is too much delay between me typing a key and a letter appearing in the editor. That’s the kind of thing that distracts me, even if it’s only milliseconds. I remember trying a lot of markdown editors a couple of years ago and rejecting them one by one because the character I typed was not there immediately. It was that distracting.

I also use a Vim plugin in my IDE because it allows me to make small changes very fast: appending text at the beginning or end of the line (I, A), removing multiple lines with a single command (d + 11 + ↓), or selecting and substituting a block of text. And then there’s the killer feature: the dot shortcut (.), which repeats the last edit action.

Tab is the new dot

But to be honest, I use Vim’s dot less often now. Cursor guesses your intent, suggests the location of the next change, and you just press tab. It moves the cursor there, you press tab a second time, and the change is applied. You don’t need an internal monologue about which sequence of operations to repeat with a dot, and you don’t need to navigate to that line. Everything just happens, immediately.

I wish I could have something similar with agent-assisted coding.

Typically, when you code by hand, you want to keep the time between change and validation short. Compilation should be real time, with hot reload in the running app. Tests should run fast. Programming is the art of minimizing feedback loops.

If you don’t optimize it and you make a change, you need to wait a couple of minutes for test results. You get distracted. You’re either idle, browsing social media, or starting another task. When the tests eventually finish, you need to recall the context, which takes time and effort. That effort accumulates and makes you tired.

The multi-agent context-switching hell

When an agent is doing a coding task, it usually takes a couple of minutes. Enough to get distracted. Worse, it feels easy to trigger another agent.

Agent thoughts displayed by Cursor or Claude feel like progress, but they’re just a spinner with better PR. You can stare at them, sure, but it seems like a waste of time.

You end up spinning another agent while waiting for the current one. First, you need to think about what you want to achieve and then type an informative prompt, maybe reformulating it a couple of times because the first version seems ambiguous. Then you press enter and check the status of the current sessions. Once you find the one that ended, you need to recall what the project was and what the agent was actually doing. Yet another context switch.

You have multiple tasks running in parallel and multiple contexts, and you switch over and over. It’s draining. You feel overwhelmed, your context evaporates, and your performance collapses.

A scene from the TV show Stranger Things, featuring the character Eleven looking overwhelmed and intense, symbolizing the chaos of managing multiple tasks or agent sessions.

This is me managing a dozen agent sessions at the same time. Stranger Things, Netflix

The ideal world?

Fast local feedback loops like hot reload, instant tests, and Cursor Tab provide superpowers while preserving deep work. In contrast, slow agent loops offer similar benefits, but at the cost of cognitive overload.

In an ideal world, I type my intent in a more convenient way than verbose natural language, maybe with some lightweight meta-language that strips out the fluff, maybe with a non-invasive brain-computer interface.

Then the result appears immediately. The app I’m working on is refreshed automatically and I can see a nice diff, such as the one presented by Cursor. Possibly I can even browse alternate versions and pick the one that fits best. Then I review, point out issues, and ask for improvements.

I can iterate fast in the same window, focusing on a single project and staying deeply focused on the task I want to achieve. That would be faster and less draining than managing multiple agents at the same time.

We are not there yet, but I believe we’ll reach that point. Maybe fast agents will win over autonomous ones, and we’ll regain flow state.

Originally posted at www.dzikowski.online.

Cryogenic Storage: A Developer’s Guide (Yes, Really)

Why programmers should care about liquid nitrogen dewars

Hear me out. You’re building a biotech SaaS platform. Your users manage IVF labs. They need inventory systems tracking samples in liquid nitrogen storage dewars.

You assume it’s straightforward: database table, foreign keys, done.

It’s not.

The data model that breaks everything

-- This seems logical
CREATE TABLE samples (
  id UUID PRIMARY KEY,
  patient_id UUID REFERENCES patients(id),
  location TEXT -- "Dewar 3, Canister 2, Cane 5, Position 3"
);

Problem: That location string is actually a complex hierarchy with thermal and retrieval-time implications.

When a technician searches for sample XYZ, your app needs to:

  1. Identify which dewar (affects nitrogen level requirements)
  2. Pinpoint exact canister (affects lid-open duration)
  3. Calculate retrieval time (affects temperature stability)
  4. Log access for regulatory compliance

The correct model

CREATE TABLE dewars (
  id UUID PRIMARY KEY,
  capacity_litres INTEGER,
  canister_count INTEGER,
  current_ln2_level DECIMAL
);

CREATE TABLE canisters (
  id UUID PRIMARY KEY,
  dewar_id UUID REFERENCES dewars(id),
  position INTEGER,
  colour_code VARCHAR(20)
);

CREATE TABLE canes (
  id UUID PRIMARY KEY,
  canister_id UUID REFERENCES canisters(id),
  position INTEGER,
  sample_type VARCHAR(50)
);

CREATE TABLE samples (
  id UUID PRIMARY KEY,
  cane_id UUID REFERENCES canes(id),
  position INTEGER,
  freeze_date TIMESTAMP,
  patient_id UUID REFERENCES patients(id)
);

Now you can query: “Which canisters contain embryos from patients under 35?” or “What’s the optimal retrieval sequence for today’s thaw list?”

Why this matters

UK suppliers like Cryolab provide systems with 6-10 canisters per dewar, each holding 10-12 canes, each carrying 10-12 straws. That’s 3-4 levels of nesting your database needs to represent accurately.

Mess this up and your users spend 90 seconds hunting for samples with the dewar lid open, causing temperature spikes that damage biological material worth £8,000 per sample.

The API nobody built (yet)

// What fertility labs actually need
const retrievalPlan = await api.samples.getOptimalRetrieval({
  sampleIds: ['uuid1', 'uuid2', 'uuid3'],
  minimizeLidOpenTime: true
});

// Returns: "Open Canister 2, retrieve Cane 5 (samples 1,3), 
// then Cane 7 (sample 2). Total lid-open time: 18 seconds"

Build this and you’ll win every biotech client in the UK.

Further reading: Check out Cryolab’s technical specs at cryolab.co.uk—actual equipment dimensions matter when you’re building 3D visualisation features.

I Built a Model… and the Internet Lowkey Noticed (Before I Did)

I wasn’t checking metrics.
I wasn’t running ads.
I definitely wasn’t doing “growth hacking” (because let’s be honest… I’d probably mess that up anyway).

I was just building.

And then one random day…
I searched my own project name.

Bad idea? Usually yes.
This time? …not completely.

Wait… People Are Actually Talking About This?

Somewhere between curiosity and mild ego-checking, I noticed something:

  • Mentions on LinkedIn
  • A few write-ups and discussions
  • People explaining my own idea… in their own way

Not viral.
Not trending.
But also not zero.

Which, if you’ve ever built something and released it into the void, you know is basically a miracle.

The Project: SmartKNN

For context, I built SmartKNN — A feature-weighted KNN algorithm with automatic preprocessing, normalization, and learned feature importance.

SmartKNN GitHub Repository

Nothing fancy like “reinventing AI.”
Just trying to make something actually usable without melting CPUs.

(Yes, shocking concept in 2026.)

So… Is Anyone Actually Using It?

Surprisingly… yes.

~3.5K+ installs on PyPI
Consistent small-scale adoption
People experimenting with it in their own projects

Not “unicorn startup” numbers.
More like: “okay… this is not embarrassing anymore” numbers.

Things I Learned (aka Getting Humbled in Public)

** Your idea is not yours anymore**

The moment you put something out there:

  • People interpret it differently
  • Use it in ways you didn’t expect
  • Sometimes explain it better than you

Where It Stands Now

SmartKNN is still early.

There’s a lot left:

Better benchmarks
More real-world validation
Improvements based on actual usage

So yeah… not “finished.”
More like: “finally out of the tutorial phase”

And You don’t need millions of users to validate your work.

Sometimes:

  • A few mentions
  • A few users
  • A few real problems

…are enough to prove that you’re not just building in isolation.

🚀 Day 27 of My Automation Journey – Introduction to Selenium & Maven Setup


Today marks a big milestone in my automation journey 🎯

Till now, I was learning core Java logic
👉 Today, I stepped into real automation using Selenium

This is where things get exciting 🔥

🔹 1. What is Selenium?

👉 Selenium is a tool used for automating web browsers

That means:

  • Opening a browser 🌐
  • Navigating websites
  • Clicking buttons
  • Filling forms
  • Validating UI

💡 In simple terms:

👉 If you can do it manually in a browser, Selenium can automate it.

🔹 2. Why Selenium?

✔ Saves time ⏱
✔ Reduces manual effort
✔ Useful for testing & automation
✔ Industry standard tool

🔹 3. Setting Up Selenium using Maven

Instead of downloading jars manually, we use Maven 📦

👉 Maven helps manage:

  • Dependencies
  • Versions
  • Project structure

🔹 4. Understanding pom.xml File

This is the heart of a Maven project ❤️

💻 Sample pom.xml:

<project xmlns="http://maven.apache.org/POM/4.0.0">

    <modelVersion>4.0.0</modelVersion>

    <groupId>Selenium1</groupId>
    <artifactId>Selenium1</artifactId>
    <version>0.0.1-SNAPSHOT</version>

    <properties>
        <maven.compiler.source>17</maven.compiler.source>
        <maven.compiler.target>17</maven.compiler.target>
    </properties>

    <dependencies>

        <dependency>
            <groupId>org.seleniumhq.selenium</groupId>
            <artifactId>selenium-java</artifactId>
            <version>4.18.1</version>
        </dependency>

    </dependencies>

</project>

🔍 Explanation (Important 🔥)

🧠 Project Info:

  • groupId → Project/company name
  • artifactId → Project name
  • version → Current version

⚙️ Properties:

<maven.compiler.source>17</maven.compiler.source>

👉 Defines Java version

📦 Dependencies:

<dependency>

👉 This is where we add external libraries

🔹 5. How to Add Dependency from Maven Repository

👉 Go to: mvnrepository.com

Steps:

  1. Search → selenium-java
  2. Select latest version
  3. Copy dependency
  4. Paste inside <dependencies>

💡 Why this is important?

👉 Instead of manual setup, Maven automatically:

  • Downloads jars
  • Manages versions
  • Handles conflicts

🔹 6. Creating Selenium Setup

Once dependency is added ✅

👉 Maven will download everything automatically

Now we are ready to write our first automation program 🚀

🔹 7. First Selenium Program

package first;

import org.openqa.selenium.WebDriver;
import org.openqa.selenium.chrome.ChromeDriver;

public class First {

    public static void main(String[] args) {

        ChromeDriver driver = new ChromeDriver();
        driver.get("https://google.com");

    }
}

🔍 Logic Explained:

  • ChromeDriver → launches Chrome browser
  • driver.get() → opens website

👉 That’s it! Your first automation script 🎉

⚠️ Important Notes:

✔ ChromeDriver should match browser version
✔ Browser will open automatically
✔ Close using driver.quit()

🔹8. 🌐 Browsers Supported by Selenium

Selenium supports multiple browsers using specific drivers 👇

✅ Browser / Driver Mapping

Browser Driver
Google Chrome ChromeDriver
Mozilla Firefox GeckoDriver
Microsoft Edge EdgeDriver
Safari SafariDriver
Internet Explorer IEDriverServer
Opera OperaDriver
Chromium ChromeDriver
Brave ChromeDriver
Vivaldi ChromeDriver

💡 Key Insight:

👉 Most modern browsers are Chromium-based

👉 So they work using ChromeDriver

🔹9. 💻 Operating Systems Supported by Selenium

Selenium is cross-platform and works across multiple environments 👇

✅ OS / Support Type

Operating System Support
Windows Supported
macOS Supported
Linux Supported
Unix Supported

🔧 Extended Environment Support

Environment Support
Docker Supported
Jenkins (CI/CD) Supported
GitHub Actions Supported
AWS / Azure / GCP Supported

💡 Key Insight:

👉 Selenium scripts can run on any OS where browser + driver is available

👉 This enables:
✔ Cross-browser testing

✔ Cross-platform automation

✔ Scalable test execution 🚀

🔹 10. Real-World Use Cases

👉 Login automation
👉 Form submissions
👉 Testing UI flows
👉 Web scraping (basic level)

🔚 Final Takeaways

✔ Selenium = Browser Automation
✔ Maven = Dependency Management
✔ pom.xml = Project configuration
✔ Easy setup using Maven repository
✔ First step into real automation 🚀

🤖 A Small Note
I used ChatGPT to help structure and refine this blog while keeping the concepts aligned with my learning.

Direct Thermal Printing from Android Web Using PHP (ESC/POS Guide)

POS Invoice

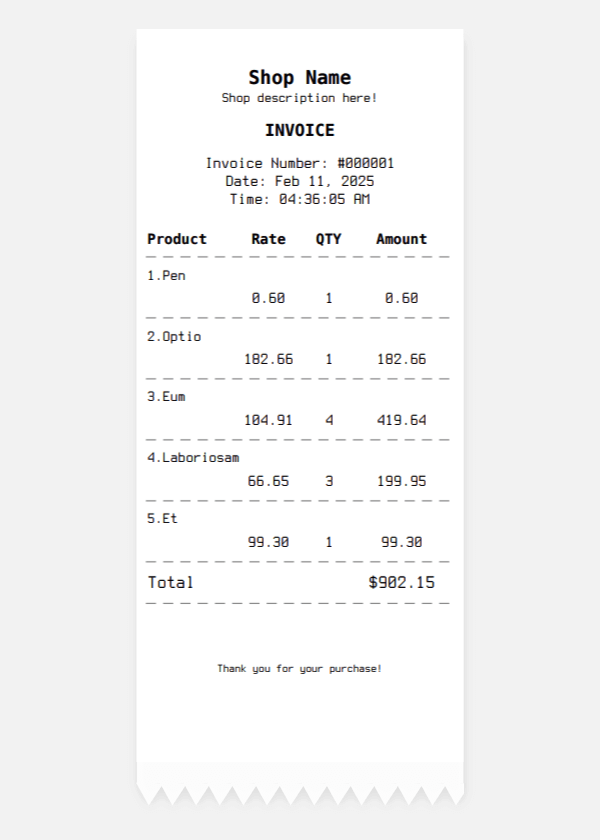
Print receipts directly to any ESC/POS thermal printer from your web-based POS system — no SDK, no cloud, no hassle.

POS Invoice

The Problem

Browsers can’t talk to thermal printers. Bluetooth SDKs are buggy. Cloud printing is slow.

The Solution

POSBridge – a free Android app that acts as a bridge between your PHP web app and USB/Bluetooth/Network thermal printers.


⚡ How Direct Thermal Printing Works

PHP → Encode → Custom URL → Android → POSBridge → Printer

This method uses Android deep linking to pass print data.

🧾 PHP ESC/POS Receipt Example

Use this optimized PHP code:

<?php 

$data = "[C]<font size='big'><b>POSBRIDGE STORE</b></font>n".
"[C]Calicut, Keralan".
"[C]Tel: +1 9605884551n".
"[L]n".
"[C]--------------------------------n".
"[C]<b>INVOICE</b>n".
"[C]--------------------------------n".
"[L]Order No : 045n".
"[L]Date     : 19-03-2026n".
"[L]n".

"[L]<b>Item</b>            [R]<b>Price</b>n".
"[C]--------------------------------n".

"[L]Beautiful Shirt     [R]$9.99n".
"[L]  Size: Sn".
"[L]n".

"[L]Awesome Hat         [R]$24.99n".
"[L]  Size: 57/58n".
"[L]n".
"[C]--------------------------------n".
"[R]Subtotal           $34.98n".
"[R]Tax (5%)           $1.75n".
"[C]--------------------------------n".
"[R]<b>TOTAL</b>       <b>$36.73</b>n".
"[C]================================n".
"[L]n".
"[L]<b>Customer</b>n".
"[L]Arshid KVn".
"[L]Calicut, Keralan".
"[L]Ph: +1-9605884551n".
"[L]n".
"[C]<qrcode size='25'>https://phpbolt.com</qrcode>n".
"[L]n".
"[C]Thank you for your purchase!n".
"[C]Visit againn";

// Compress print data
$compressed = gzencode($data, 9);

// Encode for URL (important for Android intent)
$encoded = rtrim(strtr(base64_encode($compressed), '+/', '-_'), '=');

// Trigger print via deep link
echo "<a href='pos-bridge://print?print-data=".$encoded."'>Print Receipt</a>";

Quick Start

  1. Install – POSBridge on Google Play

  2. Connect – Pair your thermal printer (USB/Bluetooth)

  3. Copy – Use the PHP code above

  4. Print – Click the link from any Android browser

Elegant Rust with proc macros

When writing immediate mode (egui) applications it comes to me quickly that nigh all logic computations should be done off the UI thread. There are many ways to approach it, however as a fan of event-based systems sooner or later I implement some kind of event handling. The pattern is almost the same with minor differences and looks like this:

#[derive(Clone)] pub struct ProcessorConfig { pub id: String }
#[derive(Clone)] pub struct TaskResult { pub success: bool }
pub struct State { pub active_tasks: Vec<u32> }

#[derive(Clone)]
pub enum Event {
  ProcessorStart { config: ProcessorConfig },
  ProcessorStop,
  LongRunningTask { id: u32 },
  LongRunningTaskComplete { task_result: TaskResult },
}

struct EventHandler {
  state: Arc<RwLock<State>>,
  tx: tokio::mpsc::Sender<Event>,
}

impl EventHandler {
  fn handle(&self, event: Event, event_queue: &mut VecDeque<Event>) {
    use Event::*;
    match event {
      ProcessorStart { .. } => self.process_processor_start(event, event_queue),
      ProcessorStop => self.process_processor_stop(event, event_queue),
      LongRunningTask { .. } => self.process_long_running_task(event, event_queue),
      LongRunningTaskComplete { .. } => self.process_long_running_task_complete(event, event_queue),
    }
  }

  fn process_processor_start(&self, event: Event, _event_queue: &mut VecDeque<Event>) {
    let Event::ProcessorStart { config } = event else {
      return;
    };
    println!("Starting processor with config: {}", config.id);
    // ...
  }

  fn process_processor_stop(&self, event: Event, _event_queue: &mut VecDeque<Event>) {
    let Event::ProcessorStop = event else {
      return;
    };
    println!("Stopping processor...");
    // ...
  }

  fn process_long_running_task(&self, event: Event, _event_queue: &mut VecDeque<Event>) {
    let Event::LongRunningTask { id } = event else {
      return;
    };

    println!("Starting task {}", id);
    if let Ok(mut state) = self.state.write() {
      state.active_tasks.push(id);
    }
  }

  fn process_long_running_task_complete(&self, event: Event, _event_queue: &mut VecDeque<Event>) {
    let Event::LongRunningTaskComplete { task_result } = event else {
      return;
    };

    println!("Task completed. Success: {}", task_result.success);
    if let Ok(mut state) = self.state.write() {
      state.active_tasks.clear(); 
    }
  }

…

Design rationale

Code above has some design decisions that were developed over the years and it has specific needs “baked in” as a result. E.g.:

  1. Serialization/deserialization and clone for Event is very important. I want to save stream to be able to: recreate the state, re-run event, create an event log etc. Starting with serialization and clone requirement makes sure that all events have adequate shape.

  2. Arc<RwLock<State>> allows to defer processing to background threads and make a callback with state modification. It also keeps Sender<Event> for interacting with event system.

  3. &mut VecDeque<Event> is an event pushback, it works with following loop pattern:

   loop {
       let first = rx.recv().await?;
       queue.push_back(first);

       while let Ok(ev) = rx.try_recv() { 
           queue.push_back(ev); 
       }

       while let Some(ev) = queue.pop_front() {
           self.handle(ev, &mut queue).await;
       }
   }

Doing self.tx.clone().send(...) in the same thread could end up deadlocking receiver and the whole application. To avoid deadlock same-thread processor can send event directly to queue instead. Another feature coming from the pattern is also an in-place event transformations. For example it allows for upgrading events without changing processing order (by event_queue.push_front during processing logic).

I’ll note that in example I didn’t use Envelope pattern – even though in final code I do. In a nutshell: Envelope replaces Event with a wrapper-like structure, i.e. Envelope { event: Event, ...}. Extra data can be included in envelope, a data that doesn’t impact on processing but provides useful information. Such data can be, for example, a tracing::Span (for telemetry it is almost required) or (in distributed systems) origin system, timestamps, correlation etc. Envelopes should be processed in a same way by processors and they add to boilerplate. EventEnvelope processor could like like this:

#[tracing::instrument(skip_all, parent: &envelope.span)]
fn process_some_task(&self, envelope: EventEnvelope, event_queue: &mut VecDeque<EventEnvelope>) {
  CustomCounter::count_origin(envelope.origin);
  let Event::SomeTask { value } = envelope.event else { return ; };

  // ...
}

A Perfect World

After implementing same thing thrice I was ready to make a macro for it. I love macros, even though I understand that they shadow the code and add to complexity. This is the same code as the initial example, but in proc-macro version.

#[derive(Clone)] pub struct ProcessorConfig { pub id: String }
#[derive(Clone)] pub struct TaskResult { pub success: bool }
pub struct State { pub active_tasks: Vec<u32> }

struct EventHandler {
    state: Arc<RwLock<State>>,
    tx: tokio::mpsc::Sender<Event>,
}

#[event_macros::event_processor]
impl EventHandler {
    #[handler(ProcessorStart)]
    fn process_processor_start(&self, config: ProcessorConfig) {
        println!("Starting processor with config: {}", config.id);
        // ...
    }

    #[handler(ProcessorStop)]
    fn process_processor_stop(&self) {
        println!("Stopping processor...");
        // ...
    }

    #[handler(LongRunningTask)]
    fn process_long_running_task(&self, id: u32) {
        println!("Starting task {}", id);
        if let Ok(mut state) = self.state.write() {
            state.active_tasks.push(id);
        }
    }

    #[handler(LongRunningTaskComplete)]
    fn process_long_running_task_complete(&self, task_result: TaskResult) {
        println!("Task completed. Success: {}", task_result.success);
        if let Ok(mut state) = self.state.write() {
            state.active_tasks.clear(); 
        }
    }
}

I really, really like it. Transformed code from that example is the same as the initial code.

What transformations are doing?

On the top there’s:

#[event_macros::event_processor]
impl EventHandler {
  // ...
}

That’s an actual entry point in the macro, it gathers all the information needed and from that it outputs:

  • Full pub enum Event { ... } definition
  • run(&self, event: Event, event_queue: &mut VecDeque<Event>) implementation (listen, add to queue, handle from queue)
  • impl Debug for Event (for debugging purpose it’s helpful to know the name of current event)
  • transformed fn process_ ... functions

Visualized, this is how transformation happen:

Why proc-macro at all

If I’d try hard enough I could (probably) achieve similar result with macro_rules! macro. And I tried!

There is however one thing that I really hate when working with such macros: rust-analyzer and rust-fmt giving up on everything. I don’t get inspection, I don’t get completion, I don’t get formatting. For simple macros that’s fine – I can live with a couple non-completed arguments. Yet, with event-driven architecture, the core logic actually lives in handlers, so I didn’t want to be deprived of these helpers.

When switching to proc-macros an interesting part is that processor functions are perfectly valid ones! rust-analyzer sees input and output types. I also do some magic (that I don’t like but hey…): when EventEnvelope or VecDeque<EventEnvelope> is in function inputs I forward the variable name to body processing, i.e.

#[handler(WithEnvelope)]
fn process_with_envelope(&self, my_envelope: EventEnvelope) { ... }

becomes:

fn process_with_envelope(&self, env: EventEnvelope, event_queue: &mut VecDeque<EventEnvelope>) {
  let my_envelope = env;
  // ... rest of the code
}

Production code

You can see implementation of (macroized) code at one of my open source projects.

There are however, some notable differences.

  • As I mentioned before: I’m using EventEnvelope and tracing for telemetry, so the actual code is slightly more complex:
  fn process_my_event(
    &self,
    env: EventEnvelope,
    queue: &mut ::std::collections::VecDeque<EventEnvelope>,
  ) {
    let Event::MyEvent { item, value } = env.event else {
        unreachable!();
    };
    {
        println!("Hello from MyEvent");
    }
  }
  • handle and run functions are asynchronous (because my spawned processor is asynchronous one)

…implementation?

It’s here. I won’t go into implementation itself, but I need to say that TODAY it’s easier than it was some time ago.

LLMs are quite capable in generating proc-macro code given simple instructions, and once I grasped the main concept it was actually quite easy (especially using proc-macro, proc-macro2 and syn crates). In case you wonder, the most important pieces are:

  • proc-macro is the only crate that can produce proc-macros and it must produce proc_macro::TokenStream as output

  • proc-macro2 provides many utilities, but outputs proc_macro2::TokenStream – incompatible, but easily convertible to and from proc_macro::TokenStream

  • syn is creating structs of actual code – things like FnItem or Variant for enums, you can construct them by hand

  • syn is using proc-macro2 for utilities

  • code pieces can be generated using quote! (or quote_spanned! if you want to hint user of what is actual source of errors)

  • parse_quote! can be used to fill in syn structs, e.g.

  method.sig = parse_quote! { fn some_func(a: u32, b: u32) -> u32 };

Once I internalized, used some help from LLMs implementation was quite smooth.

At the end of the day

…I’m really happy with the result. Adding new Events was a chore, usually required at least for places to put the code in:

  • call site
  • Event enum
  • handle function
  • boilerplate heavy processor_ function

After the change it became only 2, much simplified and deprived of boiler plate.

I considered packing this into a crate (because I KNOW this pattern is good and reusable) but I have some doubts about it.

I don’t know if there’s any audience: would I use such crate? No idea. Maybe they exist. It’s also opinionated – using tracing and serde for serialization. Also it raw crates Event and EventEnvelope in the current namespace, which might be conflicting. Then I require async processing run to dispatch events to handle.

So maybe someday, but if anyone stumbles upon it, the proc-macro implementation is only 300 lines of code (excluding tests) and is pretty straightforward to modify. Maybe it’s enough?

The Architecture Behind an AI Video Processing Pipeline

Building a video processing service that handles everything from YouTube download to AI-scored, captioned, face-tracked vertical clips involves a lot of moving parts. This post is a straight-up architecture breakdown — the components, how they talk to each other, and the design decisions that actually matter at scale.

This is the architecture running ClipSpeedAI.

System Overview

At the highest level, the pipeline is:

User submits YouTube URL
    → Download job queued
    → Video downloaded (yt-dlp)
    → Audio extracted (FFmpeg)
    → Transcription (Whisper API)
    → Clip scoring (GPT-4o)
    → Face detection (MediaPipe, Python child process)
    → Clip extraction + crop (FFmpeg)
    → Caption generation + burn (Whisper segments → FFmpeg drawtext)
    → Output clips uploaded to storage
    → User notified via WebSocket

Each stage is a discrete job in a Bull queue. Stages are not chained synchronously — they produce events that trigger the next stage. This means any stage can fail and retry independently.

Component Map

┌─────────────────────────────────────┐
│           Node.js API               │
│  Express + Bull Queue + WebSocket   │
└──────────┬──────────────────────────┘
           │
    ┌──────▼──────┐       ┌──────────────────┐
    │  Bull Queue  │       │  Redis (BullMQ)   │
    │  Workers x4  │◄─────►│  Job state store  │
    └──────┬───────┘       └──────────────────┘
           │
    ┌──────▼──────────────────────────────────┐
    │           Worker Processes               │
    │  download | transcribe | score | encode  │
    └──────┬─────────────────────────────────┘
           │
    ┌──────▼──────┐       ┌──────────────────────┐
    │  Python IPC  │       │  External APIs        │
    │  (face det.) │       │  OpenAI, Whisper      │
    └─────────────┘       └──────────────────────┘
           │
    ┌──────▼──────────────────────┐
    │   Object Storage (S3/R2)    │
    │   Input videos + Output     │
    └─────────────────────────────┘

The Queue Structure

Four separate Bull queues, not one monolithic queue:

// queues.js
import { Queue } from 'bullmq';
import { redisConnection } from './redis.js';

export const downloadQueue = new Queue('video-download', { connection: redisConnection });
export const transcribeQueue = new Queue('video-transcribe', { connection: redisConnection });
export const scoreQueue = new Queue('clip-score', { connection: redisConnection });
export const encodeQueue = new Queue('clip-encode', { connection: redisConnection });

Why separate queues? Different concurrency limits. Download jobs are I/O-bound and can run 8 concurrent. Encode jobs are CPU-bound — max 2 concurrent on a 4-core server, or you thrash. Transcription jobs are API-rate-limited and run at 4 concurrent.

// workers.js
import { Worker } from 'bullmq';

const downloadWorker = new Worker('video-download', downloadProcessor, {
  connection: redisConnection,
  concurrency: 8
});

const encodeWorker = new Worker('clip-encode', encodeProcessor, {
  connection: redisConnection,
  concurrency: 2  // CPU-bound, keep low
});

Job State and Progress

Job state lives in Redis via Bull. Each job carries its full context as the job data:

await encodeQueue.add('encode-clip', {
  jobId: uuid,
  userId: user.id,
  videoPath: '/tmp/videos/abc123.mp4',
  segments: [
    { start: 45.2, end: 89.7, cropX: 710, score: 8.4 }
  ],
  options: {
    addCaptions: true,
    outputFormat: 'vertical_1080'
  }
}, {
  attempts: 3,
  backoff: { type: 'exponential', delay: 5000 },
  removeOnComplete: { count: 100 },
  removeOnFail: { count: 50 }
});

Progress updates flow through Bull’s progress API back to WebSocket listeners:

// Inside a worker processor
async function encodeProcessor(job) {
  await job.updateProgress(10);  // downloaded
  // ... encode ...
  await job.updateProgress(70);  // encoded
  // ... upload ...
  await job.updateProgress(100); // done
}

Python IPC Pattern

The face detection step runs as a Python child process. The IPC contract is simple: Node passes file paths as CLI arguments, Python writes JSON to a temp file, Node reads it back.

// python_runner.js
import { execa } from 'execa';
import { randomUUID } from 'crypto';
import fs from 'fs/promises';
import path from 'path';

export async function runPythonDetector(videoPath) {
  const outputPath = path.join('/tmp', `detections_${randomUUID()}.json`);

  await execa('python3', ['./python/face_detector.py',
    '--input', videoPath,
    '--output', outputPath
  ], { timeout: 90_000 });

  const data = JSON.parse(await fs.readFile(outputPath, 'utf8'));
  await fs.unlink(outputPath);
  return data;
}

File-based IPC is less elegant than stdout/stdin, but it’s more reliable for large payloads (thousands of frame detection results) and easier to debug — you can cat the output file if something goes wrong.

Storage Architecture

All intermediate files use /tmp on the server. Final output clips go to Cloudflare R2 (S3-compatible). The pattern:

// storage.js
import { S3Client, PutObjectCommand } from '@aws-sdk/client-s3';
import fs from 'fs';

const r2 = new S3Client({
  region: 'auto',
  endpoint: process.env.R2_ENDPOINT,
  credentials: {
    accessKeyId: process.env.R2_ACCESS_KEY,
    secretAccessKey: process.env.R2_SECRET_KEY
  }
});

export async function uploadClip(localPath, key) {
  await r2.send(new PutObjectCommand({
    Bucket: process.env.R2_BUCKET,
    Key: key,
    Body: fs.createReadStream(localPath),
    ContentType: 'video/mp4'
  }));

  return `${process.env.R2_PUBLIC_URL}/${key}`;
}

Temp files are cleaned up by a cron job every 30 minutes rather than inline after each job. This prevents race conditions when jobs retry.

Error Handling Philosophy

The pipeline is designed around “degrade gracefully, never fail silently”:

  1. Face detection fails → fall back to center crop
  2. GPT-4o scoring fails → fall back to heuristic scoring (longest speech segments)
  3. Caption generation fails → output clip without captions
  4. Upload fails → retry 3 times with exponential backoff, then alert

No stage should cause the entire job to fail unless it’s the core encode step itself.

Observability

Every worker emits structured logs:

logger.info('encode_complete', {
  jobId: job.id,
  userId: job.data.userId,
  duration_ms: Date.now() - startTime,
  clip_count: outputClips.length,
  total_size_bytes: totalSize
});

These feed into a Datadog dashboard. The three metrics that matter most: job queue depth, p95 encode time, and failure rate by stage.

ClipSpeedAI has processed hundreds of videos on this architecture. The key insight is that each stage should be independently retryable and independently scalable. That’s what makes it robust without being complicated.

For the WebSocket notification layer and how clients receive real-time progress updates, see the dedicated article on WebSocket integration in this series. The complete pipeline described here is available as a hosted tool at ClipSpeedAI for teams who want the output without building the infrastructure.

I Built Modulens to Make Hidden Angular Architecture Problems Easier to See

We can build software faster than ever now.

With AI-assisted development, scaffolding features, generating components, writing utilities, and even shaping entire flows can happen in a fraction of the time it used to take. That speed is exciting. It lowers the barrier to turning ideas into working products. It helps solo developers move faster. It helps teams prototype more aggressively. It helps side projects become real products. But it also introduces a new kind of risk: we can create code much faster than we can truly understand, review, and sustain over time.

In many projects, especially frontend projects, architectural problems do not appear all at once. They accumulate quietly. A component grows beyond its original responsibility. A shared UI element ends up living in the wrong place. A folder structure starts to drift. Warning signals become scattered. Complexity spreads across the workspace in ways that are easy to miss when all attention is focused on shipping the next feature.

That is the problem space that led me to build Modulens.

The source code and npm package links are available below.

Why I started this project

I kept coming back to the same thought: we already have tools that help us write code faster, but we do not always have equally strong tools to help us see the structural health of a project as it evolves.

When a codebase is still small, many things feel manageable. You can open a few files, navigate by memory, and reason about the whole system in your head. But once a project grows, that changes. The cost of understanding structure increases. Large components become normal. Risky patterns hide inside otherwise “working” code. The project may still compile, the UI may still render, and features may still ship, but maintainability starts to slip.

That is where I felt there was room for a tool focused on visibility.

Modulens is a brand of architecture, structure, and quality analysis tools for frontend workspaces. Right now, the Angular package is the first available implementation, while the broader repository is designed to support more frameworks over time.

What Modulens is

Modulens for Angular is a CLI tool that analyzes Angular workspaces and generates architecture, structure, and quality reports. Its goal is not to replace code review, static analysis, or team judgment. Its goal is to make certain signals more visible: large components, architectural risks, warning hotspots, and areas that may need refactoring.

That distinction matters to me.

I did not want to build a tool that simply says “this is wrong.” I wanted to build something that helps answer questions like:

  • Where is complexity accumulating?
  • Which parts of this workspace deserve attention first?
  • Which components may be carrying too much responsibility?
  • Where might maintainability start becoming expensive?
  • What deserves investigation before it turns into a larger problem?

In other words, Modulens is meant to support architectural awareness.

Why Angular was the first step

I started with Angular because Angular projects often have a strong sense of structure, and that makes structural drift especially interesting. When the architecture is healthy, Angular workspaces can feel very clear and scalable. But when boundaries start to blur, the project can gradually become harder to reason about.

You might still have a working application, but the internal shape of the codebase may be telling a different story.

That makes Angular a good place to start for a tool like this. There is a lot of value in surfacing structural signals early, before teams normalize complexity just because the project continues to function.

The long-term idea is broader than Angular. The Modulens repository itself is intended as a multi-framework foundation, with Angular available today and future packages for other ecosystems being part of the vision.

How Modulens works today

The current Angular package is intentionally simple to start using.

You can install it globally and run modulens scan, or use it as a one-off command with npx @modulens/angular scan. It can scan the current working directory or a specific Angular workspace path.

npm install -g @modulens/angular
modulens scan

or:

npx @modulens/angular scan

his simplicity was important to me. I wanted the first run experience to be straightforward: point the tool at a workspace and get something useful back quickly.

By default, Modulens writes an HTML report under .modulens/reports/, opens it in the browser after a successful run, and also saves a JSON snapshot under .modulens/snapshots/ from the same analysis run. That means even when HTML is the main experience, the structured machine-readable result is still preserved.

The output philosophy: human-readable first, automation-ready too

One of the design decisions I care about most is the combination of HTML output for people and JSON output for systems.

The default HTML report is there because architecture and maintainability are often easier to understand visually. You want to scan patterns. You want summaries. You want to identify where to look first. You want something that feels explorable, not just a raw dump of data.

At the same time, structured JSON matters because modern workflows are increasingly automated. Teams may want to archive results, inspect them in scripts, use them in CI, or compare outputs over time. Modulens supports JSON output through –format json, lets you control output paths with -o / –output, supports –no-open for HTML generation without opening a browser, and even allows JSON to be written to stdout with –output -. HTML, intentionally, is not supported on stdout.

That split reflects how I think developer tools should behave: they should be useful both in a local developer workflow and in a more automated environment.

What the report is trying to reveal

The real value of a tool like this is not the scan itself. It is the questions the scan helps you ask.

A healthy project is not necessarily a project with zero warnings. A healthy project is one where important signals are visible, understandable, and actionable.

That is why Modulens is focused on surfacing things like:

  • large components
  • architectural risk signals
  • warning hotspots
  • areas that may need refactoring
  • overall structure and quality patterns across the workspace

On the HTML side, the report includes an Overview section with an executive summary and Priority focus, specifically to make the first reading experience more useful. Instead of throwing the user directly into raw details, the idea is to first answer: What is the scale of what I’m looking at? What looks important? Where should I start?

That framing matters because analysis tools can easily become noisy if they do not guide attention.

Building for real workflows, not just demos

A lot of tools look good in isolated examples but feel harder to trust in day-to-day development. I wanted Modulens to move in the opposite direction.

That means caring about practical details:

  • sensible default output behavior
  • support for explicit file output paths
  • support for JSON pipelines
  • browser opening behavior that can be disabled
  • a saved workspace snapshot from each successful run
  • a public JSON shape with a top-level schemaVersion for compatibility awareness

The schemaVersion detail is especially important. If people want to build automation or downstream tooling on top of Modulens output, they need a stable contract mindset. The README explicitly distinguishes schemaVersion from toolVersion, which helps clarify how consumers should think about parsing compatibility versus tool release history.

That may sound like a small implementation detail, but for tooling, small details often shape trust.

The bigger motivation behind Modulens

I think developer tooling is entering a new phase.

For a long time, many tools focused primarily on syntax correctness, lint rules, formatting, and build pipelines. Those are still important. But the way we write software is changing. AI can help generate more code, more quickly, and with that comes a new pressure point: structural oversight.

The challenge is no longer only “can we produce code?”
It is increasingly “can we understand the system we are producing?”

That is the motivation behind Modulens.

I am interested in tools that help developers reason about software at a higher level:

  • structure
  • boundaries
  • responsibility distribution
  • maintainability trends
  • architectural signals that are easy to miss when velocity is high

I do not think the answer is more noise. I think the answer is better visibility.

Why this is still an early project
Modulens is still early, and I think that is worth saying clearly.

I would rather publish a useful tool early, let real developers try it, and improve it through actual feedback than wait for some imaginary “perfect” version. Early tools have rough edges. They also have an advantage: they can evolve in direct conversation with the people who might use them.

That is how I want this project to grow.

The current release is focused on Angular workspaces, but the broader idea is intentionally larger. The repository is already framed as a foundation for a family of frontend workspace analysis tools, with Angular available first and React, Vue, and Flutter part of the broader direction I want to explore over time.

Who I think Modulens is for

I think Modulens can be useful for several kinds of developers:

Solo developers who are shipping quickly and want another layer of visibility before complexity gets away from them.

Frontend teams who want a faster way to inspect structural risk and identify where architectural attention is needed.

Tech leads and reviewers who want a higher-level view of maintainability signals across a workspace.

Developers experimenting with AI-assisted workflows who want speed without losing visibility into what the codebase is becoming.

If any of that sounds familiar, then Modulens is built with that kind of workflow in mind.

Try it

I recently released Modulens 0.2.0, and this is still just the beginning.

If you work with Angular and the problem of hidden architectural drift sounds familiar, I’d love for you to try it, inspect the output, and tell me what feels useful, what feels noisy, and what you would want a tool like this to detect next.

npx @modulens/angular scan

The package is available on npm, and the project is open on GitHub. The Angular package is currently the active entry point, and the repository positions Modulens as a growing set of frontend architecture, structure, and quality analysis tools.

If the future of software development is faster, then I think the future of tooling should also help us stay clearer about what we are building.

That is the idea behind Modulens.

GitHub: https://github.com/sinanyilmaz0/Modulens
Npm: https://www.npmjs.com/package/@modulens/angular

I Built pytest for AI Agents — Here’s What I Learned

 Every AI agent developer knows this pain:

You run your agent. It works. You run it again. It doesn’t. You have no idea why. You check the logs — there are no logs. You check the cost — $4.20 for a single run. You cry.

I got tired of this, so I built AgentProbe — an open-source testing framework for AI agents. Think pytest, but for LLM-powered agents.

What it does

Record — Capture every LLM call, tool call, and decision your agent makes.

Test — Run 35+ built-in assertions: cost limits, quality checks, safety validation, PII detection.

Replay — Swap models and compare results. “What happens if I switch from GPT-4o to Claude?”

Fuzz — 55 prompt injection attacks built-in. Find vulnerabilities before your users do.

The features nobody asked for (but everyone loves)

Agent Roast — Run agentprobe roast and get a brutally honest (and funny) analysis of your agent:

“Your agent spends money like a drunk sailor at a token store. Cost grade: D”

X-Ray Mode — Visualize exactly how your agent thinks, step by step, with costs per step.

Cost Calculator — Find out what your agent REALLY costs per month. Spoiler: more than you think.

Health Check — Get a 0-100 health score across 5 dimensions: reliability, speed, cost, security, quality.

Injection Playground — 55 built-in prompt injection attacks across 5 categories. Test your agent’s defenses.

Quick start

Install:

pip install agentprobe

Record your agent:

agentprobe record my_agent.py

Run tests:

agentprobe test

Get roasted:

agentprobe roast my_agent.py –level savage

What I learned building this

  1. AI agents are black boxes by default. Nobody builds logging into their agents. When something breaks, you’re guessing.

  2. Cost is the silent killer. Most developers have no idea what their agents cost per run. I’ve seen agents that cost $5 per query because of redundant LLM calls.

  3. Security is an afterthought. Most agents are vulnerable to basic prompt injection. A simple “ignore previous instructions” breaks 60% of agents I’ve tested.

  4. Testing AI is different from testing code. You can’t just assert output == expected. You need statistical assertions — “quality above 80% over 100 runs.”

What’s next

  • VS Code extension
  • Web3/crypto agent testing
  • More framework integrations

The repo is open source (MIT): github.com/tomerhakak/agentprobe

Would love feedback from anyone building agents. What’s the hardest part of testing for you?