CodePen TV secrets

Those seven deadly things you always wanted to know about creating a CRT TV in CSS.

A behind the scenes candid deep dive.

(1) My first vanilla CSS Art project!
Can you actually believe it? Yes. But anyway, I got so into SASS that it wasn’t until… Well I explained it all in my last post but yeah, I guess this is my first actual pure CSS art! I did really want to add white noise and channel clicks, but that would have involved JavaScript, so you shall have to imagine that yourselves. It’s also my first use of corner-shape: squircle. Firefox doesn’t support me on this yet, but oh well! I think squircle is necessary usage for a CRT!

(2) Lighting the CodePen logo.
The spinny cube thing has actual three dimensional light coming from the left, which took blumming ages to do, and it’s barely even noticeable. So I would just like to point that out here 😅

(3) The volume control distorts the scanlines.
I thought this would kind of represent the increase in volume interfering with the tuning, as it would if you didn’t have ground loop isolation.

(4) Rotating knobs.
Getting the knobs look like they rotate when the shine stays top right. It was a tricky one. But the dashed border works hard here.

(5) The glass reflections could not be square!
To replicate the distortion of a cathode ray tube’s shape. The window reflection is made entirely of repeated right dashed borders. These look very different depending on the browser engine. Blink’s dash size is almost perfect for the real window panes. But it’s a strange way to draw windows.

 &, &:before, &:after {
     width: 31rem;
     height: 100rem;
     border: solid 7rem transparent;
     border-right: dashed 7rem hsla( var(--wht-hsl),.05);
     background: transparent;
     border-radius: 50%;
 }

(6) It’s responsive!
The TV changes layout depending on your screen size. I used rems and aspect ratios hard!

(7) The CodePen 2.0 logo.
The rotating 2.0 makes no sense in reality. It does transform:scaleX(-1) exactly at 90 degrees so that 2.0 reads left to right on both the front and back.

Your AI Agent Forgets Everything Between Sessions. I Fixed That.

Every time you start a new session with Claude Code, Cursor, or any AI coding agent, it starts from scratch. It does not remember:

  • Who you are or what you prefer
  • What decisions were made yesterday
  • What corrections you already gave it
  • Where external resources live

I built memorybank to fix this.

What is memorybank?

An MCP server that gives any AI agent persistent, cross-session memory. Zero dependencies, file-based, works with Claude Code, Cursor, Windsurf, and any MCP-compatible tool.

npx @ura-dev/memorybank --help

8 MCP Tools

Tool What it does
memory_store Save a memory (user, project, feedback, reference, custom)
memory_recall Retrieve most relevant memories for a query
memory_list List all memories, filter by type or tag
memory_get Get a specific memory by ID
memory_update Update an existing memory
memory_delete Delete a memory
memory_search Full-text search across all memories
memory_stats Counts, types, storage size

How it works

  1. Your agent encounters something worth remembering
  2. It calls memory_store with a type, name, and content
  3. memorybank saves it as a markdown file with YAML frontmatter
  4. Next session, the agent calls memory_recall to load relevant context
  5. The agent now knows what happened before

Memories are stored locally in ~/.memorybank/, organized by namespace (one per project). No cloud, no database, no API keys.

Setup in 30 seconds

Add to your Claude Code config (~/.claude/settings.json):

{
  "mcpServers": {
    "memorybank": {
      "command": "npx",
      "args": ["-y", "@ura-dev/memorybank", "memorybank-mcp"]
    }
  }
}

Or Cursor (.cursor/mcp.json):

{
  "mcpServers": {
    "memorybank": {
      "command": "npx",
      "args": ["-y", "@ura-dev/memorybank", "memorybank-mcp"]
    }
  }
}

That is it. Your agent now has persistent memory.

Five memory types

  • user — About you: role, preferences, expertise level
  • project — About the work: goals, architecture decisions, deadlines
  • feedback — Corrections you gave: what to avoid, what worked
  • reference — External pointers: URLs, docs locations, API endpoints
  • custom — Anything else

Why not just use CLAUDE.md?

CLAUDE.md is great for static project instructions. memorybank is for dynamic knowledge that evolves during work:

  • User corrections that should persist
  • Architecture decisions made mid-project
  • References discovered during research
  • Project status that changes daily

memorybank complements CLAUDE.md. One for rules, the other for learned knowledge.

CLI too

memorybank store user team-lead "User is the team lead for backend services"
memorybank search "TypeScript preferences"
memorybank list --type=feedback
memorybank store project api-rewrite "Migrating REST to GraphQL" --namespace=myproject

Also: agentrace

If you want to see what your AI agent is doing (not just what it remembers), check out agentrace. Structured observability for AI agents. Same philosophy: MCP server, zero deps, file-based.

Links:

Built with zero dependencies. MIT licensed. Works today.

I Built a Piano Trainer That Measures Stability, Not Just Speed

Most piano practice tools measure speed.

Some measure note accuracy.
Some turn practice into a game.
Some help beginners learn what key to press next.

But there is a problem hidden underneath all of that:

speed is not the same as control.

A pianist can play fast and still sound unstable.
A trill can be quick but uneven.
A repeated-note passage can look impressive on paper, while the actual timing is wobbling underneath.

And that wobble matters.

Especially in repeated notes, trills, and high-pressure fast passages, the real issue is often not whether you can move your fingers fast enough.

It is whether you can stay stable while moving fast.

That question led me to build Piano Virtuoso 18.

Piano Virtuoso 18 is a browser-based piano trainer focused on something that most tools do not treat as the main event:

timing stability.

Instead of rewarding raw speed alone, it evaluates whether the player can maintain control, consistency, and evenness during short high-speed bursts.

You can try it here:

The problem: fast is visible, instability is not

Traditional practice makes it easy to notice obvious mistakes.

You can hear missed notes.
You can hear when the rhythm collapses completely.
You can tell when you simply cannot keep up.

But many technical weaknesses live in a more subtle zone.

A player may think:

  • “I can do this trill.”
  • “I can repeat this note fast enough.”
  • “My right hand is getting faster.”

But when you actually examine the timing at a finer level, a different picture can appear:

  • one note is consistently late
  • alternation becomes uneven under pressure
  • bursts accelerate and then decay
  • intervals drift away from the intended spacing
  • speed rises, but control falls apart

This is the zone I wanted to expose.

Because in real playing, especially in advanced piano technique, fast and unstable is not mastery.

Fast and stable is technique.

Why repeated notes and trills matter so much

Repeated notes and trills are not just “small exercises.”

They reveal the truth about control.

If your motion is unstable, these patterns expose it immediately.
If your timing is uneven, they punish it immediately.
If your hands can generate speed but cannot regulate it, they make that weakness obvious.

That makes them perfect for measurement.

So instead of building a general piano-learning platform, I focused on a narrower and sharper question:

Can timing stability be measured directly during short, fast piano actions?

That became the design center of Piano Virtuoso 18.

The idea behind Piano Virtuoso 18

Piano Virtuoso 18 is not designed as a generic tapping game.

It is not mainly about “how many presses can you do.”
It is not mainly about “did you hit the correct note.”
And it is not trying to behave like a full AI piano teacher.

Its core idea is much more specific:

measure the quality of high-speed timing behavior, not just the quantity of taps.

That means the system cares about things like:

  • micro-timing deviation
  • interval consistency
  • stability score
  • burst-control behavior
  • alternation evenness

The goal is to convert invisible technique problems into visible data.

What the trainer actually does

Piano Virtuoso 18 runs in the browser and works with MIDI input.

Its current design centers on short, measurable performance windows — especially 10-second sprints — because they create a clean situation for observing speed under pressure.

The current core modes are:

Erlkönig Mode

A repeated-note stability challenge centered on C4.

This mode is built for the kind of rapid single-note repetition that appears in advanced piano technique, especially where the issue is not merely speed, but maintaining uniform control.

Trill Mode

An alternation stability challenge using C4 ↔ D4.

This mode evaluates how evenly the player alternates between two notes, and how stable the timing remains during the burst.

These are simple exercises on the surface.

But that simplicity is exactly what makes them useful as a technical lens.

When the task is stripped down, instability has nowhere to hide.

The central metric: stability over time

The most important idea in the project is this:

raw speed is not enough as a score.

A player who produces more taps is not necessarily demonstrating better technique.
They may simply be generating more chaotic motion.

So Piano Virtuoso 18 treats stability as a first-class signal.

That means the score is influenced not only by how fast the notes arrive, but by how evenly they are spaced and how well the performer sustains timing quality across the entire attempt.

This is the real difference between a speed toy and a technique analyzer.

Visualizing the problem

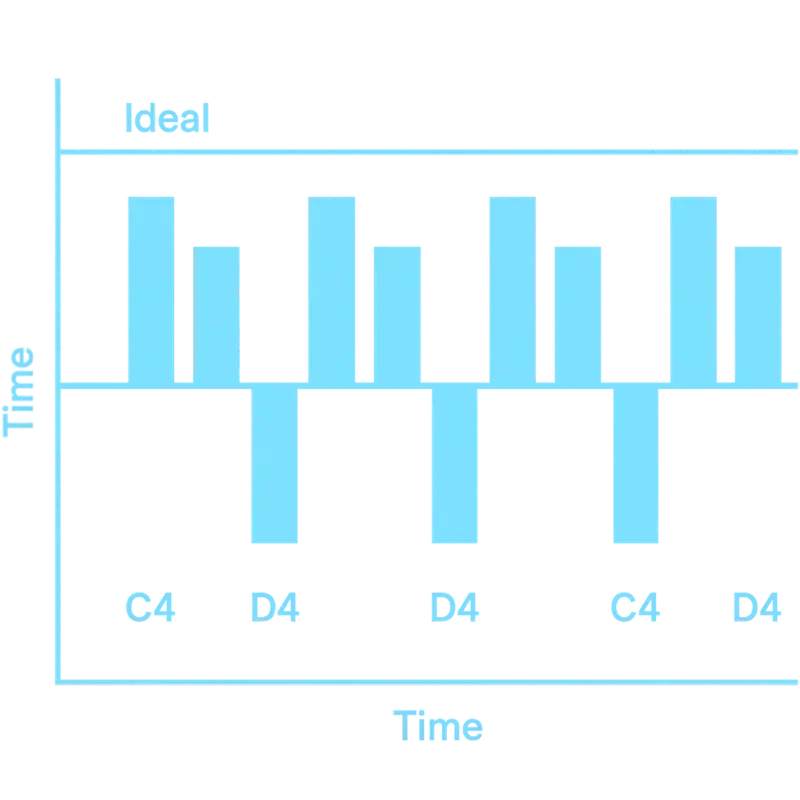
Here is the kind of timing structure the system is built around.

This image represents an idealized view of alternation over time.

The horizontal axis is time.
The vertical structure separates note events in a repeating pattern.
In trill-style alternation, the important question is not only whether the player hits both notes, but whether those events remain evenly spaced and structurally consistent over the full burst.

That is where the interesting information lives.

Not in “did the note happen?”
But in:

  • when it happened
  • how evenly it happened
  • how much the spacing drifted
  • whether the player stayed under control

Once you look at performance this way, many familiar practice tools start to feel incomplete.

Why I built it in the browser

I wanted the system to be immediate, lightweight, and accessible.

That is why Piano Virtuoso 18 runs directly in the browser rather than requiring a heavy native installation.

For this kind of prototype and training system, the browser offers several advantages:

  • instant access
  • simple distribution
  • easy iteration
  • direct MIDI integration
  • no-friction testing across devices

That makes it easier to experiment with measurement ideas quickly.

And more importantly, it keeps the focus on the analysis itself, instead of burying the project under installation friction.

Why this is not just another rhythm game

At a glance, some people might think:
“Isn’t this just a tapping challenge for pianists?”

No.

That interpretation misses the point.

A tapping game usually rewards output volume:
more presses, more points, end of story.

Piano Virtuoso 18 is built around a different assumption:

bad speed should not be rewarded the same way as controlled speed.

That changes the meaning of the entire system.

If a player produces a lot of presses but their interval spacing is collapsing, that is not the same as true control.
If a trill becomes rhythmically unbalanced, that is not a clean success.
If the player’s burst profile shows instability, the score should reflect that.

So the trainer is not merely counting events.

It is judging whether the events remain structurally stable enough to represent real technique.

That is why I describe it less as a game and more as a stability-focused performance analyzer.

What makes this useful for real pianists

Most musicians already know the feeling of “I thought I played that better than I actually did.”

That gap between perception and measurable execution is where useful training tools can matter.

Piano Virtuoso 18 helps by exposing things that are usually buried inside vague intuition:

  • whether your repeated notes are actually even
  • whether your trill alternation is structurally balanced
  • whether your speed is sustainable or collapsing
  • whether your timing control survives pressure

This matters because once a weakness becomes measurable, practice changes.

You stop relying only on mood, self-estimation, or wishful thinking.
You can train against an observed problem instead of a vague feeling.

That is where real feedback begins.

Why I think “stability” deserves more attention

In many practice environments, speed gets the spotlight because it is easy to understand and easy to market.

It is simple to ask:
“How fast are you?”

It is much more interesting to ask:
“How stable are you at speed?”

That second question gets closer to what technique actually is.

Not motion alone.
Not effort alone.
Not excitement alone.

But regulated motion under pressure.

That is the territory Piano Virtuoso 18 is trying to formalize.

The broader idea behind the project

The deeper idea here is larger than one piano trainer.

I think there is room for a whole class of music tools that do not just teach content, but measure structural quality.

Not just:

  • what note was played
  • whether the answer was correct
  • whether the user finished the task

But:

  • whether timing stayed stable
  • whether motion stayed consistent
  • whether performance quality degraded under load
  • whether control survived intensity

That kind of measurement is interesting not only for piano, but for musical technique more broadly.

Piano Virtuoso 18 is one concrete attempt to move in that direction.

Current project links

If you want to look at the project directly:

Final thought

Most people can understand speed.

But in serious playing, speed is the easy part to admire and the dangerous part to overestimate.

The harder question is whether the performance stays stable when speed arrives.

That is the question that led me to build Piano Virtuoso 18.

Not a trainer that simply asks:

“How fast can you go?”

But a trainer that asks:

“How stable are you when you get there?”

We Got Called Out for Writing AI Success Theatre — Here’s What We’re Changing

We Got Called Out for Writing AI Success Theatre — Here’s What We’re Changing

A developer read our Sprint 7 retrospective and compared it to “CIA intelligence histories — designed to make the Agency seem competent and indispensable, even when it isn’t.”

That stung. And then I realized: he’s right.

The Problem He Identified

Nick Pelling is a senior embedded engineer who’s been watching our AI-managed development project. We’ve published retrospective blog posts after every sprint — nine so far. His feedback was blunt:

“The blog’s success theatre has an audience of one.”

“Logging activities is a stakeholder-facing thing, but not very interesting to non-stakeholders.”

“Maybe you need a second blog that other people might be more interested to read.”

He’s pointing at a real failure: we optimized our blogs for internal accountability and accidentally published them as if they were developer content. They aren’t. They’re audit logs wearing a blog post’s clothes.

What Success Theatre Looks Like

Here’s a line from our Sprint 7 retrospective:

“Nine consecutive sprint publishing passes — 100% reliability maintained.”

That’s true. It’s also the kind of thing you put in a status report to your boss. A developer on Dev.to reading that thinks: “Cool. Why should I care?”

Or this: “OAS-124-T2: Pipeline Execution & Artifact Validation — 7 tests pass.”

That’s a ticket ID. Nobody outside our project knows what OAS-124 means. We were writing for ourselves and pretending we were writing for you.

The pattern across nine posts is consistent:

  • Lead with metrics that make us look good
  • Bury failures in a “What Went Wrong” section that’s shorter than the “What We Built” section
  • End with a provenance table that nobody asked for
  • Scatter ticket IDs everywhere like they’re meaningful

What Actually Happened in Sprint 7 (Honest Version)

We’re building an automated marketing platform — an AI-managed “agency” that handles content sourcing, script generation, audio narration, video production, and publishing. Sprint 7 was supposed to prove all the pieces work together.

Here’s what actually happened:

We put 118 services in one file and it’s a problem

Over six sprints, we built 118 backend services — API endpoints for everything from text-to-speech to YouTube uploads. Each one was individually tested and worked fine.

Then we wired them all into a single Express server file (api-server.mjs). All 118 routes, one file. No domain separation, no route modules.

This is the kind of decision that feels pragmatic at the time (“just add it to the server file”) and becomes technical debt the moment someone else has to read it. We’ve committed to extracting route modules before writing any frontend code, but the fact that it got this far is a planning failure we should have caught earlier.

Our tests prove wiring exists, not that anything works

Sprint 7’s big achievement was “118 services wired to production REST routes.” Sounds impressive. But here’s what the tests actually do:

// What our tests do (source inspection)
const src = fs.readFileSync('server.mjs', 'utf-8');
expect(src).toContain('app.post("/api/memory/store"');
// Passes — the route registration exists in the source code

// What our tests DON'T do (runtime validation)
const res = await fetch('http://localhost:3847/api/memory/store', {
  method: 'POST', body: JSON.stringify({ content: 'test' })
});
expect(res.status).toBe(200);
// We never wrote this test

We verified that route registrations exist in the source code. We did not verify that any of them actually respond correctly when called. Source inspection proves the wiring is there. It says nothing about whether the wiring works.

This is the difference between checking that a plug is in the socket and checking that electricity flows through it.

Advisory warnings don’t change behavior

We have a rule (ADR-032) that says AI personas should store what they learn after completing each task. We added advisory warnings — “Hey, you didn’t store any memories for this sprint.”

Three sprints in a row (Sprint 0, Sprint 4, Sprint 7), zero persona memories were stored. The warnings fired. They were ignored. Every time.

This taught us something genuinely useful about AI agent systems: advisory-only governance does not work for AI agents. If you want an AI agent to do something consistently, you need to make it mechanically impossible to skip. Warnings are suggestions. Gates are requirements.

We’re escalating from “warn at completion” to “blocking completion until the requirement is met.” If the pattern holds, this will be the fix. If it doesn’t, we’ll have to rethink the entire memory architecture.

The E2E pipeline test was the real win — and the real lesson

We built a pipeline executor that chains six stages: Source → Script → Audio → Assembly → Quality Gate → RSS. Each stage takes the previous stage’s output as input. If any stage fails, subsequent stages are skipped (not failed — skipped).

class PipelineExecutor {
  private stages: Array<{ name: string; fn: StageFn }> = [];

  run(): Result<PipelineResult> {
    let currentInput = null;
    let failed = false;

    for (const stage of this.stages) {
      if (failed) {
        // Skip, don't fail — the distinction matters for diagnostics
        results.push({ ...stage, status: 'skip' });
        continue;
      }
      try {
        const output = stage.fn(currentInput);
        if (output === null) { failed = true; }
        currentInput = output;
      } catch (e) {
        failed = true;
      }
    }
  }
}

The distinction between “failed” and “skipped” matters more than you’d expect. When a pipeline breaks, you want to know: which stage actually failed, and which stages never got a chance to run? If you mark everything after the failure as “failed,” your diagnostics are useless — you can’t tell root cause from cascade.

This is a pattern worth stealing for any multi-stage pipeline: fail the broken stage, skip the rest, and make the skip reason traceable.

We planned 58 points and delivered ~38

Our sprint planning estimated 58 story points. We delivered about 38. That’s a 34% miss.

The standard response is to spin this as “right-sizing” or “healthy scope management.” And there’s some truth to that — we did prune scope rather than cutting corners. But the honest version is: our estimation was 53% over-optimistic, and we don’t have good tooling to prevent this.

If you’re running AI agents on sprint work, be aware that estimation is harder, not easier, with AI. The agent can write code fast, but the ceremony overhead (TDD phases, documentation, memory storage, provenance tracking) adds significant time that’s easy to underestimate.

What We’re Changing

Starting with Sprint 8, our public blog posts will follow a different structure:

  1. Lead with what went wrong — not what we built. The failures are where the transferable lessons live.
  2. No ticket IDs — if you have to explain what OAS-124 means, it doesn’t belong in a public post.
  3. No provenance tables — these are compliance artifacts, not reader value.
  4. No “publishing streak” metrics — nobody cares how many consecutive blog posts we’ve published. They care if we have something worth reading.
  5. Code that solves problems — show the actual implementation with enough context for someone to reuse it. The pipeline executor pattern above is an example.
  6. Honest failure analysis — not “what went wrong” as a perfunctory section, but failure as the centerpiece of the post.

The internal retrospective (ticket-level accountability, sprint metrics, provenance) will stay in our internal tooling where it belongs.

Thank You, Nick

Nick Pelling’s feedback was the most useful thing anyone has said about this project in months. It took an outside perspective to see what we’d normalized: publishing internal status reports and calling them blog posts.

The previous retrospective posts will stay published — they’re an honest record of where we were, and now they serve as a “before” example of exactly the pattern Nick identified.

If you see us falling back into success theatre, call it out. That’s the most valuable contribution a reader can make.

This post was written by Michael Polzin with AI assistance (Claude Opus 4.6). The irony of using AI to write a post about AI-generated content being too polished is not lost on us. Nick would probably have something to say about that too.

Warp Terminal Has a Free AI That Makes Your Command Line Intelligent

Warp is a modern terminal with AI built in. Ask questions in natural language, get commands. Built-in command palette, blocks (grouped output), and team collaboration.

AI Features

# Type # to ask AI:
# how to find files larger than 100MB
# → Suggests: find . -type f -size +100M

# how to kill process on port 3000
# → Suggests: lsof -ti:3000 | xargs kill -9

# git undo last commit but keep changes
# → Suggests: git reset --soft HEAD~1

Blocks (Grouped Output)

Each command and its output is a “block.” You can:

  • Copy just the output (not the command)
  • Share a block as a link
  • Search within a block
  • Collapse/expand blocks

Workflows (Reusable Commands)

# Save commonly used command sequences
name: Deploy
steps:
  - git pull origin main
  - npm run build
  - npm run test
  - npm run deploy

Warp vs iTerm2 vs Alacritty

Feature Warp iTerm2 Alacritty
AI Built-in No No
Blocks Yes No No
Speed Fast (Rust) Medium Fastest
Collaboration Yes No No
Platform macOS, Linux macOS All

Free Tier

  • Individual: Free forever
  • Team: $15/user/month (sharing, admin)

The Bottom Line

Warp makes the terminal approachable for beginners (AI help) and powerful for pros (blocks, workflows, speed). If you’re on macOS or Linux, try it.

Need to automate data collection or build custom scrapers? Check out my Apify actors for ready-made tools, or email [email protected] for custom solutions.

The True Cost of a Failed Release (It’s Not Just the Rollback)

Cross-posted from the Unitix Flow Blog

A failed release doesn’t cost you 1 hour of rollback. It costs you trust.

I talked to a team of 8 engineers recently. They had a failed release every 3-4 sprints. Each one looked small: 30 minutes to roll back, a few hours to debug, re-test by the next day.

But when we added up the real costs, the picture changed completely.

The Real Numbers

Direct cost per failure: $4,000–$9,000

  • Rollback execution: 30-60 min × 2-3 engineers
  • Debugging the root cause: 2-4 hours × 1-2 senior devs
  • QA re-test of the entire release: 4-8 hours
  • Incident review meeting: 1 hour × full team
  • Communication overhead: Slack threads, status updates, customer comms

Feature delay: 3–5 business days per incident

The feature that was supposed to ship? It sits in limbo while the team deals with the fallout. Multiply this across 3-4 failures per year.

Deployment fear tax: incalculable

This is the sneaky one. After a bad release:

  • Friday deploys get banned
  • Thursday becomes “risky”
  • Deploy windows shrink to Tuesday mornings with full team on standby
  • VP approval required for routine deploys

The Death Spiral

Here’s the pattern that kills teams:

Fewer deploys → larger batches → more risk per deploy → more failures → even fewer deploys

Each failure adds a new sign-off step. After a year, shipping a one-line fix takes 3 days because it needs to go through the same 7-step approval process as a major feature.

The Root Causes

After analyzing dozens of post-mortems, the root causes are surprisingly consistent:

  1. Untested feature combinations — individual branches pass CI, the combination breaks in staging
  2. Missing environment config — works locally and in staging, fails in prod because of a missing env var
  3. Skipped QA — “we’ll test it in production” (narrator: they didn’t)
  4. Scope creep after QA sign-off — “just one more small change” after testing is complete
  5. No tested rollback plan — the rollback script exists but hasn’t been tested in 6 months

The Prevention Framework

The fix isn’t zero failures — it’s minimizing blast radius:

Staging branches for integration testing — merge features into a staging branch first. Find integration bugs before they reach production.

QA gates that block deploy without sign-off — binary pass/fail before the deploy button is even available. Not “someone should probably test this.”

Scope lock after testing — once QA starts, the release scope is frozen. New features go to the next release.

One-click rollback — if rollback requires SSH + manual migrations + config changes, it’s not a rollback plan. It’s a prayer.

Automated post-deploy verification — health checks, smoke tests, and metric monitoring that run automatically after every deploy.

The Math That Matters

If your team ships 20 releases per year and 3 fail:

  • Direct cost: $12,000–$27,000/year
  • Feature delay: 9-15 business days lost
  • Process overhead: ~1 approval step added per failure = 3 extra steps per year

After 2 years, you’ve added 6 unnecessary approval steps that slow down every release — including the ones that would have been fine.

The goal isn’t perfection. It’s a process where failures are small, detected early, and recovered quickly.

We built Unitix Flow to make this prevention framework the default — staging branches, QA gates, scope lock, and one-click operations built into the release process.

Bun Test Has a Free API That Runs Jest-Compatible Tests 10x Faster

Bun’s built-in test runner: zero config, Jest-compatible, 10x faster.

import { describe, it, expect, mock } from 'bun:test'

describe('math', () => {
  it('adds', () => expect(1 + 1).toBe(2))
})

const fn = mock(() => 42)
fn()
expect(fn).toHaveBeenCalled()
bun test  # that's it

Jest 8.5s vs Vitest 3.2s vs Bun 0.8s for 1000 tests.

Need to automate data collection or build custom scrapers? Check out my Apify actors for ready-made tools, or email [email protected] for custom solutions.

Grafana k6 Has a Free API That Load Tests Your APIs With JavaScript

k6 is a load testing tool that uses JavaScript for test scripts. Run locally, in CI/CD, or in the cloud. Write tests like you write code — not XML configs.

Quick Start

# Install
brew install k6           # macOS
sudo apt install k6       # Ubuntu

# Run a test
k6 run script.js

Basic Load Test

import http from 'k6/http'
import { check, sleep } from 'k6'

export const options = {
  vus: 50,             // 50 virtual users
  duration: '30s',     // for 30 seconds
}

export default function () {
  const res = http.get('https://api.example.com/posts')

  check(res, {
    'status is 200': (r) => r.status === 200,
    'response time < 500ms': (r) => r.timings.duration < 500,
  })

  sleep(1)
}

Ramping (Realistic Traffic Patterns)

export const options = {
  stages: [
    { duration: '2m', target: 100 },   // ramp up to 100 users
    { duration: '5m', target: 100 },   // stay at 100
    { duration: '2m', target: 200 },   // spike to 200
    { duration: '5m', target: 200 },   // stay at 200
    { duration: '2m', target: 0 },     // ramp down
  ],
}

Thresholds (Pass/Fail Criteria)

export const options = {
  thresholds: {
    http_req_duration: ['p(95)<500'],      // 95% of requests < 500ms
    http_req_failed: ['rate<0.01'],        // <1% error rate
    'http_req_duration{status:200}': ['p(99)<1000'],
  },
}

Use in CI/CD: k6 exits with non-zero if thresholds fail.

API Testing

import http from 'k6/http'
import { check } from 'k6'

export default function () {
  // POST with JSON
  const payload = JSON.stringify({ name: 'test', email: '[email protected]' })
  const params = { headers: { 'Content-Type': 'application/json' } }

  const res = http.post('https://api.example.com/users', payload, params)

  check(res, {
    'created': (r) => r.status === 201,
    'has id': (r) => JSON.parse(r.body).id !== undefined,
  })
}

k6 vs JMeter vs Artillery

Feature k6 JMeter Artillery
Language JavaScript XML/GUI YAML
Resource usage Low (Go) High (Java) Medium (Node)
CI/CD Native Possible Native
Cloud option k6 Cloud BlazeMeter Artillery.io
Learning curve Easy Steep Easy

The Bottom Line

k6 is the developer-friendly load testing tool. JavaScript scripts, low resource usage, CI/CD native, and thresholds that fail your pipeline when performance degrades.

Need to automate data collection or build custom scrapers? Check out my Apify actors for ready-made tools, or email [email protected] for custom solutions.

AI Tools That Actually Pay You Back: A Developer’s Guide to Monetizing AI

AI Tools That Actually Pay You Back: A Developer’s Guide to Monetizing AI

=====================================================================================

As a developer, you’re likely no stranger to the world of artificial intelligence (AI) and its many applications. From chatbots to predictive analytics, AI has become an integral part of modern software development. But did you know that there are AI tools that can actually pay you back? In this article, we’ll explore some of the most promising AI tools that can help you monetize your skills and earn a return on investment.

Introduction to AI Monetization

Before we dive into the tools themselves, let’s talk about the concept of AI monetization. AI monetization refers to the process of using AI to generate revenue, either directly or indirectly. This can be achieved through a variety of means, including:

  • Building and selling AI-powered products or services
  • Offering AI-related consulting or training services
  • Creating and licensing AI-powered intellectual property
  • Participating in AI-related affiliate programs or partnerships

Tool 1: Google Cloud AI Platform

The Google Cloud AI Platform is a powerful tool that allows developers to build, deploy, and manage AI models at scale. With the AI Platform, you can create custom machine learning models using popular frameworks like TensorFlow and scikit-learn, and then deploy them to a cloud-based infrastructure.

To get started with the AI Platform, you’ll need to create a Google Cloud account and install the Google Cloud SDK. From there, you can use the following code example to deploy a simple machine learning model:

import pandas as pd
from sklearn.ensemble import RandomForestClassifier
from google.cloud import aiplatform

# Load the dataset
df = pd.read_csv('data.csv')

# Split the data into training and testing sets
train_df, test_df = df.split(test_size=0.2, random_state=42)

# Create a random forest classifier
clf = RandomForestClassifier(n_estimators=100)

# Train the model
clf.fit(train_df.drop('target', axis=1), train_df['target'])

# Deploy the model to the AI Platform
ai_platform = aiplatform.Model(
    display_name='My Model',
    description='A simple random forest classifier'
)
ai_platform.deploy(clf, 'gs://my-bucket/model.pkl')

With the AI Platform, you can monetize your AI models by offering them as a service to customers, or by using them to build and sell AI-powered products.

Tool 2: Amazon SageMaker

Amazon SageMaker is another popular AI tool that allows developers to build, train, and deploy machine learning models. With SageMaker, you can create custom models using popular frameworks like TensorFlow and PyTorch, and then deploy them to a cloud-based infrastructure.

To get started with SageMaker, you’ll need to create an AWS account and install the AWS SDK. From there, you can use the following code example to deploy a simple machine learning model:


python
import pandas as pd
import torch
import torch.nn as nn
from sagemaker.pytorch import PyTorch

# Load the dataset
df = pd.read_csv('data.csv')

# Split the data into training and testing sets
train_df, test_df = df.split(test_size=0.2, random_state=42)

# Create a simple neural network
class Net(nn.Module):
    def __init__(self):
        super(Net, self).__init__()
        self.fc1 = nn.Linear(784, 128)
        self.fc2 = nn.Linear(128, 10)

    def forward(self, x):
        x = torch.relu(self.fc1(x))
        x = self.fc2(x)
        return x

# Train the model
model = Net()
criterion = nn.CrossEntropyLoss()
optimizer = torch.optim.SGD(model.parameters(), lr=0.01)
for epoch in range

GitHub Copilot Workspace Has a Free AI That Plans and Implements Code Changes Across Files

GitHub Copilot Workspace goes beyond autocomplete. You describe a task in natural language, it creates a plan, shows you which files need changes, and implements them — across your entire repository.

How It Works

  1. Open an issue or describe a task
  2. Workspace analyzes your repo and creates a plan
  3. Review the plan: which files change, what changes
  4. Edit the plan if needed
  5. Click Implement — Workspace writes the code
  6. Review diffs, test, create PR

The Key Difference

Feature Copilot (autocomplete) Copilot Workspace
Scope Current line/function Entire repo
Input Code context Natural language task
Output Code suggestions Plan + implementation
Files Single file Multi-file changes
Review Inline Full diff view

Example: “Add dark mode to the settings page”

Workspace would:

  1. Identify settings.tsx, theme.ts, globals.css
  2. Plan: “Add theme toggle component, update CSS variables, persist preference”
  3. Show you the plan before writing code
  4. Implement across all 3 files
  5. Let you review each change

What It’s Best At

  • Bug fixes from issue descriptions
  • Feature implementations across multiple files
  • Refactoring (rename, extract, reorganize)
  • Adding tests for existing code
  • Documentation updates

Limitations

  • Still in technical preview
  • Works best with well-described issues
  • Complex architectural changes need human guidance
  • May miss edge cases

The Bottom Line

Copilot Workspace is the future of AI-assisted development: task-level, not line-level. You describe what needs to change, review the plan, and let AI implement it.

Need to automate data collection or build custom scrapers? Check out my Apify actors for ready-made tools, or email [email protected] for custom solutions.