OPPO Find X9s Pro, iki farklı 200 megapiksel kamera ile geliyor

OPPO Find X9s Pro

OPPO Find X9s ProYapılan resmi doğrulamaya göre yakında tanıtılacak OPPO Find X9s Pro, iki farklı 200 megapiksel kamera ile geliyor. Telefonun arkasında spesifik olarak 200 megapiksel Samsung HP5 sensörlü geniş açı, 200 megapiksel Samsung HP5 sensörlü periskop telefoto ve 50 megapiksellik ultra geniş açı kameraların bir araya getirileceği aktarılırken, cihaza gücünü MediaTek Dimensity 9500 işlemcinin vereceği iddia ediliyor. 6,32 inç 120 Hz LTPS OLED ekranla donatılacağı öne sürülen Find X9s Pro, sızıntılara göre kompakt bir seçenek olmasına rağmen 80W kablolu ve 50W kablosuz şarj destekli 7.000 mAh batarya ile geliyor.

OPPO Find X9s Pro, iki farklı 200 megapiksel kamera ile geliyor yazısı ilk olarak Teknoloji haberleri – LOG üzerinde yayınlandı.

RAI Institute’ten hareket kabiliyetiyle öne çıkan robot: Roadrunner [Video]

RAI Institute’ten hareket kabiliyetiyle öne çıkan robot: Roadrunner [Video]

RAI Institute’ten hareket kabiliyetiyle öne çıkan robot: Roadrunner [Video]2022 yılında Hyundai Motor Grubu’nun 400 milyon dolarlık yatırımıyla kurulan ve şu anda Hyundai’nin sahibi olduğu Boston Dynamics’in kurucusu ve yönetim kurulu başkanı Marc Raibert tarafından yönetilen RAI Institute, bu kez hareket kabiliyetiyle öne çıkan robot prototipi Roadrunner ile dikkat çekti. 15 kg gövde ağırlığına sahip olan robot, sabit ayaklar yerine tekerleklerin kullanıldığı iki bacak üzerinde hareket ediyor ve hem paralel hem de normal modda ilerleyebiliyor. Aynı zamanda yürüyebilen ve rahatlıkla merdiven çıkıp inebilen robot, birçok benzerinden daha hızlı hareket edebiliyor ve tek ayak/tek tekerlek üzerinde de durabiliyor. Model için yaptığı açıklamada, “Robotun bacakları tamamen simetrik olduğu için dizlerini öne veya arkaya doğru bükebiliyor; bu da engelleri aşmasını ya da özel hareketleri yapabilmesini sağlıyor.” ifadelerini kullanan RAI Institute, geliştirilen bu temeli ileride tam fonksiyonlu bir insansı robota entegre edebilir. RAI Institute bundan önce gösterdiği performans ile oldukça şaşırtan bu robot prototipiyle çok ses getirmişti:

RAI Institute’ten hareket kabiliyetiyle öne çıkan robot: Roadrunner [Video] yazısı ilk olarak Teknoloji haberleri – LOG üzerinde yayınlandı.

Epistemic Control Systems: governing belief, not reality

CodeRabbit screenshot

An invariant analysis of Epistemic Control Systems, a class of systems that govern belief about reality, not reality itself.

What this class of system is

An Epistemic Control System governs knowledge about reality, not reality itself. It produces, validates, and evolves belief under uncertainty. The canonical examples span domains: financial settlement systems, ML feature stores, logistics routing systems, medical record synthesis. They share the same physics.

The fundamental control variable is confidence-weighted truth over time. Not availability. Not latency. Not throughput. A system in this class that sacrifices correctness for freshness has changed what it is. It is no longer an epistemic system. It is an approximation engine, a different beast with different failure modes.

The Canonical Loop

Stage Role
Time Driver
Historical observations Input
Synthesis and aggregation Transformation
Immutable snapshot Output
Next time boundary Continuation

There is no notion of now inside this loop. Only as of T exists. The system does not stream truth continuously. It advances truth in discrete, verified steps. Each step either completes or it does not. There is no partial completion.

Universal Primitives

These six primitives exist in every epistemic system, regardless of domain or technology:

  • Observation: the raw input signal
  • Time Window: the boundary of what counts as input
  • Synthesis: the aggregation and confidence-weighting process
  • Snapshot: the immutable output of a completed synthesis
  • Publication Gate: the binary control that determines whether truth advances
  • Authority Pointer: the reference to the last trusted snapshot

A logistics routing system has all six. A clinical trial data system has all six. A trading book reconciliation system has all six. The names change. The structure does not.

Non-Negotiable Invariants

These are the system physics. Violating any one does not degrade the system. It changes what the system is.

  1. Truth advances only on success, never on partial confidence
  2. Canonical knowledge is always historical, never present-tense
  3. Failure cannot retract belief. It can only pause advancement
  4. Snapshots are immutable once published
  5. Correctness strictly dominates freshness
  6. Knowledge never enacts control. It only informs it
  7. Truth is monotonic and confidence-bounded

A snapshot that can be retracted is no longer a snapshot. A gate that passes partial results is no longer a gate. The identity of the system is constituted by these invariants, not by its implementation.

What Failure Means

  • Failure pauses time, not the world

When a synthesis step fails due to an upstream data gap, a timeout, or a confidence threshold not met, the instinct is to call this a system failure. It is not. The world continued. The system paused its clock.

This distinction is architectural, not semantic. A system that treats failure as a retraction of prior belief will corrupt its state. A system that treats failure as a pause in time advancement will remain coherent. The next successful run does not repair a broken state. It simply advances time from where it stopped.

The diagnostic question is never “why did it fail?” first. It is always: “did correctness survive?” If yes, the system worked. It paused time. It did not break.

Containment Boundaries

Three boundaries prevent epistemic corruption, the condition where partial belief leaks into the consumption layer and is treated as complete truth.

Boundary 1: Reasoning boundary
Failure is permitted here. Uncertainty resolves inside. Nothing crosses until synthesis is complete.

Boundary 2: Publication boundary
All or nothing. Truth crosses or it does not. This is the critical gate. It is binary by design.

Boundary 3: Consumption boundary
Readers trust the snapshot only. Never partial state. The snapshot they receive is complete or it does not exist.

This boundary model assumes observation integrity. The question of what governs input legitimacy before the reasoning boundary is a separate analysis.

Explicit Anti-Goal

This system should not become a real-time truth oracle.

The chain is direct: real-time implies partial belief, partial belief implies false certainty, false certainty scales into harm.

Freshness pressure is the most common way epistemic systems lose their identity. The moment a system begins publishing partial snapshots to reduce latency, it has crossed the boundary into a different class, one without the safety properties described here.

Human feedback as stabiliser

At scale, epistemic systems face oscillation risk. Urgency signals cause the system to lower its confidence threshold, which causes incorrectness, which causes downstream harm, which increases urgency.

The circuit breaker is human judgment. Humans interpret the freshness-correctness trade-off. Humans re-weight priority. The system does not auto-escalate. It waits.

This is not a limitation. It is a safety property.

Summary

  • Epistemic systems control belief, not reality.
  • They advance truth only when confidence is complete.
  • Failure pauses time, not the world.
  • Correctness is sacred. Freshness is negotiable.

Rio: An AI Agent That Lives Inside Notion — Voice Task Live Notion Memory

This is a submission for the Notion MCP Challenge

What I Built

Rio is a voice-controlled multi-agent AI system. You speak a task — Rio’s agents plan it, execute it on your desktop, research it on the web, and write the result. Every single step of that process lives in your Notion workspace, written in real time, structured, searchable, and yours.

Notion isn’t a plugin here. It’s the mind Rio thinks in.

The Problem

AI agents are powerful and invisible. They spin up, do work, disappear. You get a final answer with no trace of how it got there — no audit trail, no structured memory, nothing you can build on top of.

Rio solves that by making Notion the surface where agents think out loud. Every task claimed, every browser step taken, every report written — it all lands in structured Notion databases as it happens, not after the fact.

Demo

What you’ll see:

  • A pending task sitting in the Rio Task Queue database
  • A voice command to Rio — “Research the top 3 AI agent frameworks and write a comparison”
  • The Rio Logs database populating live — one row per agent step, in real time
  • The Creative Agent writing a full formatted Notion page as the final deliverable
  • The task row flipping to done

How Notion MCP Is Core

There are two distinct ways Notion is used — and both matter.

1. Notion as memory

Every agent writes structured logs as it works. Not at the end — during. The Orchestrator logs when it claims a task. The UI Navigator logs each browser action. The Creative Agent writes the full report as a Notion page.

# Every logger.info() becomes this
await memory.log_step("ui_navigator", "browser_step", action, "done")
# → live Notion row: agent name, event, detail, status, timestamp

2. Notion as a reasoning tool (via MCP)

Agents actively query and write Notion during execution — not just at completion. The Orchestrator polls the Task Queue for new jobs. The Creative Agent searches existing pages before writing.

tools, toolset = await MCPToolset.from_server(
    connection_params=SseServerParams(
        url="https://mcp.notion.com/sse",
        headers={"Authorization": f"Bearer {user_token}"}
    ),
    tool_filter=["notion-search", "notion-create-pages", "query-database"]
)

No .env Tokens. Anyone Can Use This.

Rio uses a full OAuth 2.0 + PKCE flow. A user clicks “Connect Notion,” approves access, and their token lives in session memory. No database IDs are hardcoded anywhere. The moment they connect, Rio auto-creates their Rio Logs and Rio Task Queue databases — zero manual Notion setup.

User clicks Connect Notion
  → /oauth/start  — PKCE verifier generated, redirect to Notion login
  → /oauth/callback — code exchanged, token stored in session memory
  → auto_setup() — Rio Logs DB + Task Queue DB created in their workspace
  → WebSocket init — agents get NotionMemory + MCPToolset injected

The only things in .env are your app’s own client_id and client_secret from notion.so/my-integrations.

Architecture

RIO — SYSTEM ARCHITECTURE
==========================

                        User
                          |
                    Voice Input
                          |
                          v
              +-------------------------+
              |   Orchestrator Agent    |
              |  polls Notion Task      |
              |  Queue for pending jobs |
              +-------------------------+
                 |         |        |
                 v         v        v
        +------------+ +----------+ +-----------------+
        | Live Agent | | UI Navi- | | Creative Agent  |
        | voice STT  | | gator    | | research, write |
        | + TTS      | | browser  | | full Notion     |
        |            | | desktop  | | pages + reports |
        +------------+ +----------+ +-----------------+
                 |         |        |
                 v         v        v
        +---------------------------------------+
        |            NotionMemory               |
        |  writes every step live to Notion     |
        |  via REST API  (httpx async)          |
        |                                       |
        |   Rio Logs DB       Task Queue DB     |
        |   Agent / Event     Task / Status     |
        |   Detail / Status   Agent / Result    |
        +---------------------------------------+
                          |
                          v
        +---------------------------------------+
        |             MCPToolset                |
        |  lets agents query + search Notion    |
        |  during execution  (SSE transport)    |
        |                                       |
        |   notion-search    query-database     |
        |   notion-create    append-block       |
        +---------------------------------------+
                          |
                          v
              +-------------------------+
              |   User Notion Workspace |
              |   connected via OAuth   |
              |   PKCE — no env tokens  |
              +-------------------------+


OAUTH FLOW
----------

  User clicks "Connect Notion"
          |
          v
  /oauth/start
  generate code_verifier + code_challenge (PKCE S256)
          |
          v
  api.notion.com/v1/oauth/authorize
  user approves Rio access in their own browser
          |
          v
  /oauth/callback
  exchange code + verifier for access_token
  store token in session (in-memory, per user)
          |
          v
  NotionMemory.setup()
  auto-creates Rio Logs DB + Task Queue DB
  in the user workspace if not already present
          |
          v
  MCPToolset.from_server()
  connects to mcp.notion.com/sse
  with user access_token — agents ready

Stack: Python · Google ADK · FastAPI · WebSockets · Notion REST API · Notion MCP (SSE) · httpx async · Google Cloud Run

What I Learned

Building agents is easy. Building agents with observable, persistent memory is what actually makes them useful.

The shift from logger.info() to await memory.log_step() sounds trivial — but it completely changes the character of the system. Rio’s work is no longer ephemeral. It accumulates. You can go back, search it, build on it, share it. That’s what Notion gives it.

The OAuth decision was also non-negotiable. An agent that only works with hardcoded tokens is a demo. An agent that any person can authorize with their own workspace is a product.

Rio Notion Live Web – Rio-Notion Live Web

Source Code

Stop the Awkward Silence: Signals to Classic Orchestration

Intro:
If you’ve used generative orchestration in Copilot Studio, you’ve seen the comforting “thinking” animation while the copilot works. Classic orchestration doesn’t do that out of the box. So when you kick off a longer task—like a RAG lookup or a flow call—the chat can look empty. No typing dots. Just silence.
That silence is a UX bug, not a feature. The fix is quick: send a Typing event immediately before the slow step, then add a short acknowledgement message to set expectations.

Configuration:

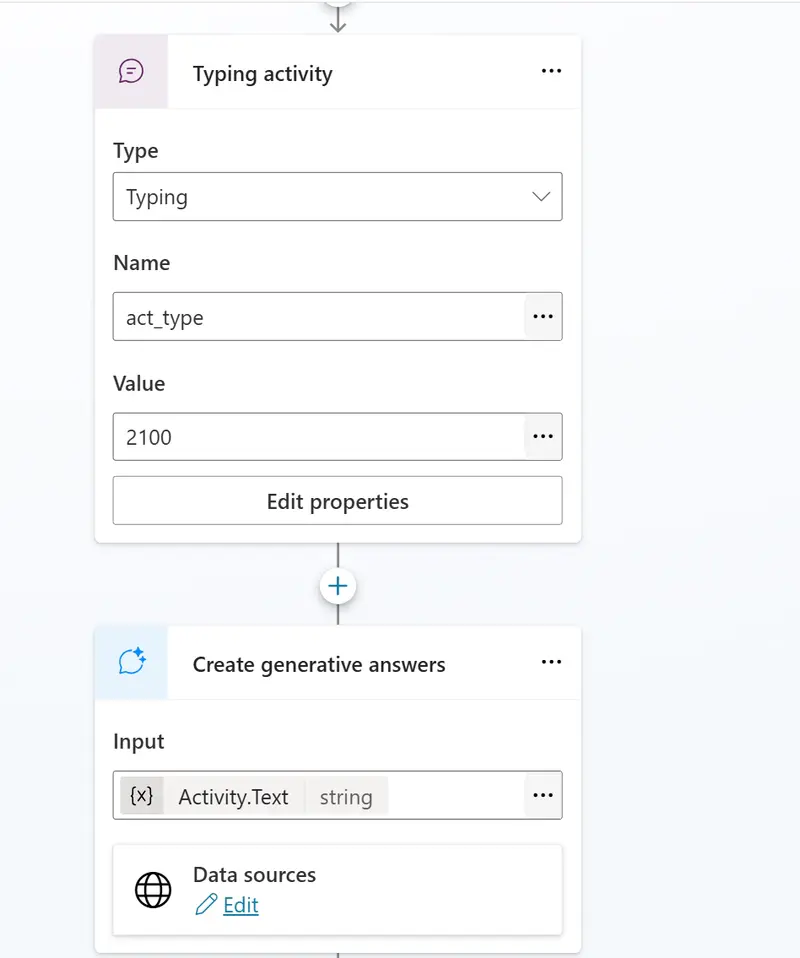
  • Locate the slow step or Topic where you have user feedback on the poor UX expereince (May be based on the user activity we might have logic where the heavy work starts: Create generative answers, a flow, or an HTTP/API call.)

  • Set Event type to Typing.

The example below the timer is set as 2100 ( milliseconds)

Add a brief acknowledgement message Right after the Typing event, add a normal message to set expectations. Keep it human and specific:

“Got it — searching our knowledge base. This may take a few seconds.”
“Working on your request — I’ll be right back with the details.”

Good UX patterns to include:

  • Time cue: “This usually takes ~5–10 seconds.” It sets expectations and reduces anxiety.
  • Specific context: “Checking SAP invoices…” feels more reassuring than generic “Working…”
  • Channel-aware: Typing events are short-lived (around 2-4 seconds). Always send an acknowledgement text so users see something even if the channel ignores Typing.

Closing Notes:
A great bot isn’t just smart — it’s considerate. In classic orchestration, adding a Typing event plus a short acknowledgement transforms a “silent” wait into a clear, reassuring experience. It takes less than a minute to wire up and pays off immediately in user confidence and perceived speed.

I Built an AI Agent That Thinks in Notion (And Can Give His Brain a Makeover)

This is a submission for the Notion MCP Challenge

(Fair warning: I found out about this challenge a week late. If I’m past the deadline, blame my feed algorithm ty ily <3)

What I Built

Hey y’all! Quick context: I believe you’ve met OpenFiend in my previous post, so this one is all about the Notion MCP build.

The idea: what if Notion wasn’t where an AI agent just stores things, but where it actually… thinks? Decisions, tasks, memory, workspace customization – all living in Notion, all perfectly readable AND editable?

This is an experiment in making AI agents transparent by design. If Bob’s brain is a Notion workspace, you can open it up, read his reasoning, override his decisions, and shape how he operates with basically no code required (though you’ll probably feel like you’re writing some!).

What Bob can do today:

  • Decision gates (implemented + tested) – Before Bob runs a risky action, he writes a proposal to Notion Decisions as pending_approval. Approving directly in Notion (or in the UI – the choice is still yours) unblocks Bob.

  • Async task queue (implemented + tested) – Drop a task in Tasks with pending; Bob picks highest-priority work first, executes, writes result, and updates status.

  • Scheduled tasks (implemented, lightly tested) – Tasks with future ScheduledFor are skipped until due time. Bob is quite punctual when circumstances allow.

  • Mind customization (implemented + tested) – Bob can restyle his own Notion root page. He can preset themes, icons, covers, and block layouts (just so the workspace feels personal and less generic).

  • Persistent memory & will (implemented, not deeply tested in demo) – Bob can read and write long-term memory and “will” statements to Notion, injecting them as runtime context. Deeper integration into the live session loop is coming in later updates.

  • Autopsy reports (implemented, not demo-tested) – Failure report write/read module exists.

  • Threat logging (implemented, not demo-tested) – Bob can log and retrieve security events from Notion. The module works but isn’t wired into active detection paths yet.

  • Shadow logs (implemented, not demo-tested) – Shadow observation read/write/enable exists but was not included in the final demo run.

The tech stack:

  • Frontend: React + Vite + Tailwind CSS (3-panel layout: chat, history, audit trail)
  • Backend: Node.js + Express + WebSockets
  • Database: SQLite (via Drizzle ORM) for local persistence
  • AI: Vercel AI SDK with Anthropic Claude
  • Notion: Root page + structured databases for agent state
  • MCP: @notionhq/notion-mcp-server + @modelcontextprotocol/sdk

Video Demo

What the demo shows:

  1. Boot + daemon init – Backend starts, Notion brain is connected, pollers start.

  2. Decision gate flow – A sensitive action triggers a decision in Notion as pending_approval. Approved directly in Notion. Bob continues only after approval.

  3. Task queue flow – A pending task is added to Tasks. Poller picks it up, transitions pending -> in_progress -> completed, and writes result/timestamps.

  4. Mind customization – Bob applies a preset to his own workspace page. Icon/cover/blocks update in Notion.

Show us the code

GitHub logo

jreed18
/
openfiend

Bob. A fiend on your side. Local-first AI agent that shows every move and asks before making them.

O P E N F I E N D

NO BLACK BOXES. NO TRUST REQUIRED.

v0.1
License
TypeScript
Open Source

Security-first AI agent platform.
Every action visible. Every permission explicit. Everything auditable.

> WHAT IS THIS

OpenFiend is an AI agent platform where transparency isn’t a feature — it’s the architecture.

The first agent — Bob — is a paranoid, audit-log-obsessed assistant powered by Claude. You talk to Bob through a real-time WebSocket chat interface. Everything he does is logged, visible, and controllable.

This is v0.1. It's early and messy, but we're (I'm) making it work!

⚠️ Not production-ready: OpenFiend is an early-stage project and has not been tested thoroughly enough for production use yet.

> QUICK START

git clone https://github.com/jreed18/openfiend.git
cd openfiend
cp .env.example .env.local    # add your API keys (see .env.example)
pnpm install
pnpm dev
Service URL
Frontend localhost:5173
Backend localhost:3737
WebSocket ws://localhost:3737/ws

Requires Node.js 22+ and pnpm 9+

> ARCHITECTURE

┌──────────────────────────────────────────────────────────────┐
│

…

The Notion integration lives in packages/backend/src/tools/notion/. Key files:

File What it does
mcpClient.ts MCP connection + API-* tool calls + data source lookup cache
client.ts Original Notion SDK client (pre-MCP)
setup.ts First-run workspace/database creation + ID persistence
poller.ts Background polling for decisions + tasks
sections/decisions.ts Ethical review board (write/read/approve) via MCP
sections/tasks.ts Async task queue + scheduling via MCP
sections/mind.ts Root page customization via MCP
sections/memory.ts Long-term memory + will statements
sections/autopsies.ts Post-mortem failure reports
sections/threats.ts Security event feed
sections/shadow.ts Shadow mode observations

How I Used Notion MCP

Notion isn’t meant to be just a storage layer for OpenFiend. I am working on further developing it as the identity and control layer.

The architecture

Bob uses an MCP adapter (mcpClient.ts) to call Notion tools exposed by @notionhq/notion-mcp-server.

// packages/backend/src/tools/notion/mcpClient.ts
export async function callNotionTool<T = any>(name: string, args: Record<string, any>): Promise<T> {
  const client = await getNotionMcpClient();
  const response: any = await client.callTool({ name, arguments: args });
  const first = response?.content?.[0];
  const text = first && 'text' in first ? first.text : '';

  if (!text) return {} as T;

  try {
    return JSON.parse(text) as T;
  } catch {
    return ({ raw: text } as unknown) as T;
  }
}

Decisions/tasks/mind now use MCP tools like:

  • API-post-page
  • API-patch-page
  • API-query-data-source
  • API-patch-block-children
  • API-retrieve-a-database

Why MCP specifically

MCP gave me a standardized interface for Notion operations and made it easier to keep Notion access in one adapter layer (plus, the challenge kinda required it).

Decision gates via MCP

Before Bob takes a risky action, he writes a structured proposal to Notion as pending_approval:

// packages/backend/src/tools/notion/sections/decisions.ts
const response = await callNotionTool<any>('API-post-page', {
      parent: {
        type: 'database_id',
        database_id: decisionsDbId,
      },
      properties: {
        Action: { title: [{ text: { content: data.action } }] },
        Reasoning: { rich_text: [{ text: { content: data.reasoning } }] },
        Risks: { rich_text: [{ text: { content: data.risks } }] },
        Risk: { select: { name: data.riskLevel } },
        Status: { select: { name: data.status } },
        ConversationId: { rich_text: [{ text: { content: data.conversationId } }] },
        Annotation: { rich_text: [{ text: { content: data.annotation } }] },
        Timestamp: { date: { start: data.timeStart, end: data.timeEnd } },
        Tool: { rich_text: [{ text: { content: data.tool } }] },
      }
});

The user approves or rejects directly in Notion. The poller (below) detects the status change and unblocks Bob.

Task queue via MCP

Bob queries pending tasks sorted by priority:

// packages/backend/src/tools/notion/sections/tasks.ts
const dataSourceId = await getDataSourceId(tasksDbId);

const notionResult = await callNotionTool<any>('API-query-data-source', {
  data_source_id: dataSourceId,
  filter: {
    property: 'Status',
    select: { equals: 'pending' },
  },
  sorts: [{ property: 'Priority', direction: 'descending' }],
});

The polling pattern (and why not webhooks)

OpenFiend runs locally. Polling is simpler and reliable without public webhook infra.

  • Decision poller (10s) – Watches decision status changes and resolves pending permission promises.
  • Task poller (60s, dynamic) – Picks pending tasks, runs them, writes results back.
// packages/backend/src/tools/notion/poller.ts
const decisions = await readPendingDecisions();

for (const decision of decisions) {
    const { pageId, status: currentStatus } = decision;
    if (!pageId) continue;

    // Check if we've seen this decision before and if its status has changed
    const previousStatus = statusCache.get(pageId);
    statusCache.set(pageId, currentStatus);

    // First time seeing this decision - cache and skip
    if (!previousStatus) continue;

    if (previousStatus === 'pending_approval'
        && (currentStatus === 'approved' || currentStatus === 'rejected')) {
        const eventType = currentStatus === 'approved' ? 'decision_approved' : 'decision_rejected';

        console.log(`[Notion Poller] Detected decision ${currentStatus} for pageId ${pageId}`);

        resolveDecision(pageId, currentStatus === 'approved' ? PermissionStatus.Approved : PermissionStatus.Rejected);
        broadcastToClients({ type: eventType, decision });
    }
}

Mind customization via MCP

// packages/backend/src/tools/notion/sections/mind.ts - apply_preset action
await callNotionTool('API-patch-page', {
  page_id: rootPageId,
  icon: { type: 'external', external: { url: 'https://www.notion.so/icons/brain_gray.svg' } },
  cover: { type: 'external', external: { url: 'https://images.unsplash.com/photo-1518770660439-4636190af475' } },
});

await callNotionTool('API-patch-block-children', {
  block_id: rootPageId,
  children: [
    {
      object: 'block', type: 'heading_2',
      heading_2: { rich_text: [{ type: 'text', text: { content: 'Mind' } }] },
    },
    {
      object: 'block', type: 'paragraph',
      paragraph: { rich_text: [{ type: 'text', text: { content: 'Focused layout. Keep only what matters.' } }] },
    },
  ],
});

What this unlocks

  • Human-in-the-loop approvals directly in Notion
  • Async Notion task execution without opening chat
  • Agent workspace customization as a first-class operation

Crash recovery

On restart:

  • in_progress tasks are reset to pending
  • orphaned pending_approval decisions are auto-rejected

No manual cleanup required. Throughout development I’ve come to know how annoying it can get…

Upcoming Features

Guided by my internal “Bob’s Horcrux” plan (a little code name for this project), next features are:

  • /config database (not implemented yet)
  • Notion-driven runtime config (model, thresholds, shadow toggle, tools)
  • Poll config every 60s and apply without restart

  • /weekly-report (not implemented yet)

  • Sunday Notion report generated from SQLite audit logs

  • Structured sections: wins, struggles, unusual events, next-week plan

  • Horcrux-level memory + will loop

  • Read Will + recent memory on startup and inject into live system context every session

  • Expand memory writes from simple storage to structured user/profile/project summaries

  • Support session-linked memory trails for better long-horizon continuity

  • Deeper wiring for existing sections

  • Threats/autopsies/shadow are implemented as modules, but need fuller production wiring + dedicated demo coverage

  • Threats: wire directly into prompt-injection and suspicious-action detection paths

  • Autopsies: auto-create on critical failures and tool-chain exceptions

  • Shadow log: first-class review workflow where users can promote safe actions into enabled behavior. Will become rather crucial once the shadow / observer mode gets fully implemented

  • Notion-native control surface

  • Make Notion the primary control panel for Bob behavior tuning, not just a log sink

  • Add “editable policy” pages so non-technical users can safely shape Bob’s operating rules

  • More granular mind customization: let users define their own presets, per-section styling, and layout preferences beyond the built-in themes

  • Broader MCP adoption

  • Continue moving remaining Notion sections to MCP transport for full consistency

  • Toward full Horcrux mode

  • Goal: if users opt in, Notion becomes Bob’s complete operational identity layer

  • Decisions, tasks, memory, policies, reports, and configuration all become transparent and editable in one place

  • If Notion is disconnected, Bob should degrade gracefully while clearly signaling that his “brain state” is unavailable

Last-Minute Reality Check

I initially built this integration with the Notion SDK, then realized late that the challenge specifically required Notion MCP as a core part of the build.
So I did a last-minute refactor to route the core paths (decisions, tasks, and mind customization) through @notionhq/notion-mcp-server + @modelcontextprotocol/sdk.

It wasn’t the most comfortable timing, but it pushed the architecture in a better direction: a single MCP adapter layer for Notion operations, with clearer boundaries for future expansion.

I’m building OpenFiend in public because I think AI agents should be built in the open. If you’ve got thoughts on transparent AI, agent architecture, or just want to tell Bob he’s doing great (he needs it), we’d both love to hear from you!

Take care, polar bear!

Check out OpenFiend

My first Python project: Excel to SQL pipeline (feedback welcome)

I’ve just made my first substantial Python project public. It’s an Excel-to-SQL pipeline focused on cleaning messy spreadsheet data and preparing it for database ingestion.

This is still a work in progress, and I’m actively improving it.

Problem

Working with Excel data often means dealing with:

  • Inconsistent date and time formats
  • Mixed data types in a single column
  • Missing or malformed values
  • Subtle issues that only surface during database insertion

I wanted a reusable way to clean and standardise this kind of data before loading it into SQL.

Approach

The project focuses on:

  • Column-wise cleaning functions (dates, times, text, etc.)
  • Configurable parsing with strict vs permissive modes
  • Clear error reporting with row-level context
  • Separation between cleaning logic and pipeline orchestration

The goal is to make the pipeline predictable and easier to debug when something goes wrong.

Example

Input (Excel):

  • Mixed date formats
  • Numbers stored as text
  • Invalid values scattered through columns

Output:

  • Cleaned, typed data ready for SQL insertion
  • Invalid values either coerced or flagged, depending on mode

What I’m unsure about

I’d really value feedback on:

  • Code structure and modularity
  • Naming conventions and readability
  • Error handling design
  • Testing approach and coverage
  • Overall project organisation

Next step

The next phase is building the SQL writer layer so the pipeline can automatically create tables in SQL Server and populate them with the cleaned data.

Repo

https://github.com/juliana-albertyn/excel-to-sql

I’m learning as I build, so constructive criticism is very welcome.

Build a GEX Dashboard with Python: Gamma Exposure Monitor in One API Call

If you’ve tried to compute gamma exposure yourself, you know the pain: source options chains, aggregate OI across all expirations, model dealer positioning assumptions, compute dollar gamma per strike, find the flip level, identify walls. That’s months of engineering before you display a single bar chart.

A handful of API calls replace all of it.

What the Endpoints Return

Endpoint Tier What You Get
/v1/exposure/gex/{symbol} Free Per-strike GEX with call/put breakdown, OI, volume, OI change
/v1/exposure/levels/{symbol} Free Gamma flip, call wall, put wall, max gamma strikes, highest OI, 0DTE magnet
/v1/exposure/summary/{symbol} Growth Net GEX/DEX/VEX/CHEX, regime, interpretation, dealer hedge estimates
/v1/exposure/dex/{symbol} Free Delta exposure by strike
/v1/exposure/vex/{symbol} Free Vanna exposure by strike
/v1/exposure/chex/{symbol} Free Charm exposure by strike

GEX and levels are free tier. You can build a fully functional gamma exposure dashboard without spending anything.

Quick Start

pip install flashalpha
from flashalpha import FlashAlpha

fa = FlashAlpha("YOUR_KEY")
gex = fa.gex("SPY")

print(f"Net GEX:    {gex['net_gex']:,.0f}")
print(f"Gamma flip: {gex['gamma_flip']}")
print(f"Price:      {gex['underlying_price']}")
print(f"Strikes:    {len(gex['strikes'])} levels")

# Top 5 strikes by absolute net GEX
top = sorted(gex["strikes"], key=lambda s: abs(s["net_gex"]), reverse=True)[:5]
for s in top:
    print(f"  {s['strike']:>8.1f}  call={s['call_gex']:>12,.0f}  put={s['put_gex']:>12,.0f}  net={s['net_gex']:>12,.0f}")

Or curl:

curl -H "X-Api-Key: YOUR_KEY" 
  "https://lab.flashalpha.com/v1/exposure/gex/SPY"

Free tier: 10 req/day, no credit card. Get your key.

What Each Field Means

The GEX response includes per-strike data:

  • gamma_flip — the strike where net GEX crosses zero. Above it = positive gamma (pinning). Below it = negative gamma (amplification). The single most important level.
  • net_gex — total net gamma across all strikes. Positive = dealers long gamma overall.
  • call_gex / put_gex — per-strike gamma from calls (positive) and puts (negative) separately.
  • call_oi_change / put_oi_change — day-over-day open interest change. Shows where new positions are being built.

The levels response gives you the key price levels:

levels = fa.exposure_levels("SPY")
lvl = levels["levels"]

print(f"Gamma flip:         {lvl['gamma_flip']}")
print(f"Call wall:          {lvl['call_wall']}")          # Resistance
print(f"Put wall:           {lvl['put_wall']}")           # Support
print(f"Max + gamma:        {lvl['max_positive_gamma']}")  # Strongest pin
print(f"Max - gamma:        {lvl['max_negative_gamma']}")  # Strongest amplifier
print(f"Highest OI:         {lvl['highest_oi_strike']}")   # OI magnet
print(f"0DTE magnet:        {lvl['zero_dte_magnet']}")     # Intraday gravity

Call wall = where call gamma concentrates most heavily (resistance). Put wall = where put gamma concentrates (support, but dangerous if it breaks). 0DTE magnet = where same-day options are pulling price during the current session.

Building the Dashboard

1. GEX by Strike Bar Chart

The centerpiece. Each bar = net gamma at that strike. Positive (green) = call-dominated. Negative (red) = put-dominated.

import matplotlib.pyplot as plt

gex = fa.gex("SPY")

strikes = [s["strike"] for s in gex["strikes"]]
net_gex = [s["net_gex"] for s in gex["strikes"]]
colors = ["#16a34a" if g >= 0 else "#dc2626" for g in net_gex]

fig, ax = plt.subplots(figsize=(14, 6))
ax.bar(strikes, net_gex, color=colors, width=0.8)
ax.axvline(gex["underlying_price"], color="#2563eb", linestyle="--", label="Spot")
ax.axvline(gex["gamma_flip"], color="#f59e0b", linestyle="-", linewidth=2, label="Gamma Flip")
ax.set_xlabel("Strike")
ax.set_ylabel("Net GEX ($)")
ax.set_title(f"SPY Gamma Exposure | Net: {gex['net_gex_label']}")
ax.legend()
plt.tight_layout()
plt.savefig("spy_gex.png", dpi=150)

For web dashboards, map the same data to Chart.js, D3.js, or Lightweight Charts. The strikes array is pre-sorted by strike price.

2. Gamma Flip and Regime

The most important number on the dashboard. Display prominently with context:

price = gex["underlying_price"]
flip = gex["gamma_flip"]

regime = "POSITIVE GAMMA" if price > flip else "NEGATIVE GAMMA"
distance = ((price - flip) / price) * 100

print(f"Gamma Flip: {flip}")
print(f"Spot:       {price}")
print(f"Regime:     {regime}")
print(f"Distance:   {distance:+.2f}%")

Color the background green when price is above the flip (expect pinning) and red when below (expect amplification). This one indicator changes your entire trading approach for the day.

3. Key Levels Panel

All key levels in one call. Display as horizontal lines on a price chart or as a compact summary:

levels = fa.exposure_levels("SPY")
lvl = levels["levels"]

key_levels = [
    ("Call Wall (resistance)", lvl["call_wall"]),
    ("Put Wall (support)",     lvl["put_wall"]),
    ("Max + Gamma (pin)",      lvl["max_positive_gamma"]),
    ("Max - Gamma (amplify)",  lvl["max_negative_gamma"]),
    ("Highest OI (magnet)",    lvl["highest_oi_strike"]),
    ("0DTE Magnet (intraday)", lvl["zero_dte_magnet"]),
    ("Gamma Flip",             lvl["gamma_flip"]),
]

for label, value in key_levels:
    print(f"  {label:<28s} {value:>8.1f}")

Call wall and put wall define the likely range. 0DTE magnet is where intraday price gravitates as same-day options decay. These levels update throughout the trading day.

4. Multi-Expiry Breakdown

Filter by expiration to see where GEX concentrates:

expirations = ["2026-03-30", "2026-04-03", "2026-04-17"]

for exp in expirations:
    gex_exp = fa.gex("SPY", expiration=exp)
    total = sum(s["net_gex"] for s in gex_exp["strikes"])
    top = max(gex_exp["strikes"], key=lambda s: abs(s["net_gex"]))
    print(f"{exp}: net_gex={total:>14,.0f}  top_strike={top['strike']}")

This reveals whether GEX is in 0DTE (short-term pinning) or monthly options (structural positioning). A dashboard that only shows aggregate GEX misses this.

5. OI Change Tracking

Where are new positions being built?

gex = fa.gex("SPY")

oi_movers = sorted(
    gex["strikes"],
    key=lambda s: abs(s["call_oi_change"]) + abs(s["put_oi_change"]),
    reverse=True
)[:10]

print("Top OI Movers (day-over-day):")
for s in oi_movers:
    print(f"  {s['strike']:>8.1f}  call_oi={s['call_oi_change']:>+7,d}  put_oi={s['put_oi_change']:>+7,d}")

Large OI increases strengthen a level as a magnet or wall. OI decreases mean the level is losing significance. Track daily to see how the GEX profile evolves.

The Full Exposure Stack: DEX, VEX, CHEX

GEX alone misses three critical forces. All on the free tier:

Metric Endpoint What It Measures Why It Matters
DEX /v1/exposure/dex/{symbol} Directional dealer exposure Shows which direction dealer hedging pushes price
VEX /v1/exposure/vex/{symbol} Vanna exposure (delta sensitivity to IV) Drives “vol-down, market-up” dynamic. Explains post-FOMC rallies
CHEX /v1/exposure/chex/{symbol} Charm exposure (delta sensitivity to time) Explains predictable flows into the close on expiry days
gex = fa.gex("SPY")
dex = fa.dex("SPY")
vex = fa.vex("SPY")
chex = fa.chex("SPY")

print(f"GEX  net: {gex['net_gex']:>14,.0f}  (gamma - vol regime)")
print(f"DEX  net: {dex['net_dex']:>14,.0f}  (delta - direction)")
print(f"VEX  net: {vex['net_vex']:>14,.0f}  (vanna - IV sensitivity)")
print(f"CHEX net: {chex['net_chex']:>14,.0f}  (charm - time decay flow)")

When all four align in one direction, you have the highest-conviction setup. GEX tells you the volatility regime. DEX tells you direction. VEX tells you what happens if IV moves. CHEX tells you which way time alone pushes the market.

Multi-Symbol Scanner

Monitor GEX across your watchlist and flag regime changes:

from flashalpha import FlashAlpha

fa = FlashAlpha("YOUR_KEY")
symbols = ["SPY", "QQQ", "IWM", "TSLA", "AAPL", "NVDA", "AMD", "META", "AMZN", "MSFT"]

print(f"{'Symbol':<8} {'Price':>8} {'Flip':>8} {'Regime':<10} {'Net GEX':>14} {'Call Wall':>10} {'Put Wall':>10}")
print("-" * 78)

for sym in symbols:
    try:
        gex = fa.gex(sym)
        levels = fa.exposure_levels(sym)
        lvl = levels["levels"]

        price = gex["underlying_price"]
        flip = gex["gamma_flip"]
        regime = "POS GAMMA" if price > flip else "NEG GAMMA"

        print(f"{sym:<8} {price:>8.2f} {flip:>8.1f} {regime:<10} "
              f"{gex['net_gex']:>14,.0f} {lvl['call_wall']:>10.1f} {lvl['put_wall']:>10.1f}")

        if price < flip:
            print(f"  >> WARNING: {sym} in negative gamma - expect amplified moves")

    except Exception as e:
        print(f"{sym:<8} Error: {e}")

Add alerts when a symbol crosses its gamma flip, approaches a wall, or when net GEX flips sign. These regime transitions are the highest-signal events.

MCP Integration for AI Agents

Connect FlashAlpha to Claude, Cursor, or any MCP-compatible agent:

{
  "mcpServers": {
    "flashalpha": {
      "url": "https://lab.flashalpha.com/mcp",
      "headers": {
        "X-Api-Key": "YOUR_KEY"
      }
    }
  }
}

Ask the agent: “What’s the gamma flip for SPY?” or “Is TSLA in positive or negative gamma?” or “Build me a multi-symbol GEX scanner.” The agent calls the endpoints directly, interprets the data, and presents analysis. The AI becomes the dashboard.

Why Not Compute GEX Yourself?

You can. Here’s the shopping list:

  1. Options chain data source ($200-2,500/mo)
  2. OI aggregation across all expirations, handling weeklies/monthlies/quarterlies/LEAPs
  3. Dealer model assumptions (what fraction of OI is dealer-held)
  4. Dollar gamma computation per strike (BSM or better, needs IV, rates, dividends)
  5. Gamma flip detection (interpolate where cumulative net GEX crosses zero)
  6. Key level identification (call walls, put walls, highest OI, 0DTE magnets)
  7. Higher-order Greeks (delta, vanna, charm exposure — each a substantial computation)
  8. Infrastructure to run intraday for your universe

That’s 3-6 months of engineering. The exposure endpoints exist so you don’t have to.

API Reference

GET /v1/exposure/gex/{symbol}        # Per-strike gamma exposure
GET /v1/exposure/gex/{symbol}?expiration=2026-03-30  # Filter by expiry
GET /v1/exposure/levels/{symbol}     # Key levels (flip, walls, magnets)
GET /v1/exposure/summary/{symbol}    # Regime + interpretation (Growth)
GET /v1/exposure/dex/{symbol}        # Delta exposure
GET /v1/exposure/vex/{symbol}        # Vanna exposure
GET /v1/exposure/chex/{symbol}       # Charm exposure

Headers:
  X-Api-Key: YOUR_KEY

Rate limits:
  Free:   10 req/day
  Basic:  250 req/day
  Growth: 2,500 req/day
  Alpha:  Unlimited

Related guides:

Update and Maintain Resources in Azure – Control Storage Access

In this section, we’ll work through a series of tasks focused on managing an Azure Storage Account and its key components.
Note: This builds on the project covered in my previous article.

Scenario

An Azure administrator wants to deepen your understanding of storage accounts, containers, and file shares. As the need to share files continues to grow, they’re looking for someone confident in handling these services. Your task is to create a storage container, set up a file share, and upload files to both.

Create a Storage Container

Start by navigating to the Storage Account page and selecting the storage account you created in the previous “Prepare” exercise.

storage account

  • On the storage account blade, under the Data storage submenu, select Containers.
  • Select + Add container.

Select + Add container

  • In the Name field, enter storage-container.
  • Select Create.storage-container

storage-container

Upload a file to the storage container

  • Select the storage container you just created.

select storage account

  • Select Upload and upload the file you prepared.

select and open file

  • Once the file is ready for upload, select Upload.

After uploading the file, you’ll see its assigned access tier. Since this file was only uploaded for testing purposes, there’s no need for it to remain in the Hot tier. In the following steps, you’ll update the file’s access tier to a more appropriate option.

Change the Access Tier

  • Select the file you just uploaded (the file name is a barplot.fig).

File name

  • Select Change tier.

Change tier

  • Select Cold.
  • Select Save.

select cold

Note: In this step, you updated the access tier for a specific blob or file. If you want to apply a default access tier across all blobs, you can configure this setting at the storage account level.

Create a File Share

  • Navigate to the Storage Accounts page and choose the storage account you created in the previous Prepare exercise. This should be named marchsa and linked to the guided-project-rg resource group.

  • Within the storage account panel, locate the Data storage section and select File shares.

file shares

  • Select + File share.

select + file share

  • On the Basics tab, in the name field, enter file-share.

file-share

  • On the Backup tab, uncheck Enable backup.

uncheck Enable backup

  • Select Review + create.
  • Select Create.

select create

  • Once the file share is created, select Upload.

select upload

  • Upload the same file you uploaded to the blob storage or a different file, it’s up to you.

upload file

The next step is to determine how to manage access to the uploaded files. Azure offers several methods for controlling file access, such as role-based access control (RBAC). However, in this case, the Azure administrator has requested the use of shared access tokens or keys.

Create a Shared Access Signature (SAS) Token

  • First, open the storage account you set up in the preparation exercise.
  • Then, in the storage account panel, navigate to the Storage browser and expand the Blob containers section.

storage browser

  • Select the storage container you created earlier, storage-container.

storage-container

  • Select the ellipses (three dots) on the end of the line for the image you uploaded.
  • Select Generate SAS.

Generate SAS

Note: When generating a shared access signature (SAS), you must define a validity period. Once this time expires, the link will no longer function. The Start field is automatically filled with the current date and time.

Configure the settings as follows:

  • Set the signing method to Account key.
  • Choose Key 1 as the signing key.
  • Leave the stored access policy set to None.
  • Assign Read permissions.
  • Specify a custom start and expiry time, or keep the default values.
  • Restrict allowed protocols to HTTPS only.

Finally, select Generate SAS token and URL.

generate SAS token

  • Copy the Blob SAS URL and paste it in another window or tab of your browser. It should display the image you uploaded. Keep this tab or window open.

copy and paste blob SAS URL

Once the SAS token is generated, anyone who has the link can access the file for the duration you specified. But managing access isn’t just about granting permissions—it’s also about being able to take them away when needed.

To revoke access granted through a SAS token, you must invalidate it. This is done by rotating the key that was used to create the token.

Rotating access keys:

  • Go to the Storage accounts page and open the storage account you created earlier.
  • Navigate to the Security + networking section.
  • Select Access keys.

select access keys

  • For Key 1, select Rotate key.
  • Read and then acknowledge the warning about regenerating the access key by selecting Yes.

select rotate key

  • After the access key rotation is successful, return to the tab or window where you tested the SAS token and refresh the page. You should now see an authentication failed error, confirming that access has been revoked.

Conclusion

The Control Storage Access exercise highlighted key administrative tasks involved in managing and securing storage resources in Microsoft Azure. It included creating a storage container to organize blob data and adjusting the access tier to balance cost and performance based on how the data is used.

The exercise also covered setting up a file share to support structured storage and collaboration across different systems. To provide secure, temporary access, a Shared Access Signature (SAS) token was generated—allowing delegated access without exposing primary account keys. Additionally, rotating storage access keys demonstrated an important security practice by refreshing credentials and reducing the risk of unauthorized access.

Overall, these steps emphasize the importance of effective storage management, cost efficiency, and strong security measures when working with Azure storage services.

OpenAI neden Sora uygulamasını kapatma kararı aldı?

OpenAI ChatGPT LOG Tasarım

OpenAI ChatGPT LOG TasarımOpenAI, 24 Mart’ta sürpriz bir açıklama yaparak Sora uygulamasını kapatma kararı aldığını duyurdu. Peki bu kararın arkasında tam olarak ne yatıyor? WSJ’nin incelemesine göre uygulama şirkete oldukça büyük maliyetler çıkarmaya başladı. Popülerliğini hızla kaybettiği ve günlük maliyetinin yaklaşık 1 milyon dolar olduğu aktarılan Sora, CEO Sam Altman’ın kararıyla rafa kaldırıldı. Sora’ya ayrılan kaynakları artık daha fazla ihtiyaç duyulan alanlara (örneğin Claude Code ile rekabet sürecine) kaydıracak şirket, Sora için Disney ile yapılan tam 1 milyar dolarlık anlaşmayı da sona erdirdi. We’re saying goodbye to the Sora app. To everyone who created with Sora, shared it, and built community around it: thank you. What you made with Sora mattered, and we know this news is disappointing. We’ll share more soon, including timelines for the app and API and details on… — Sora (@soraofficialapp) March 24, 2026

OpenAI neden Sora uygulamasını kapatma kararı aldı? yazısı ilk olarak Teknoloji haberleri – LOG üzerinde yayınlandı.