Benchmarking LFM2.5-Thinking on GSM8k (early result)

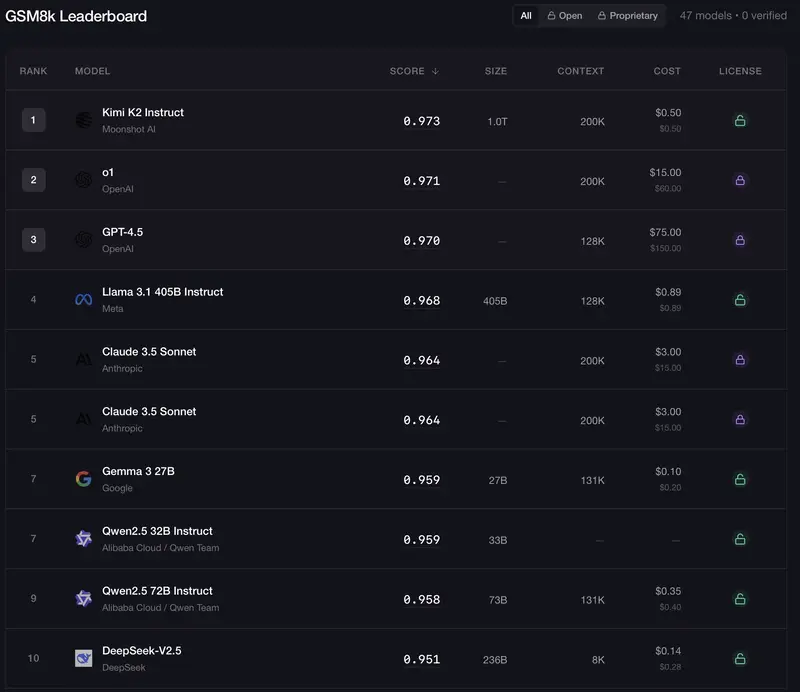
Top 10 Leaderboard

I have a secret passion for LFM2.5-Thinking. It’s tiny 1.2B, it’s fast, it’s a reasoning model, and it’s good. Really good.

My tests are still in progress. All i can do is share some early results. I use the public GSM8k dataset, but with my own benchmarking scripts.

What is the GSM8k benchmark?

Grade School Math 8K, a dataset of 8.5K high-quality linguistically diverse grade school math word problems requiring multi-step reasoning and elementary arithmetic operations.

The Top 10 Leaderboard in 2026, up to 97%. Take note of the massive context size.

Top 10 Leaderboard

And this what “State of the Art” results looked like in 2021, barely 35%.

SOTA GSM8k in 2021

Some early results

Questions: 1319 (test)
Context sizes to test: [1000, 2000, 3000, 4000, 5000, 6000, 7000]
Endpoint: http://192.168.1.110:8000 / lfm2.5-thinking

=== max_tokens=1000 ===
  [200/1319] acc=135/200 (67.5%) rate=3.9q/s
  [400/1319] acc=251/400 (62.8%) rate=4.6q/s
  [600/1319] acc=387/600 (64.5%) rate=5.0q/s
  [800/1319] acc=512/800 (64.0%) rate=5.1q/s
  [1000/1319] acc=640/1000 (64.0%) rate=5.3q/s
  [1200/1319] acc=771/1200 (64.2%) rate=5.3q/s
  Result: 851/1319 (64.5%) @ 5.48q/s

=== max_tokens=2000 ===
  [200/1319] acc=163/200 (81.5%) rate=2.1q/s
  [400/1319] acc=321/400 (80.2%) rate=2.3q/s
  [600/1319] acc=479/600 (79.8%) rate=2.5q/s
  [800/1319] acc=636/800 (79.5%) rate=2.5q/s
  [1000/1319] acc=791/1000 (79.1%) rate=2.5q/s
  [1200/1319] acc=956/1200 (79.7%) rate=2.6q/s
  Result: 1055/1319 (80.0%) @ 2.63q/s

=== max_tokens=3000 ===
  [200/1319] acc=171/200 (85.5%) rate=1.5q/s
  [400/1319] acc=341/400 (85.2%) rate=1.5q/s
  [600/1319] acc=505/600 (84.2%) rate=1.5q/s
  [800/1319] acc=674/800 (84.2%) rate=1.5q/s
  [1000/1319] acc=836/1000 (83.6%) rate=1.5q/s
  [1200/1319] acc=1008/1200 (84.0%) rate=1.5q/s
  Result: 1113/1319 (84.4%) @ 1.57q/s

=== max_tokens=4000 ===
  [200/1319] acc=175/200 (87.5%) rate=1.1q/s
  [400/1319] acc=348/400 (87.0%) rate=1.1q/s
  [600/1319] acc=517/600 (86.2%) rate=1.1q/s
  [800/1319] acc=683/800 (85.4%) rate=1.1q/s
  [1000/1319] acc=852/1000 (85.2%) rate=1.1q/s
  [1200/1319] acc=1033/1200 (86.1%) rate=1.1q/s
  Result: 1139/1319 (86.4%) @ 1.17q/s

=== max_tokens=5000 ===
  [200/1319] acc=176/200 (88.0%) rate=0.8q/s
  [400/1319] acc=350/400 (87.5%) rate=0.9q/s
  [600/1319] acc=523/600 (87.2%) rate=0.9q/s
  [800/1319] acc=687/800 (85.9%) rate=0.9q/s
  [1000/1319] acc=850/1000 (85.0%) rate=0.9q/s
  [1200/1319] acc=1025/1200 (85.4%) rate=0.9q/s
  Result: 1129/1319 (85.6%) @ 0.93q/s

=== max_tokens=6000 ===
  [200/1319] acc=181/200 (90.5%) rate=0.7q/s
  [400/1319] acc=351/400 (87.8%) rate=0.7q/s
  [600/1319] acc=523/600 (87.2%) rate=0.7q/s
  [800/1319] acc=696/800 (87.0%) rate=0.7q/s
  [1000/1319] acc=863/1000 (86.3%) rate=0.7q/s
  [1200/1319] acc=1048/1200 (87.3%) rate=0.7q/s
  Result: 1153/1319 (87.4%) @ 0.73q/s

=== max_tokens=7000 ===
  [200/1319] acc=172/200 (86.0%) rate=0.5q/s
  [400/1319] acc=346/400 (86.5%) rate=0.6q/s
  [600/1319] acc=520/600 (86.7%) rate=0.6q/s
  [800/1319] acc=683/800 (85.4%) rate=0.6q/s
  [1000/1319] acc=853/1000 (85.3%) rate=0.6q/s
  [1200/1319] acc=1034/1200 (86.2%) rate=0.6q/s
  Result: 1137/1319 (86.2%) @ 0.61q/s

=== Summary ===
max_tokens  accuracy   correct   total    rate
      1000     64.5%       851    1319    5.5
      2000     80.0%      1055    1319    2.6
      3000     84.4%      1113    1319    1.6
      4000     86.4%      1139    1319    1.2
      5000     85.6%      1129    1319    0.9
      6000     87.4%      1153    1319    0.7
      7000     86.2%      1137    1319    0.6

LFM2.5 result

About boxed & fallback. The model is requested to put the result in a “boxed” format, but it sometimes fail to do so. I have some “fallback” parsing to try to extract the answer anyway

I’m not running my full suite, therefore there might be some false negatives here (improper parsing, flag correct result as incorrect).

You’ll hear me saying it at lof time on dev.to, i don’t have enough compute power. Yet, it’s a good rough estimate.

TODO

I need to double check the results, i need to check longer context, i need to check another model, i need to test turboquant, and so much more…

I Tested TurboQuant KV Cache Compression on Consumer GPUs. Here’s What Actually Happened.

I spent this weekend testing TurboQuant KV cache compression on my home lab Kubernetes cluster. The paper (ICLR 2026, Google Research) promises up to 4.57x compression of the KV cache with minimal quality loss. That sounded like exactly what I needed. I’m always bumping up against VRAM limits trying to run larger models or longer contexts on consumer hardware.

Here’s what I found: it works, but there are real tradeoffs nobody’s talking about yet.

The Problem: KV Cache Eats Your VRAM

If you’ve run LLMs locally, you know the drill. You load a 32B model that fits in 20GB of VRAM, set the context to 32K, and suddenly you’re at 28GB. The model weights didn’t change. It’s the KV cache growing linearly with context length.

For every token in the context, the model stores key and value vectors for every attention head at every layer. In FP16, that adds up fast. A 32B model at 32K context can burn through 8+ GB of VRAM just for the KV cache.

TurboQuant’s approach is to apply a Walsh-Hadamard Transform (WHT) rotation to KV cache vectors before quantizing them to 3 bits. The rotation “gaussianizes” the distribution, making scalar quantization much more effective. The result is TQ3_0: roughly 3 bits per element instead of 16, for a theoretical 4.57x compression.

My Setup

Hardware: ShadowStack, my home inference server

  • 2x NVIDIA RTX 5060 Ti (16GB GDDR7 each, 32GB total)
  • AMD Ryzen 9 7900X, 64GB DDR5
  • Ubuntu 24.04, MicroK8s

Software: LLMKube, an open-source Kubernetes operator I built for managing llama.cpp inference workloads. It handles model downloads, GPU scheduling, multi-GPU sharding, health probes, and Prometheus metrics through Kubernetes CRDs.

TurboQuant build: I used the animehacker/llama-turboquant fork, which has working CUDA kernels for the WHT-based TQ3_0 type. This is a Stage 1 implementation (no QJL residual correction from the full paper). I built it with Kaniko directly on my cluster targeting SM 86 (Ampere) and SM 120 (Blackwell).

The Wrapper Entrypoint Pattern

LLMKube’s InferenceService CRD doesn’t have a --cache-type flag yet, so I built a custom Docker image with a wrapper entrypoint that injects the TurboQuant flags transparently:

#!/bin/bash
# entrypoint.sh - passes through all LLMKube args, appends TQ flags
TQ_CACHE_TYPE="${TQ_CACHE_TYPE:-tq3_0}"
TQ_ENABLED="${TQ_ENABLED:-true}"

if [ "${TQ_ENABLED}" = "true" ]; then
    exec llama-server "$@" --cache-type-k "${TQ_CACHE_TYPE}" --cache-type-v "${TQ_CACHE_TYPE}"
else
    exec llama-server "$@"
fi

Using exec is important. It makes llama-server PID 1 so Kubernetes health probes and signal handling work correctly.

Benchmark Methodology

Apples-to-apples. Same model weights, same context size, same concurrency. The only variable was the KV cache type (FP16 vs TQ3_0). Flash attention was enabled for all tests.

Throughput test: 5 minutes of sustained load at 4 concurrent requests, 8K context.

Context sweep: Deploy at each context size (4K through 131K), run a 2-minute stress test, record VRAM via nvidia-smi.

Models tested:

  • Llama 3.1 8B (Q5_K_M), small model with lots of headroom
  • Qwen 2.5 14B (Q5_K_M), medium model that fills one GPU
  • Qwen 2.5 32B (Q4_K_M), large model that requires both GPUs

Results: Throughput

This is where TurboQuant hurts.

Model Variant Gen tok/s Prompt tok/s Requests (5min)
Llama 8B FP16 cache 50.0 565.5 771
Llama 8B TQ3_0 cache 8.4 93.4 74
Qwen 14B FP16 cache 28.1 122.0 128
Qwen 14B TQ3_0 cache 5.3 63.4 53
Qwen 32B FP16 cache 14.3 133.3 108
Qwen 32B TQ3_0 cache 5.5 85.5 53

Generation throughput dropped 5-6x across all models. Prompt processing dropped roughly 2-6x depending on model size. This is consistent with what the PR benchmarks showed on CPU, but I expected Blackwell’s tensor cores to help more than they did. The animehacker CUDA kernels were optimized for Ampere (SM 86), not Blackwell (SM 120), so there’s likely performance left on the table.

Results: VRAM Usage

This is where it gets interesting.

Llama 3.1 8B, Context Sweep

Context FP16 VRAM (total) TQ3_0 VRAM (total) Savings
4K 6.4 GB 10.1 GB -58% (worse)
8K 6.9 GB 14.3 GB -107% (worse)
16K 8.0 GB 22.8 GB -185% (worse)
32K 10.1 GB 6.9 GB 31% better
65K 14.3 GB 8.4 GB 41% better
98K 18.5 GB 9.8 GB 47% better
131K 22.7 GB 11.2 GB 51% better

Qwen 2.5 14B, Context Sweep

Context FP16 VRAM (total) TQ3_0 VRAM (total) Savings
4K 11.1 GB 16.7 GB -50% (worse)
8K 11.9 GB 23.0 GB -93% (worse)
16K 13.4 GB 11.0 GB 18% better
32K 16.6 GB 11.8 GB 29% better
65K 22.8 GB 13.7 GB 40% better

Qwen 2.5 32B, Context Sweep

Context FP16 VRAM (total) TQ3_0 VRAM (total) Savings
2K 19.9 GB 23.7 GB -19% (worse)
4K 20.5 GB 27.9 GB -36% (worse)
8K 21.6 GB 19.8 GB 8% better
16K 23.7 GB 20.3 GB 14% better
32K 28.0 GB 21.4 GB 24% better

The Surprise: TQ Uses MORE VRAM at Small Contexts

I wasn’t expecting this. At 4K-16K context, TQ3_0 consistently used more VRAM than the FP16 baseline. Sometimes dramatically more. Llama 8B at 16K context used 22.8 GB with TQ vs 8.0 GB with FP16.

My theory: the WHT rotation machinery has a fixed overhead (lookup tables, rotation matrices, codebooks) that gets allocated regardless of context size. When the KV cache is small, this overhead dwarfs the compression savings. The crossover point where TQ starts winning varies by model:

  • Llama 8B: around 32K context
  • Qwen 14B: around 16K context
  • Qwen 32B: around 8K context

Larger models cross over earlier because their per-token KV cache is larger (more layers, more attention heads), so the compression pays off sooner.

When Is TurboQuant Worth It?

Use TQ3_0 when:

  • You need 32K+ context on consumer GPUs
  • You’re hitting VRAM limits and can’t afford more hardware
  • Throughput isn’t critical (batch processing, RAG with long documents, analysis tasks)
  • You’re running a large model (32B+) where the crossover point is lower

Don’t use TQ3_0 when:

  • Context is under 16K (you’ll actually use more VRAM)
  • You need interactive throughput (the 5x penalty makes chat unusable)
  • You’re on Blackwell and want optimal performance (wait for SM 120-optimized kernels)

The sweet spot in my testing was Qwen 32B at 32K context. Baseline uses 28 GB, which is dangerously close to my 32 GB ceiling. One concurrent request could OOM. TQ drops it to 21.4 GB, leaving over 10 GB of headroom for parallel slots or longer contexts.

What’s Next

The throughput penalty is the main blocker. The animehacker CUDA kernels use a fused MMVQ approach that avoids dequantization during attention, but the WHT butterfly transform still runs 160 integer ops per element in registers. On Blackwell with its new SM architecture, these kernels likely aren’t hitting optimal occupancy.

Things I’m watching:

  • PR #21089 on ggml-org/llama.cpp, the only open upstream PR for TurboQuant (CPU-only for now)
  • Whether ggerganov engages with it. If he requests changes rather than closing, it’ll eventually land.
  • SM 120-optimized CUDA kernels. Blackwell has new instructions that could close the throughput gap.

For LLMKube, I’m planning to add cacheTypeK and cacheTypeV fields to the InferenceService CRD so users can configure this without the wrapper entrypoint hack. Also an extraArgs escape hatch for any llama.cpp flag we don’t have a typed field for yet.

Try It Yourself

All the benchmarking infrastructure is in the LLMKube repo. The operator is open source (Apache 2.0) and handles the full lifecycle: model downloads, GPU scheduling, multi-GPU sharding, health probes, and Prometheus metrics. If you have a GPU cluster and want to test TurboQuant:

  1. Build the custom image from animehacker/llama-turboquant with -DGGML_CUDA=ON
  2. Set spec.image on your InferenceService to point at it
  3. The wrapper entrypoint handles the rest

If you run these benchmarks on different hardware (A100, RTX 3090, etc.), I’d love to see the numbers. Drop a comment or find me on the LLMKube Discord.

Benchmarks run on 2026-03-30 on ShadowStack (2x RTX 5060 Ti, 32GB VRAM, Blackwell SM 12.0, CUDA 13.0).

Serverless applications on AWS with Lambda using Java 25, API Gateway and DynamoDB – Part 3 Introducing Lambda SnapStart

Introduction

In part 1, we introduced our sample application. In part 2, we measured the performance (cold and warm start times) of the Lambda function without any optimizations. We observed quite a large cold start time. In this article, we’ll introduce AWS Lambda SnapStart as one of the approaches to reducing the cold start times of the Lambda function. We’ll also provide the cold and warm start measurements of the sample application when the SnapStart is enabled for the Lambda function.

AWS Lambda SnapStart

As we saw in part 2, without any optimizations, Lambda performance measurements showed quite high values, especially for the cold start times. The article Understanding the Lambda execution environment lifecycle provides a good overview of this topic. Lambda SnapStart is one of the optimization approaches to reduce the cold start times.

Lambda SnapStart can provide a start time of a Lambda function of less than one second. SnapStart simplifies the development of responsive and scalable applications without provisioning resources or implementing complex performance optimizations.

The largest portion of startup latency (often referred to as cold start time) is the time Lambda spends initializing the function, which includes loading the function code, starting the runtime, and initializing the function code. With SnapStart, Lambda initializes our function when we publish a function version. Lambda takes a Firecracker microVM snapshot of the memory and disk state of the initialized execution environment. Then it encrypts the snapshot and intelligently caches it to optimize retrieval latency.

To ensure reliability, Lambda manages multiple copies of each snapshot. Lambda automatically patches snapshots and their copies with the latest runtime and security updates. When we invoke the function version, Lambda restores a new execution environment from the cached snapshot, instead of initializing it from scratch, which improves startup latency. You can find more information about the Lambda SnapStart in the article Reducing Java cold starts on AWS Lambda functions with SnapStart. You can also read about the internals of the SnapStart in the article Under the hood: how AWS Lambda SnapStart optimizes function startup latency. I have published the whole series about Lambda SnapStart for Java applications.

Measurements of cold and warm start times of the Lambda function of the sample application

We’ll reuse the sample application from part 1 and do exactly the same performance measurement as we described in part 2. We’ll measure the performance of the GetProductByIdJava25WithDynamoDB Lambda function mapped to the GetProductByIdHandler. We will trigger it by invoking curl -H “X-API-Key: a6ZbcDefQW12BN56WEVDDB25” https://{$API_GATEWAY_URL}/prod/products/1.

One important aspect is that we instantiate Jackson ObjectMapper and ProductDao directly in the static initializer block of the GetProductByIdHandler Lambda function:

public class GetProductByIdHandler
        implements RequestHandler<APIGatewayProxyRequestEvent, APIGatewayProxyResponseEvent> {

private static final ObjectMapper objectMapper = new ObjectMapper();
private static final ProductDao productDao= new ProductDao();
...

When you create an ObjectMapper for the first time, it initializes a lot of other classes. As a part of this process, it instantiates a lot of singletons. It takes, depending on the hardware, more than a hundred milliseconds. If you create the second ObjectMapper in the same Java process, it takes only 1 millisecond because all the singletons are already there.  By moving the ObjectMapper instantiation to the static initializer block of the Lambda function, we decrease the cold start time. The reason for that is that this initialized object becomes a part of the SnapStart snapshot.

The same is true for ProductDao, especially taking into account that we directly create the instance of the DynamoDbClient there:

public class ProductDao {

private static final DynamoDbClient dynamoDbClient = DynamoDbClient.builder()
  .credentialsProvider(DefaultCredentialsProvider.builder().build())
  .region(Region.of(REGION.toLowerCase()))
  .overrideConfiguration(ClientOverrideConfiguration.builder().build())
  .build();
....

This, in turn, loads a lot of classes, which also become a part of the SnapStart snapshot.

Also, please make sure that we have enabled Lambda SnapStart in template.yaml as shown below:

Globals:
  Function:
    Handler: 
    SnapStart:
      ApplyOn: PublishedVersions 
    ....
    Environment:
      Variables:
        JAVA_TOOL_OPTIONS: "-XX:+TieredCompilation -XX:TieredStopAtLevel=1"

Please note that I measured only the performance of the Lambda function. On top of that comes also the latency of the trigger – in our case, the API Gateway REST API.

Please also note the effect of the Lambda SnapStart snapshot tiered cache. This means that in the case of SnapStart activation, we get the largest cold starts during the first measurements. Due to the tiered cache, the subsequent cold starts will have lower values. For more details about the technical implementation of AWS SnapStart and its tiered cache, I refer you to the presentation by Mike Danilov: “AWS Lambda Under the Hood” and already mentioned article Under the hood: how AWS Lambda SnapStart optimizes function startup latency. Therefore, I will present the Lambda performance measurements with SnapStart being activated for all approx. 100 cold start times (labelled as all in the table), but also for the last approx. 70 (labelled as last 70 in the table), so that the effect of the snapshot tiered cache becomes visible to you. Depending on how often the respective Lambda function is updated and thus some layers of the cache are invalidated, a Lambda function can experience thousands or tens of thousands of cold starts during its life cycle, so that the first longer-lasting cold starts no longer carry much weight.

To show the impact of the SnapStart, we’ll also present the Lambda performance measurements without SnapStart being activated from part 2.

I did the measurements with java:25.v19 Amazon Corretto version, and the deployed artifact size of this application was 13.796 KB.

Cold (c) and warm (w) start time with -XX:+TieredCompilation -XX:TieredStopAtLevel=1 compilation in ms:

Approach c p50 c p75 c p90 c p99 c p99.9 c max w p50 w p75 w p90 w p99 w p99.9 w max
No SnapStart enabled 3800 3967 4183 4411 4495 4499 5.55 6.15 7.00 12.18 56.37 4000
SnapStart enabled but no priming applied, all 2294 2366 3530 3547 3548 3551 5.68 6.30 7.33 13.43 44.74 2923
SnapStart enabled but no priming applied, last 70 2247 2324 2389 2637 2637 2637 5.68 6.35 7.39 13.65 44.03 2051

Conclusion

In this article of the series, we introduced AWS Lambda SnapStart as one of the approaches to reduce the cold start times of the Lambda function. We observed that by enabling the SnapStart on the Lambda function, the cold start time goes down. It’s especially noticeable when looking at the “last 70” measurements with the snapshot tiered cache effect. But still, the cold start remains quite high. In the next article, we’ll explore the first Lambda SnapStart priming technique. I call it the database (in our case, DynamoDB) request priming. The goal of applying priming is to preload and preinitialize as much as possible in the SnapStart snapshot during the deployment phase. With that, all those things will already be available directly after the SnapStart snapshot restore.

Please also watch out for another series where I use a relational serverless Amazon Aurora DSQL database and additionally the Hibernate ORM framework instead of DynamoDB to do the same Lambda performance measurements.

If you like my content, please follow me on GitHub and give my repositories a star!

Please also check out my website for more technical content and upcoming public speaking activities.

How I Designed a Real-Time Dashboard Using Kafka, Socket.IO, and a BFF

GitHub logo

A practical breakdown of the architecture decisions, trade-offs, and frontend/backend boundaries behind Flux — an event-driven real-time dashboard platform I built.

When I started building Flux, I didn’t want to build just another dashboard.

I wanted to build something that actually felt like a real-time system.

  • Not a frontend that keeps polling every few seconds.
  • Not a UI that directly calls five different APIs.
  • Not a project where everything works only when the happy path works.

I wanted something closer to how production systems are usually designed:

  • multiple data domains
  • asynchronous communication
  • real-time delivery
  • graceful degradation
  • and a frontend that stays simple even when the backend gets more complex

So this post is a breakdown of how I designed the architecture for Flux — and more importantly, why I made the decisions I made.

What Flux actually is

Flux is a real-time dashboard that streams and displays:

  • Weather
  • News
  • Stocks
  • Crypto

At first glance, it looks like a frontend-heavy project.

But the interesting part is actually the backend architecture.

Because the real problem wasn’t:

“How do I render cards on a dashboard?”

The real problem was:

“How do I design a system that can ingest, process, and push multiple real-time data streams to clients cleanly?”

That changed everything.

The first architecture I didn’t want

The most obvious way to build this would have been something like this:

Frontend
 ├── calls weather API
 ├── calls news API
 ├── calls stocks API
 └── calls crypto API

This works for a small demo.

But I expected that approach to become painful pretty quickly.

Why I avoided that approach

Because the frontend would slowly become responsible for things it should not own:

  • request orchestration
  • retries
  • service-specific logic
  • failure handling
  • data normalization
  • caching decisions
  • reconnect behavior

That’s how “simple dashboards” become messy.

And honestly, this was one of the main design lines I kept repeating to myself while building this:

I wanted the frontend to stay thin and focused.

Meaning:

  • render data
  • send user intent
  • keep a real-time connection alive

That’s it.

The architecture I settled on

I ended up designing Flux around 3 main layers:

Frontend (Web UI)
 │
 ▼
BFF (Socket.IO + Cache + Kafka coordination)
 │
 ▼
Domain Services (Kafka-based)

This became the core mental model of the whole project.

Each layer has one job.

And once I locked that in, the rest of the system became much easier to reason about.

1) Frontend: thin, reactive, and intentionally limited

The frontend in Flux is intentionally thin and focused.

That was a design choice, not a shortcut.

Its job is to:

  • open a persistent Socket.IO connection
  • send user context (like location)
  • subscribe to real-time updates
  • render whatever arrives

Its job is not to:

  • talk to Kafka
  • call backend services directly
  • aggregate data
  • implement retry policies
  • decide caching behavior

That separation made the frontend much cleaner.

Why this mattered

Because when frontend code starts knowing too much about backend infrastructure, everything becomes harder:

  • harder to debug
  • harder to test
  • harder to scale
  • harder to change later

So in Flux, the frontend only talks to one thing:

the BFF

That one decision removed a lot of future complexity.

2) Why I used a BFF instead of exposing services directly

This was probably the most important architecture decision in the whole project.

I introduced a Backend-for-Frontend (BFF) layer between the UI and the backend services.

What the BFF does

The BFF is responsible for:

  • maintaining client Socket.IO connections
  • receiving events from backend services
  • hydrating reconnecting clients quickly
  • deciding what data to fan out to which users
  • acting as the real-time gateway of the system

So instead of this:

Frontend → many services

I made it:

Frontend → BFF → services

On paper that sounds small.

In practice, it changed a lot.

Why I liked this model

Because the frontend now has:

  • one connection model
  • one integration boundary
  • one real-time contract

And the backend can evolve without breaking the UI every time.

That gave me a much better separation between:

  • presentation concerns
  • system concerns

Which is exactly what I wanted from the start.

3) Why I used Kafka in the middle

Once I knew I wanted multiple real-time domains, I also knew I didn’t want everything tightly coupled.

If weather updates, crypto updates, stock updates, and news updates all depend directly on each other — or on one giant central service — that becomes painful fast.

So I used Kafka as the backbone.

What Kafka gave me

Kafka helped me design the system around events, not direct service-to-service coupling.

That gave me a few nice properties:

  • services can evolve independently
  • producers and consumers don’t need to know too much about each other
  • scaling one domain doesn’t force scaling everything
  • the architecture feels much closer to real production systems

That was important to me.

Because I didn’t want Flux to be a project optimized more for presentation than for system trade-offs.

I wanted it to feel like something that was designed with actual backend trade-offs in mind.

4) Why I chose Socket.IO for real-time delivery

For the client-facing real-time layer, I chose Socket.IO.

And yes — I know raw WebSockets are often the more low-level answer on paper.

But for this project, I cared more about reliability and developer ergonomics than sounding low-level.

Why Socket.IO made sense here

It gave me:

  • automatic reconnection
  • fallback transport support
  • room-based fan-out
  • simpler event semantics
  • less boilerplate for real-time client communication

That mattered because Flux is not just:

“send one stream to one client”

It’s a multi-stream dashboard with different categories of data and different update patterns.

So having a stable, practical abstraction here was worth it.

Sometimes “more production-realistic” is not about choosing the lowest-level primitive.

Sometimes it’s about choosing the thing you can operate more reliably.

5) The problem I ran into: reconnects and hydration

This is where the architecture got more interesting.

Real-time apps are not just about live streaming.

They’re also about:

“What happens when a user reconnects?”

That question forced me to think beyond just pushing events.

Because if a user refreshes the page or reconnects after a network blip, I don’t want them staring at an empty dashboard waiting for all streams to naturally update again.

That creates a poor reconnect experience.

So I split the system mentally into two kinds of data:

A) Snapshot data

Data that should be shown immediately on reconnect

Examples:

  • top news
  • weather snapshot
  • top crypto coins
  • stock summaries

B) Stream data

Data that should continue flowing live

Examples:

  • ticker updates
  • incremental changes
  • fast-moving live events

That separation ended up being very useful.

Because it let me design hydration and streaming differently instead of pretending all real-time data behaves the same way.

And honestly, that was one of the cleanest architecture decisions in the project.

6) Why I added cache, but made it optional

Once I started thinking about reconnect hydration, cache became the obvious next step.

But I also didn’t want to build a system that completely dies if cache is unavailable.

So I used Valkey (open-source Redis fork) as an optional accelerator, not as a hard dependency.

That distinction mattered a lot.

Why “optional cache” was important

Cache is amazing for:

  • fast reconnect hydration
  • reducing repeated work
  • serving recent snapshot data quickly

But I didn’t want Flux to become:

“works only if every dependency is healthy”

So I designed it with this mindset:

  • if cache is available → great, faster experience
  • if cache is unavailable → system should still keep working

That’s a small detail, but it changes how resilient the system feels.

And personally, I’ve started appreciating this design style a lot more:

Acceleration should not become fragility.

7) One of the subtle problems: selective fan-out

Once I had a BFF pushing real-time data, I ran into another question:

“Should every client receive every event?”

In practice, the answer is no.

That would:

  • waste bandwidth
  • add unnecessary frontend filtering
  • generally be inefficient

So I used Socket.IO rooms to scope event delivery.

That meant I could think in terms like:

  • weather by city
  • global news stream
  • crypto stream
  • stock stream

This helped keep the fan-out more intentional instead of just:

“broadcast everything and let the client figure it out”

That’s one of those things that sounds small when you say it in one sentence, but it makes the architecture much cleaner.

8) One frontend decision I’m glad I didn’t stay stubborn about

Initially, I was trying to keep the frontend very clean:

  • hooks handle data and subscriptions
  • components just render UI

And for the most part, that worked well.

Each domain had its own hook:

  • weather
  • news
  • stocks
  • crypto

So the general rule was simple:

Hooks deal with real-time logic. Components stay simple.

That kept things pretty clean.

But then I ran into a small UX problem

In the Crypto card, I had two tabs:

  • Top Movers
  • Live Ticker

And every time I switched between them, I didn’t like what I was seeing.

Some data in the Crypto card would reload again, and state didn’t feel stable across tab switches.

The UI didn’t feel as smooth as I wanted.

Nothing was actually broken.

It just didn’t feel good.

And I’ve started trusting that feeling more while building projects.

Because a lot of times, architecture looks clean in code but feels annoying in the actual product.

So this is where I bent my own rule a bit

Instead of forcing everything through local hook state, I used Redux selectively for the crypto section.

Not across the whole app.

Just where it actually helped.

Mainly to keep things like:

  • ticker data
  • top coins data
  • price-related state

stable across tab switches.

The pattern that felt right was:

  • hooks handle subscriptions and incoming socket events
  • Redux keeps shared UI state stable where needed
  • components just read and render

That ended up feeling much better.

Why I’m glad I did this

Because this was one of those cases where:

being too “architecturally pure” would have made the user experience worse.

And honestly, I’d rather have a slightly more practical architecture than a “perfectly clean” one that adds unnecessary friction to the user experience.

That small change made the Crypto card feel way smoother.

And I think that’s a useful reminder in general:

Sometimes the right architecture decision is just the one that makes the product feel better.

9) Failure isolation was not an afterthought

One thing I really wanted in Flux was this:

If one stream fails, the dashboard should still feel alive.

So I designed the UI and backend with failure isolation in mind.

Meaning:

  • if weather is delayed → crypto still updates
  • if news fails → stocks still render
  • if one service lags → the whole app shouldn’t feel dead

That sounds like a UX decision, but it’s actually an architecture decision too.

Because if your system shape forces everything to depend on everything else, then partial failure becomes full failure.

And I wanted to avoid that.

A real-time system should degrade, not collapse.

10) I intentionally did not chase “perfect distributed systems purity”

This was a very conscious choice.

Because once you start building event-driven systems, it’s very easy to go down the rabbit hole of:

  • exactly-once everything
  • over-engineered delivery guarantees
  • too many abstractions too early
  • adding architectural complexity that doesn’t meaningfully improve the system

I tried hard not to do that.

So Flux is opinionated in a practical way.

I optimized for:

  • clarity
  • resilience
  • clean boundaries
  • realistic trade-offs

Not unnecessary complexity.

That was important to me because I wanted this project to reflect how I actually think as an engineer:

I like systems that are thoughtful, not just complicated.

Final architecture summary

If I had to describe Flux’s architecture in one sentence, I’d say:

It’s a real-time dashboard designed like a small event-driven platform, not like a frontend project with extra backend code attached.

That’s the difference I cared about.

The main ideas behind the design were:

  • keep the frontend thin
  • centralize real-time delivery in a BFF
  • use Kafka for loose coupling
  • use Socket.IO for practical real-time delivery
  • separate snapshot hydration from live streams
  • use cache as an accelerator, not a crutch
  • isolate failures so the whole app doesn’t feel broken

And honestly, designing those boundaries was way more interesting than building the UI itself.

What I learned from building this

If I had to compress the biggest lesson into one line:

Most architecture problems become easier once each layer has one clear responsibility.

A lot of messy systems are messy because responsibilities are blurry.

Flux became much easier to build once I stopped asking:

“How do I make everything talk to everything?”

…and started asking:

“What is each layer allowed to know?”

That single shift made the architecture cleaner.

If you’re building a real-time dashboard too

A few things I’d strongly recommend:

  • Don’t let the frontend talk to too many things directly.
  • Decide early what is snapshot data vs stream data.
  • Design for reconnects, not just the initial page load.
  • Think about partial failure early.
  • Keep boundaries boring and explicit.

That alone will save you a lot of pain later.

Final thoughts

If you’ve built something similar — or if you would have designed this differently — I’d genuinely love to hear your approach.

I always find architecture discussions more useful when they’re about trade-offs as well as best practices.

GitHub logo

kaustubh-26
/
flux-platform

An event-driven real-time data platform

Flux Platform

Flux — An event-driven real-time data platform

Build
Tests
Deploy
License

Live Demo: https://flux.kaustubhalandkar.workers.dev

A production-style, event-driven real-time data platform showcasing modern Kafka-based streaming, WebSocket fan-out, and a clean Backend-for-Frontend (BFF) architecture.

This repository is intentionally built as a portfolio-grade, open-source system that mirrors how real-world, streaming data platforms are designed, operated, and documented.

🖥️ Live Dashboard Preview

📱 Mobile View

✨ What This Project Demonstrates

  • Event-driven microservices using Kafka
  • A resilient BFF layer for real-time fan-out
  • Socket.IO–based client streaming
  • Cache-accelerated hydration with graceful degradation
  • Idempotency & deduplication patterns
  • Structured logging & observability
  • Self-healing Kafka connectivity
  • Clean, scalable monorepo organization

The project emphasizes real-world system design concerns such as event-driven communication, failure handling, and scalability.

🧠 High-Level Architecture

┌──────────────────────┐
│        Client        │
│  Browser / Mobile    │
└─────────▲────────────┘
          │ Socket.IO (real-time)
┌─────────┴──────────────┐
│   Backend-for-Frontend │
│          (BFF)         │
│  - Socket.IO Server    │
│  - Kafka Producer      │

…

AI Is Not Your Intern. And That’s the Problem.

When I first started using coding agents seriously, I made a familiar mistake.

I treated the model as the main thing.

I wrote better prompts. Then longer ones. Then, more carefully structured ones.

Sometimes it worked beautifully.

Sometimes it drifted.

Same repo. Same goal. Different result.

That inconsistency bothered me, because it revealed something deeper:

The bottleneck was not raw intelligence.

It was context.

In AI Is Not Replacing You. It’s Reshaping How You Think, I wrote about how AI shifts the bottleneck upward. When generation becomes cheap, the differentiator becomes judgment, constraints, and systems thinking.

That same pattern shows up in agentic engineering.

The real leverage does not come from asking a model to do more.

It comes from designing a better system around the model.

The Mistake I Kept Making

Early on, I was treating the agent like a very smart freelancer with amnesia.

I would drop it into a task, explain the problem, and expect one well-written instruction block to carry the entire interaction.

Sometimes it did.

But as soon as the work became real, things broke down.

Design fidelity mattered.

SEO mattered.

Content structure mattered.

Localisation mattered.

Existing conventions mattered.

Small decisions from earlier in the build mattered.

One prompt was never going to carry all of that.

That’s when it clicked:

Agentic engineering is not prompting.

It’s environment design.

On a recent workflow, I wasn’t asking an agent to “build a website.”

I was asking it to:

  • work inside a multilingual Astro codebase
  • preserve structured SEO
  • keep markdown content editable
  • support Arabic RTL layouts
  • respect project-specific rules already established
  • generate UI directions using Stitch
  • interact with external tools through MCP integrations

That’s not a prompt problem.

That’s a context problem.

And context has to be layered.

If the model is the engine, skills are the practised moves, MCPs are the ports to the outside world, and AGENTS.md is the field manual for the project.

Once I started seeing the stack this way, everything became more stable.

Skills Are Reusable Judgment

The clearest explanations of skills come from:

The idea is simple:

A skill packages repeatable expertise into something an agent can reuse.

That matters because prompts are temporary.

Skills are accumulated judgment.

Instead of re-explaining how to:

  • audit SEO
  • structure content
  • apply system constraints

…you encode it once.

Now every task starts from a higher baseline.

In practice, skills do three things:

  • reduce repetition
  • reduce drift
  • make quality portable

That last one is the real shift.

Without skills, success depends on remembering the right phrasing at the right time.

With skills, you turn one-off cleverness into infrastructure.

That’s leverage.

MCPs Give Agents Reach

If skills shape how an agent thinks, MCPs shape what it can do.

The Model Context Protocol is an open standard that connects models to external systems.

Models know patterns.

MCPs let them touch reality.

That reality includes:

  • repositories
  • APIs
  • documentation
  • browsers
  • design tools like Stitch
  • databases
  • internal tools

Without MCPs, an agent is reasoning in isolation.

With MCPs, it can:

  • observe
  • verify
  • act

That’s the difference between generating suggestions and executing work.

AGENTS.md Gives Agents Memory

The part most teams underestimate is memory.

That’s where AGENTS.md comes in.

The simplest way to think about it:

It’s a README for agents.

But unlike a typical README, it captures the operational reality of a project:

  • how the codebase behaves
  • Which commands are safe
  • what constraints must be respected
  • what has already been learned

In one of my workflows, this included things like:

  • why Tailwind must stay locally compiled
  • why English routes remain unprefixed
  • how RTL must be handled
  • what business details must remain consistent

Without this, the agent rediscovers the project every time.

With it, the agent starts from context.

This ties back to something I wrote in Why I Write:

Writing forces clarity.

Good documentation does the same thing for systems.

It turns implicit knowledge into something reusable.

The Agent Is Not the System

This is the part that matters most.

People talk about agentic engineering as if the intelligence lives entirely inside the agent.

It doesn’t.

The agent is just one layer.

What makes the system reliable is the composition:

  • the human provides intent and judgment
  • skills provide reusable expertise
  • MCPs provide access to reality
  • AGENTS.md provides memory
  • the agent executes within that structure

That’s the system.

Recently, I watched a talk by Jacob Bank (ex-Google, founder of Relay.app) that reinforced this perspective:

A few ideas stood out:

  • AI is not your intern
  • managing people becomes less central than designing systems
  • build one simple agent at a time
  • fire agents that don’t deliver
  • clarity of intent is everything
  • your personality becomes the differentiator

That framing aligns closely with what I’ve experienced.

The leverage doesn’t come from one powerful agent.

It comes from how well the system around it is designed.

That’s why I don’t think the future belongs to people who are just good at prompting.

It belongs to people who can design systems of context.

People who can decide:

  • what should be reusable
  • what should be connected
  • what should be constrained
  • what should remain human

In Building Better: Looking Back on 2025, I wrote about building better systems around my life and work.

This is the same instinct.

The goal isn’t to layer AI onto existing habits.

The goal is to redesign the workflow so intelligence has somewhere useful to go.

Agentic engineering is not the art of finding one perfect prompt.

It’s the discipline of building context architecture that makes good work more likely.

That’s where the leverage is.

That’s where the quality comes from.

And that’s where the real craft of this era is being built.

What I’m Exploring Next

This piece is part of a broader exploration into agentic systems.

Next, I’ll be diving deeper into:

  • Model Context Protocol (MCP) and how it actually works in practice
  • Designing skill libraries for real production workflows
  • How to structure agent-first systems in real applications

Further Reading

Lesson learned building AI

This will be a short post.

I toyed with plenty of AI and types of AI. LLM, Reinforcement Learning, Alphazero, from scratch or using large framework, etc

There are a few major key points :

  • If an AI can cheat, it will. It’s a well known behavior since the infancy of AI. It will maximize reward by any means.
  • If there is a bug to exploit, it will find it.
  • Garbage-in, Garbage-out, is greatly underestimated. The quality of an AI is all about the quality of data. Not only for LLM but also for RL.

I’m a DBA, my job is data. But even then, when it comes to AI it’s not a fun job: Data quality is difficult to evaluate and this evaluation is time consuming.

Sanity checklist

If you’re planning to work on AI, here are some things to remember:

  • You’ll never have enough compute power (yes, i repeat it again).
  • You’ll never have enough memory.
  • Make everything resumable. Do not wait the end of a 12h long processing to save outgoing results. Save them asap. (learned the hard way and still manage to forget from time to time)
  • Save everything, do not be cheap on disk space.
  • The more compute & memory you have, the more you’ll use it. Scaling just works.
  • If you’re doing inference and you can send concurrent queries, use vLLM. We’re talking about 100tok/s vs 5000tok/s here. It’s massive. Don’t hesitate to push 64, 128 concurrent queries. It scales until you run out of VRAM.
  • I’ve tested all kinds of platforms. Apple Silicon is amazing and it works. But nothing can beat nVidia yet. The main advantage of Apple Silicon is its competitive price. (I never thought i would ever say that but here we are…)

AI Research

Amateur AI research is a bit like Amateur Astronomy. There are plenty of amateur research to be done, many unexplored spaces, … But it’s expensive to do and whatever result you get will have 0 visibility until someone finds out your work and make a thesis out of it.

And even then, a thesis can stay ignored for months, or years, until some dude in a hyperscaler company stumbles upon it and use it.

Just do whatever pleases you, or whatever you need. Everything else is white noise in an ocean of AI Slop. But i get it, it sure is frustrating when you wake up one morning and find thousands of youtube influencers and AI generated article talking about some “revolution” that you already knew about a year ago.

The Most Beautiful “Ugly” Gift in Tech: Happy Birthday Jean-Baptiste Kempf


Happy Birthday to Jean-Baptiste Kempf, the man who looked at the flashy, over-designed world of media players and decided to give us a traffic cone instead.

As we celebrate the founder of VLC today, let’s address the elephant in the room: VLC is objectively ugly. As Android Police recently reminded us, the interface looks like a time capsule from 2001. It’s gray, it’s clunky, and the menus are a labyrinth of technical jargon. In an era of sleek “Glassmorphism” and “Material You,” VLC remains stubbornly, unapologetically bland.

But here’s the twist: We wouldn’t have it any other way.

While other players “look” premium but choke on a basic MKV file or demand a subscription for 4K playback, Jean-Baptiste’s creation just works. It doesn’t care about your aesthetic preferences; it only cares about your codecs. It is the rugged Swiss Army knife in a world of gold-plated butter knives.

We don’t open VLC to look at the UI. We open it to make the UI disappear so we can actually watch our content.

So, Jean-Baptiste, thank you for focusing on the engine rather than the paint job. Today, we’re raising a glass (and a traffic cone) to the greatest piece of “ugly” software ever written.

What Building a Social Scheduler Taught Me About Reliability

Most automation tools feel impressive right up until you have to trust them.

It is easy to demo a scheduler.

It is much harder to build one that survives real life:

  • expired tokens
  • flaky platform APIs
  • posts that need review
  • queues that drift out of sync
  • failures that happen while you are asleep

That gap changed how I think about automation.

I have been building a project called PostPunk, and I thought the hard part would be generating content and wiring platform APIs together. That turned out to be the easy part.

The real work was operational trust.

A useful scheduler needs a few things that demos usually skip:

1. Approval states matter

Not every post should go straight from draft to published.

Some posts are written by you and are ready immediately. Some are AI-assisted and need a second look. If your system does not distinguish that clearly, you end up either babysitting everything or accidentally posting junk.

So I ended up treating post states as part of the core workflow, not just metadata:

  • draft
  • approved
  • posted
  • failed

That sounds simple, but it changes everything.

2. Failure is not an edge case

In scheduling systems, failure is normal.

A platform token expires.
An API rate-limits you.
A platform changes a field name.
An account is misconfigured.
A browser fallback stops matching the UI.

If the whole system falls apart the moment one target fails, you do not have automation. You have a fragile demo.

So the system needs:

  • retries
  • visible failure states
  • alerts
  • manual assist when automation is not trustworthy

3. Automatic is not the same as unattended

A lot of posting tools sell the dream of full autopilot. In practice, a better model is often:

  • automate what is stable
  • assist where platforms are hostile
  • keep the queue and schedule as the source of truth

That still saves a huge amount of time, and more importantly, it is honest.

4. Scheduling is really an operations problem

The UI part is not enough.

You also need:

  • a worker that checks for due posts
  • logs
  • retry logic
  • success and failure alerts
  • a clear what is due today view

Without those, the schedule is just decorative.

What I learned

The hardest part of automation is not getting software to do something once.

It is getting it to behave predictably enough that you stop worrying about it.

That is the part I care about now.

If you are building internal tools, creator tools, or any kind of scheduler, reliability is the actual feature. Everything else is packaging.

PostPunk is still a project I am actively working on, but building it has made me much less interested in shiny automation promises and much more interested in boring operational trust.

Stop Listening to Dev (or Start Up) Podcasts. They’re Making You Worse.

Most commentators are either a has-been or someone who never made the team. There is great content, thats not the argument here.

It’s not hate. That’s just true. Sports. Music. Business. Tech. The people in the booth talking about the game are not the ones playing it.

If you’re a developer right now spending more time consuming content about building than actually building, you might be sitting in the booth and not realizing it.

This is the tap on the shoulder.

The content trap looks exactly like productivity.

You know the loop.

Open the laptop. Today’s the day. But first, check that Reddit thread about the new framework. Then 20 minutes of a podcast where two guys debate which LLM is better. Then a tutorial you skim, bookmark, and never come back to.

Two hours later your editor is still empty.

But you feel like you did something.

That’s the trap. Your brain got fed technical language and new ideas so it gave you the same reward it would’ve if you actually built something.

You didn’t.

And that gap compounds. Quietly. Over weeks. Over months.

I’m not calling you out. I’ve been in that loop. I’m just telling you what it looks like from the outside.

Nobody buys a ticket to hear the commentators.

I’m from Ottawa, Ontario, Canada. Grew up on hockey.

And every fan knows this instinctively. You don’t go to the game for the broadcast. You go to watch who’s on the ice.

Most dev podcasts. Most AI Twitter threads. Most “10 tools you need” posts. That’s commentary. And commentary has value. But it’s not the game.

If your goal is to build, to ship, to actually play, you need to get on the ice.

Touch the puck. Put your name on a repo. Push something live that could break.

I’m on the ice right now. Player-coach. Still getting hit. Still learning every shift. But the view from inside the game is nothing like the view from the booth.

Talk to devs who are building. That’s happening here on Dev. Get in their comments, ask questions, go to Hackathons, make friends. Watch what they ship. Not what they say.

That’s your peer group. Not the podcasters.

The devs pulling ahead aren’t smarter. They just closed the tab sooner.

Go look at their GitHub profiles. The ones getting hired. Getting funded. Getting noticed.

Their repos aren’t clean. Their READMEs are half done. Their commit messages are gibberish.

That’s what building actually looks like.

They didn’t wait until they felt ready. They started before the tutorial was finished. They asked Grok stuff mid-build. They shipped ugly and fixed it in public.

The gap between them and the dev who “almost started that project” isn’t talent.

It’s the moment they closed the browser and opened the editor.

Backboard shipped major updates last week, looking back at the original, I can’t believe we’re the same company. 🤯

You’re closer to the bleeding edge than you think.

If you’re reading this, you are closer to the frontier of technology than almost everyone on the planet.

The non-technical world is watching AI happen to them. They don’t know what an API is. They don’t know what a context window does. They’re not dumb. They’re just not in this world.

They need people who can build things that work and explain why they matter.

That’s you.

But only if you build.

The risk right now is you stay in the consumption loop long enough that someone who knows less than you but ships faster ends up defining what gets built.

Not because they’re better. Because they started.

The fastest way to learn is to build something that breaks.

Not a course. Not a cert. A project that breaks in public and forces you to fix it.

When you ship something you hit real problems. Not textbook problems. Real dependency conflicts. Real “why is my state disappearing between sessions” moments. Real user feedback that makes you rethink everything.

That’s where learning actually lives.

Every senior dev you look up to got there the same way. Building. Breaking. Fixing. Doing it again while people watched.

If you want to skip the part where you spend two weeks wiring up memory and state before you even touch the thing you want to build, Backboard handles that. Free state for life on signup. Not the point of this article. But it kills one of the quietest excuses I hear from devs who don’t ship: “I’m still setting up infrastructure.”

You don’t need permission. You need a deadline and a publish button.

Pick one thing. One idea you’ve been sitting on.

Give yourself 48 hours. Ship it.

Ugly is fine. Three views is fine. What matters is you broke the loop.

After my last article went viral on here, the DMs I got weren’t asking for resources or reading lists. They were all some version of the same thing:

“I needed someone to tell me to stop overthinking it.”

So here it is again.

Stop overthinking it. Close the tabs. Open your editor. Build the thing.

I’ll see you on the ice.

PS: My one book to recommend that aligns with this post would be Extreme Ownership.