
Claude CLI vs API for Code Review: Same Model, Wildly Different Results
I stopped writing code by hand a while ago. Claude writes it, I review it, it ships. It works, so why should I?
But here’s the thing — if AI writes all the code, who reviews it? Another AI, obviously. So I built brunt, an adversarial code review tool that throws LLMs at your diffs to find bugs and security issues.
The problem is: which AI do you point it at? I have a Claude subscription (CLI access), and I have an API key. Same company, same models. Should give the same results, right? I also gave Ollama a try, didn’t make the cut.
I tested this against a real refactor on my Rust/Axum backend — replacing four old subsystems with a new AI scenarios feature. 20 commits, 77 files, +1,566 / -5,900 lines. I ran brunt three ways:
-
Claude CLI — uses your Claude subscription via
claude -p -
Anthropic API (Sonnet) —
claude-sonnet-4-6via HTTP -
Anthropic API (Opus) —
claude-opus-4-6via HTTP
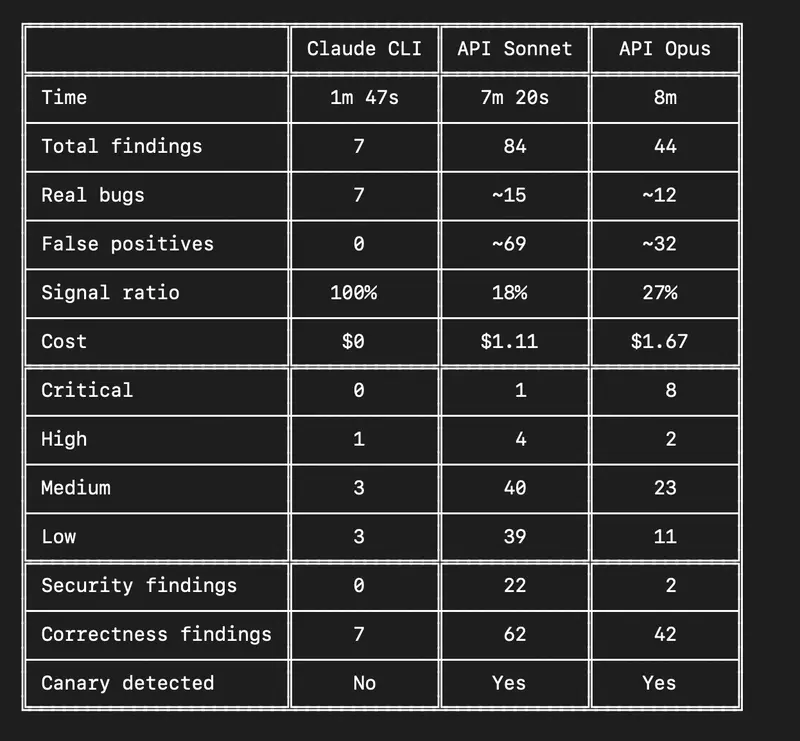
Same diff. Same tool. Same prompts. Wildly different results.
The results

Seven findings vs eighty-four findings. Same model family, same prompts. What happened?
More findings is not better
The CLI run found 7 issues. Every single one was a real, actionable bug. The best catch: a missing .await on an async function call that silently dropped a Future — the scenario trigger would never fire.
// Bug: this creates a Future but never polls it
state.scenario_trigger.on_activity_created(
    user.tenant_id, &activity, &state
);
// Should be:
state.scenario_trigger.on_activity_created(
    user.tenant_id, &activity, &state
).await;
Rust compiles this without error. It just silently does nothing. That is exactly the kind of bug you want an AI reviewer to catch.
Sonnet’s 84 findings included a lot of noise. It flagged bugs in deleted code — code that no longer exists in the codebase. It reported concerns about parameter binding in functions that were entirely removed in the same PR. Technically correct observations about the diff in isolation, but not real bugs.
Opus found 44 issues. Eight were marked critical — but they were all “removed module declaration breaks dependents.” True if you only see one file, false when you realize the dependents were also removed in the same PR. The model couldn’t see across files.
The takeaway: A noisy reviewer that cries wolf on 84 issues trains you to ignore findings. A precise reviewer that surfaces 7 real concerns gets your attention.
The debugging adventure
Before I got these results, I spent an hour (really, an hour?) debugging why the API runs returned zero findings.
The first API run completed in 3 seconds for 75 files and found nothing. That’s suspicious — 75 LLM calls in 3 seconds is physically impossible. Something was silently failing.
Bug 1: Wrong model ID
The config had claude-sonnet-4-6-20250514 as the model. The Claude CLI resolves this alias fine. The Anthropic API does not — it returns 404. Every single API call was failing.
But brunt uses Promise.allSettled to collect per-file results:
const perFileResults = await Promise.allSettled(
  files.map((file) => vector.analyze([file], context, provider))
);
const findings = perFileResults.flatMap((r) =>
  r.status === "fulfilled" ? r.value : []
);
Rejected promises get silently mapped to empty arrays. Zero findings, zero errors shown to the user. The output? “No issues found.” Completely misleading.
Bug 2: No concurrency limiting
The engine fires all 75 files simultaneously as parallel API calls. Per vector, that is 75 concurrent requests. Two vectors = 150 concurrent HTTP requests hitting Anthropic at once.
Result: mass rate limiting (HTTP 429). Same silent failure — all rejected promises dropped.
Bug 3: Output token limit too low
The default max_tokens was 4096. For a file that produces many findings, the response gets truncated mid-JSON. The parser fails. Zero findings.
Bug 4: No retry on rate limiting
The provider threw immediately on any non-200 response. No backoff, no retry. One 429 and the analysis for that file is gone.
All four bugs shared one pattern: the tool silently produced empty results instead of erroring. “No issues found” when the analysis didn’t actually run. This is worse than a crash — it builds false confidence.
The fixes
Concurrency limiting — added a worker pool that limits API calls to 5 at a time:
async function runWithConcurrency<T>(
  tasks: (() => Promise<T>)[],
  concurrency: number
): Promise<PromiseSettledResult<T>[]> {
  const results: PromiseSettledResult<T>[] = new Array(tasks.length);
  let nextIndex = 0;

  async function worker() {
    while (nextIndex < tasks.length) {
      const idx = nextIndex++;
      try {
        results[idx] = { status: "fulfilled", value: await tasks[idx]!() };
      } catch (reason) {
        results[idx] = { status: "rejected", reason };
      }
    }
  }

  const workers = Array.from(
    { length: Math.min(concurrency, tasks.length) },
    () => worker()
  );
  await Promise.all(workers);
  return results;
}
Retry with backoff — exponential backoff on 429/529, respecting retry-after headers:
if (response.status === 429 || response.status === 529) {
  if (attempt === MAX_RETRIES) {
    throw new Error(`API error (${response.status}) after ${MAX_RETRIES} retries`);
  }
  const retryAfter = response.headers.get("retry-after");
  const backoff = retryAfter
    ? parseInt(retryAfter, 10) * 1000
    : INITIAL_BACKOFF_MS * Math.pow(2, attempt);
  await sleep(backoff);
  continue;
}
Bumped max_tokens to 16384 and used correct model IDs (claude-sonnet-4-6, not claude-sonnet-4-6-20250514).
After these fixes, the API runs actually worked — and produced real results.
Non-determinism is real
I ran Claude CLI twice on the same diff. First run: 10 findings, canary detected. Second run: 7 findings, canary missed. That is a 30% variance between identical runs.
Brunt plants a synthetic bug (a “canary”) in the diff and checks if the model catches it. It is a clever reliability signal — if the model misses the canary, results are flagged as potentially unreliable. But the canary itself is non-deterministic. Claude caught it once, missed it the next time.
This means you cannot use a single AI review run as a pass/fail gate. The same code will get different reviews depending on when you run it. If you are building CI pipelines around AI review tools, you need to account for this — run multiple times, take the union of findings, or use a consensus mechanism.
CLI vs API: the real differences
Claude CLI and the Anthropic API can use the same underlying model. But for tool builders, the experience is very different:
| Claude CLI | Anthropic API | |
|---|---|---|
| Rate limiting | Handled for you | Build it yourself |
| Retries | Built in | Build it yourself |
| Model aliases | Work seamlessly | Must use exact model ID |
| Default model | Your subscription tier | Must specify explicitly |
| Cost | Included in subscription | Pay per token (~$1/run) |
| Speed | Slower (subprocess per call) | Faster once infrastructure is right |
| Concurrency | Managed internally | You control it |
The CLI is the easier path. You get rate limiting, retries, model resolution, and a generous context window for free. The API gives you more control but you are responsible for everything — and as I learned, getting “everything” right is harder than it looks.
What the models actually found
Across all runs, here are the real issues that held up to manual review:
-
Missing
.awaiton async call — scenario trigger future silently dropped -
CSV formula injection in data export — unsanitized strings like
=HYPERLINK("http://attacker.com")execute in Excel -
TOCTOU race condition — duplicate scenario executions between
has_pendingcheck andcreate -
Negative LIMIT in SQL —
ListExecutionsQuery.limitaccepts negative values, PostgreSQL treats negative LIMIT as unlimited -
Cursor pagination bug — paginating on non-unique
created_atsilently skips records with identical timestamps - Shutdown signal ignored — 180-second initial sleep blocks graceful shutdown
-
No schema validation on
UpdateAiConfig— accepts arbitrary JSON, downstream code indexes into it blindly
Every one of these is a real bug that a human reviewer might miss. The missing .await is particularly nasty — it compiles, it runs, it just silently does nothing.
Lessons for AI tool builders
1. Fail loudly. “I couldn’t analyze this file” is infinitely better than “I found nothing” when the analysis didn’t run. Silent failures in AI tooling are worse than crashes because they build false confidence.
2. More findings is not better. Optimize for signal-to-noise ratio, not raw count. 7 actionable findings beat 84 noisy ones.
3. Account for non-determinism. LLM outputs vary between runs. If your tool is a CI gate, run it multiple times or implement consensus logic.
4. Per-file analysis has blind spots. Analyzing files independently misses cross-file issues. Consider a hybrid: per-file scan for depth, plus one cross-file summary pass for systemic issues.
5. Test your tool with the actual provider you ship. I had four bugs that only manifested with the API provider because development and testing happened with the CLI. If you support multiple backends, test all of them.
The numbers, one more time
| Claude CLI | API Sonnet | API Opus | |
|---|---|---|---|
| Findings | 7 | 84 | 44 |
| Real bugs | 7 | ~15 | ~12 |
| False positives | 0 | ~69 | ~32 |
| Signal ratio | 100% | ~18% | ~27% |
| Cost | Subscription | $1.11 | $1.67 |
| Time | 1m 47s | 7m 20s | 8m |
The CLI run was the most useful: fastest, cheapest, highest signal. But it analyzed fewer files due to subprocess limits. The API runs were thorough but noisy — they need better filtering to be practical.
The ideal setup might be: CLI for fast feedback in development, API with deduplication and filtering for thorough CI reviews.
This is just a demo and should not be used in production systems, personally I have something similar to test my code but with multiple features whereas this tool is more like a general tool to test the model benchmarks, maybe someone gets an idea or inspiration to try something else in their stack. <— This section was actually written by me.
No models were harmed during the test.
P.S. brunt can also generate failing tests and fixes for the issues that were found, but thats a story for another time, thanks for reading!
The codebase reviewed is a real Rust/Axum backend with multi-tenant isolation, async patterns, and PostgreSQL. All findings shown are from actual brunt runs, not curated or cherry-picked.

 Vivo, kamera performansına odaklanan yeni amiral gemisi modeli X300 Ultra’yı resmen tanıttı. Gelişmiş kamera donanımı ve güçlü işlemcisiyle cihaz neler sunuyor?