Deploying Poorly Packaged Applications with PowerShell and SCCM

In real-world environments, not all enterprise software comes with a proper installer.

Recently, I had to deploy a legacy DLP agent that had:

  • multiple versions across endpoints
  • different ProductCodes
  • the same display name
  • limited documentation
  • and no reliable upgrade path

Trying to handle this using standard logic in Microsoft SCCM (multiple detection rules, MSI-based upgrades, etc.) quickly became messy.

The Approach

Instead of relying on SCCM alone, I moved the logic into a PowerShell-based installer.

The idea is simple:

  • Detect if the application is installed
  • Check the installed version (via ProductCode)
  • Remove anything that doesn’t match the target version
  • Install the correct version with required parameters

In SCCM, the detection method stays clean — it only checks for the new version.

Why This Works Better

  • No need for multiple detection rules
  • No leftover versions after upgrades
  • Full control over install/uninstall logic
  • Works even with poorly packaged or legacy software

Key Idea

Instead of trying to model every scenario inside SCCM, centralize all logic in a script.

This makes deployments more predictable and much easier to maintain.

Full Breakdown

I wrote a detailed step-by-step guide here (including SCCM setup and scripts):

👉 https://www.hiddenobelisk.com/how-to-deploy-poorly-packaged-applications-using-powershell-and-microsoft-sccm/

PUBG: Battlegrounds’tan 1 Nisan’a özel “Dekor Avı” modu

PUBG Battlegrounds

PUBG BattlegroundsKrafton, PUBG: Battlegrounds’un savaş alanlarını eğlenceye boğacak 1 Nisan etkinliği “Dekor Avı”nın bugün başladığını duyurdu. Dekor Avı modunda oyuncular iki role ayrılıyor. Avlar ve Avcılar. Avlar, haritaya dağılmış objelerin kılığına girerek gizleniyor; Avcılar ise alandaki şüpheli her şeyi arayarak süre dolmadan önce tüm obje kılığındaki Avları ortadan kaldırması gerekiyor. Bu oyun modu, gizlilik ve stratejiyi bir araya getirerek geleneksel savaş oyunlarının ötesinde yepyeni bir deneyim sunuyor. Her oyun toplamda 3 Avcı ve 9 Av olmak üzere 12 oyuncudan ve üç turdan oluşuyor. Her turun başında oyuncular tercih ettikleri rolü seçiyorlar; gerektiğinde takımlar otomatik olarak dengeleniyor. Oyun, birden fazla aşamadan oluşuyor. Hazırlık aşamasında, Avcılar kısıtlı bir alanda beklerken, Av rolündekiler kılık değiştirip saklanma yerlerini buluyor. Tur ilerledikçe, Avcılar obje kılığındaki Avları arayıp ortadan kaldırmaya başlıyorlar ancak oyuncu olmayan objelere ateş etmek Avcıların HP puanlarını düşürüyor. Bu nedenle alınan her karar beraberinde bir risk de taşıyor. Her turun sonuna doğru yaşanan kısa […]

PUBG: Battlegrounds’tan 1 Nisan’a özel “Dekor Avı” modu yazısı ilk olarak Teknoloji haberleri – LOG üzerinde yayınlandı.

How to Get City, Postal Code, Address from Latitude and Longitude

Latitude and longitude grid

In many applications, you don’t start with an address — you start with coordinates.

A user clicks on a map, shares their GPS location, or your system receives latitude and longitude from a device. But raw coordinates like 40.748817, -73.985428 aren’t very useful on their own. Most applications need human-readable data: a city name, a postal code, or a full address.

This is where reverse geocoding comes in.

In this article, we’ll look at how to convert latitude and longitude into structured address data — including city, postal code, and formatted address — and, more importantly, what developers should be aware of when working with real-world location data.

To make things more practical, we’ll also use a simple interactive demo where you can click on a map and instantly get the corresponding address details:

Coordinates vs Address: Two Ways to Describe a Location

Latitude and longitude coordinates describe an exact point on Earth using a global grid system.

  • latitude defines how far north or south a location is
  • longitude defines how far east or west it is

Together, they pinpoint a precise location anywhere on the planet:

Latitude and longitude grid

For example, the coordinates 40.748817, -73.985428 represent a specific point in New York.

However, while coordinates are extremely precise, they are not very intuitive for humans. People naturally think of locations in terms of:

  • cities
  • streets
  • postal codes
  • full addresses

This creates a gap between how machines represent locations and how humans understand them.

So how do you convert coordinates into a readable address?

To do that, you need a process that maps latitude and longitude to real-world location data — such as city names and postal codes. This process is called reverse geocoding.

Reverse Geocoding: Convert Coordinates to City, Postal Code, and Address

Reverse geocoding is the process of converting geographic coordinates (latitude and longitude) into a human-readable address.

In practice, reverse geocoding is not something you implement locally. It requires access to large, constantly updated geographic datasets that map coordinates to real-world address data — including administrative boundaries, streets, buildings, and postal codes.

Because of this, reverse geocoding is typically provided as a service via APIs.

One example is the Geoapify Reverse Geocoding API, which allows you to send coordinates and receive structured address data in response.

Here is an example API Request:

https://api.geoapify.com/v1/geocode/reverse?lat=40.748817&lon=-73.985428&format=json&apiKey=YOUR_API_KEY

The response contains structured fields such as:

  • city, town, village
  • postcode
  • street, housenumber
  • formatted (full address)

You can also control the level of detail using the type parameter, which helps filter results by address level (for example: city, postcode, street, etc.).

Getting city from coordinates

To get the city from coordinates, you can use reverse geocoding with the type=city parameter. This tells the API to return results at the city level.

For example:

https://api.geoapify.com/v1/geocode/reverse?lat=40.719726903683636&lon=-74.04103305850015&format=json&type=city&apiKey=YOUR_API_KEY

A typical response looks like this:

{
  "results": [
    {
      "country": "United States",
      "state": "New Jersey",
      "city": "Jersey City",
      "lon": -74.047455,
      "lat": 40.7215682,
      "result_type": "city",
      "formatted": "Jersey City, NJ, United States of America",
      "address_line1": "Jersey City, NJ",
      "address_line2": "United States of America",
      ...
    }
  ]
}

Using type=city ensures that the response focuses on the city-level administrative area, rather than returning street-level or building-level details.

Getting postcode (ZIP code) from coordinates

To get the postal code from coordinates, you can use reverse geocoding with the type=postcode parameter. This ensures the API returns results at the postcode level.

For example:

https://api.geoapify.com/v1/geocode/reverse?lat=40.739501996228256&lon=-74.18542863164123&type=postcode&format=json&apiKey=YOUR_API_KEY

A typical response looks like this:

{
  "results": [
    {
      "country": "United States",
      "state": "New Jersey",
      "city": "Newark",
      "postcode": "07103",
      "result_type": "postcode",
      "formatted": "Newark, NJ 07103, United States of America",
      "address_line1": "Newark, NJ 07103",
      "address_line2": "United States of America"
    }
  ]
}

The key field here is:

  • postcode — contains the postal (ZIP) code for the given coordinates

Additional useful fields include:

  • city — the associated city
  • formatted — full human-readable address

Using type=postcode ensures that the response focuses specifically on postcode-level data.

Keep in mind that:

  • not all locations have postal codes
  • postal codes may represent areas rather than exact points
  • formats vary depending on the country

Getting address from coordinates

To get a full address from coordinates, you can use reverse geocoding without specifying a type, which returns the most relevant place for the given location (for example, a building, POI, or street address).

For example:

https://api.geoapify.com/v1/geocode/reverse?lat=40.68818115914695&lon=-73.99558678565592&format=json&apiKey=YOUR_API_KEY

A typical response looks like this:

{
  "results": [
    {
      "name": "Citi Bike - Congress St & Clinton St",
      "housenumber": "183",
      "street": "Congress Street",
      "city": "New York",
      "postcode": "11201",
      "state": "New York",
      "country": "United States",
      "result_type": "amenity",
      "formatted": "Citi Bike - Congress St & Clinton St, 183 Congress Street, New York, NY 11201, United States of America",
      "address_line1": "Citi Bike - Congress St & Clinton St",
      "address_line2": "183 Congress Street, New York, NY 11201, United States of America"
    }
  ]
}

The most useful field for display is:

  • formatted — a ready-to-use human-readable address

You can also access individual components such as:

  • name — place or POI name (if available)
  • housenumber and street
  • city, postcode, state, country

By default, reverse geocoding returns the most relevant result for the given coordinates, which may be a specific place (like a business or landmark), not just a street or city.

Common Pitfalls When Converting Coordinates to Address

Reverse geocoding is powerful, but working with real-world location data comes with a few important caveats.

Understanding these will help you avoid common mistakes and build more reliable applications.

City is not always available

Not every location has a city field. Depending on where the coordinates point, the response may include:

  • city
  • town
  • village
  • or no settlement at all

To handle this correctly, always implement a fallback strategy instead of relying on a single field.

The result depends on the exact point

Small changes in coordinates can lead to different results.

For example, clicking on:

  • a building → returns a specific address
  • a road → returns street-level data
  • a park → may return only city or district

This is expected behavior, not an error.

The closest result may not match expectations

Reverse geocoding returns the nearest known object.

This could be:

  • a building
  • a business (POI)
  • a street
  • an administrative area

If you need a specific level (e.g., city or postcode), use the type parameter to control the result.

Coordinates may need normalization

Coordinates should always be valid:

  • latitude must be between -90 and 90
  • longitude must be between -180 and 180

Try It Yourself: Interactive Reverse Geocoding Demo

To better understand how reverse geocoding works in practice, try this interactive demo:

Live Demo on CodePen

The demo also shows how different clicks can return different types of results depending on the location — for example, a building, a street, or an administrative area.

Summary

Converting latitude and longitude into a city, postal code, or full address is a common requirement in many applications — from delivery services to map-based interfaces.

In this article, we explored how reverse geocoding works and how to use it to extract meaningful location data from coordinates.

Key takeaways:

  • coordinates describe precise locations, but are not human-friendly
  • reverse geocoding bridges the gap between coordinates and real-world addresses
  • you can extract specific data like city and postcode using the type parameter
  • not all locations have complete address data, so fallback logic is important
  • results may vary depending on the exact coordinates and context

By understanding these concepts and handling edge cases properly, you can build reliable features that convert coordinates into usable address information.

Additional Resources

FAQ

Is reverse geocoding free?

Most reverse geocoding services offer a free tier with usage limits.

For example, Geoapify provides a free plan with 3000 requests per day and 5RPS. This is usually enough for testing and small applications. For production use or higher volumes, paid plans are available.

How do I get an API key?

To use a reverse geocoding service like Geoapify, you need an API key.

You can get one by registering at the website.

After creating a project, you’ll receive an API key that you can use in your requests.

How do I get the timezone from coordinates?

Reverse geocoding responses often include timezone information.

For example, Geoapify returns a timezone object with:

{
  "name": "America/New_York",
  "offset_STD": "-05:00",
  "offset_STD_seconds": -18000,
  "offset_DST": "-04:00",
  "offset_DST_seconds": -14400,
  "abbreviation_STD": "EST",
  "abbreviation_DST": "EDT"
}

You can extract this directly from the response without making a separate API call.

How do I get the state or region?

To get the state or region from coordinates, you can use reverse geocoding with the type=state parameter. This ensures the API returns results at the state level.

How can I understand the quality of the result?

You can estimate how accurate the result is using the distance field.

  • distance represents how far (in meters) the returned result is from the input coordinates
  • smaller values indicate higher accuracy

For example:

  • 0–10 meters → very precise (building-level)
  • 10–100 meters → good accuracy
  • 100+ meters → approximate result

Why do I sometimes get a place (POI) instead of an address?

By default, reverse geocoding returns the most relevant nearby object.

This could be:

  • a business or landmark (POI)
  • a building
  • a street
  • an administrative area

If you need a specific level (e.g., city or postcode), use the type parameter to control the result.

Can I use reverse geocoding offline?

In most cases, no.

Reverse geocoding requires large and frequently updated datasets, making it impractical to run locally. That’s why it is typically provided as an online API service.

What happens if there are no results?

In some cases, reverse geocoding may return no results:

  • remote areas
  • oceans or lakes
  • incomplete data coverage

Your application should handle this gracefully and provide fallback behavior.

Inference Observability: Why You Don’t See the Cost Spike Until It’s Too Late

Rack2Cloud-AI-Inference-Cost-Series-Banner

Rack2Cloud-AI-Inference-Cost-Series-Banner

The bill arrives before the alert does. Because the system that creates the cost isn’t the system you’re monitoring.

Inference observability isn’t a tooling problem — it’s a layer problem. Your APM stack tracks latency. Your infrastructure monitoring tracks GPU utilization. Neither one tracks the routing decision that sent a thousand requests to your most expensive model, or the prompt length drift that silently doubled your token consumption over three weeks.

By the time your cost alert fires, the tokens are already spent.

The Visibility Gap

Inference cost is generated at the decision layer. Routing decisions, token consumption, model selection, retry behavior — these are the variables that determine what you pay. But most observability exists at the infrastructure layer.

inference observability visibility gap infrastructure application decision layer cost tracking

Here’s how the layers break down:

Layer What It Tracks What It Misses
Infrastructure CPU, GPU, memory, latency Token usage, routing decisions, model selection
Application Errors, response time, request volume Model decisions, prompt length, retry cost
Inference (decision layer) Usually not instrumented Everything that drives cost

The inference layer is where routing decisions get made, where token budgets get consumed, where cache hits and misses determine whether you’re paying for compute or serving from memory. It’s also the layer that most monitoring stacks treat as a black box.

The 5 Signals That Predict Cost Before It Spikes

Standard metrics tell you what happened. These signals tell you what’s about to happen.

Signal 01 — Token Consumption Rate (spend velocity)
Tokens per second per endpoint. A spike in token consumption rate precedes a cost spike by minutes to hours. Track it at the endpoint level, not the aggregate.

Signal 02 — Prompt Length Drift (silent cost multiplier)
The p95 prompt length over time. When prompt length drifts upward — users adding more context, system prompts growing, retrieval chunks increasing — token cost grows with it. No alert fires. No system breaks. The bill just quietly doubles over three weeks.

Signal 03 — Cache Hit Rate (efficiency signal)
Semantic cache and KV cache hit rates. A cache hit rate drop from 40% to 20% doubles your effective inference cost with no change in request volume. Most teams don’t instrument it at all.

Signal 04 — Routing Distribution (decision quality signal)
The percentage of requests hitting each model tier. When routing distribution drifts — more requests hitting your frontier model than expected — cost escalates without any system error.

Signal 05 — Retry Rate (failure cost amplifier)
Failed requests that retry still consume tokens on the failed attempt. A 10% retry rate means 10% of your token spend generated zero value.

What to Instrument — The 3-Layer Observability Stack

Instrumentation must exist at the same layer where decisions are made.

Decision Layer (request-level)

  • Tokens in / tokens out per request
  • Model selected
  • Routing path taken
  • Cost per request
  • Cache hit or miss
  • Latency to first token

Behavior Layer (session-level)

  • Total token budget consumed per session
  • Routing path distribution
  • Retry count
  • Prompt length trend
  • Token budget remaining vs elapsed session time

Business Layer (aggregate)

  • Cost per feature
  • Cost per user cohort
  • Token burn rate (velocity)
  • Routing distribution drift
  • Cache efficiency trend
  • Budget utilization rate

The Budget Signal Pattern

Dollar alerts are lagging indicators. Token rate alerts are leading indicators.

Most teams set cost alerts at the dollar level. By the time that alert fires, the tokens are already spent, the requests already executed, the routing decisions already made. You can’t stop a cost spike that already executed.

Token rate — tokens consumed per minute per endpoint — fires earlier. A token rate anomaly is detectable within minutes of a routing change, a prompt length drift, or a cache configuration failure.

Alert Type When It Fires Can You Intervene?
Dollar alert After spend threshold exceeded No — tokens already spent
Token rate alert When consumption velocity anomalies detected Yes — reroute, throttle, or kill

Where Inference Observability Fails

Most teams can tell you what they spent. Very few can tell you why.

[01] Tracking latency, not tokens.
Response time is green. Token consumption has been climbing for two weeks. The system looks healthy. The bill doesn’t.

[02] Tracking errors, not retries.
Error rate is 0.1%. Retry rate is 12%. Every retry is a token burn that generated zero output value.

[03] Tracking requests, not routing paths.
Request volume is flat. Routing distribution has drifted — 60% of requests now hitting the frontier model instead of the expected 20%. Volume didn’t change. Cost per request tripled.

[04] Tracking cost, not cause.
Monthly spend alert fires. The investigation begins after the fact — sifting through logs to reconstruct which routing decision, which prompt length drift, which cache failure caused it. Post-incident analysis, not prevention.

How the Series Connects

This series has been building a single architecture across four posts:

  • Part 1 — The cost model: why inference behaves like egress
  • Part 2 — Execution budgets: runtime controls that cap spend before it cliffs
  • Part 3 — Cost-aware routing: getting requests to the right model at the right cost
  • Part 4 — Observability: the feedback loop that makes the other three work

Without observability, the other three are blind. Budgets are unvalidated. Routing is unconfirmed. Cost model predictions are theoretical.

ai inference request routing model token cost observability monitoring gap diagram

Architect’s Verdict

You can’t enforce a budget you can’t see. And you can’t see inference cost until you instrument the decision layer.

Instrument the decision layer. Set token rate alerts, not just dollar alerts. Track routing distribution as a cost signal. Treat cache hit rate as an efficiency metric with direct cost implications.

The goal isn’t more dashboards — it’s visibility at the layer where cost decisions are actually made. That’s the only layer where intervention is still possible.

Full post with HTML diagrams, the visibility gap table, and the complete 5-signal card breakdown: rack2cloud.com/ai-inference-observability

Part of the AI Infrastructure Architecture series on Rack2Cloud.

How We Cut Rails on GKE Costs by 60%: The “Efficiency First” Roadmap

Monthly cost

tl;dr: We reduced Google Kubernetes Engine(GKE) costs by 60%. The biggest wins came not from Kubernetes tuning, but from understanding why our Rails app needed so many Pods in the first place:

  • Rails was running 1 Puma worker with 33 threads. Ruby’s GVL made this effectively single-core. We switched to 4 workers with 8 threads.
  • API authentication used bcrypt on every request. We replaced it with a lighter method.
  • GKE node generation was outdated: upgrading from n1 to n2d gave 56% more CPU, 23% more RAM, for 3% less cost.
  • Only after fixing per-Pod efficiency did we add KEDA Cron autoscaling and GKE node autoscaling.

The order mattered. We improved per-Pod efficiency first, then used autoscaling to stop paying for idle capacity. The interesting part was not any one change by itself, but why these four changes reinforced each other. The rest of this article walks through the reasoning behind each one.

I work on a B2B SaaS platform that runs on Google Kubernetes Engine. The API server is a Rails application, and it was the biggest cost driver on our GKE cluster.

Over the course of about nine months, we reduced GKE costs by roughly 60%, with most of the core technical changes concentrated in July and August 2025. Most of the savings came from understanding how Rails actually uses CPU and memory, and fixing misconfigurations that had been in place since launch. The Kubernetes-level changes (autoscaling, node upgrades) were important, but they only worked well because we fixed the application layer first.

The key was looking at the system holistically, from Ruby’s runtime behavior to Kubernetes scaling. This article explains why the savings came from four changes applied in the right order: better GKE node price-performance, a Rails process model that matched Ruby’s concurrency model, removing unnecessary per-request CPU work, and only then introducing autoscaling.

The vicious cycle: why the cluster needed so many Pods

The high cost was not caused by a single problem. It was a cycle:

  1. Inefficiency: Rails performance was poor, partly due to misconfigured concurrency settings and a CPU-heavy authentication path.
  2. Over-provisioning: To handle traffic, we compensated by running more Pods.
  3. Waste: There was no autoscaling, so those Pods ran 24/7 regardless of actual demand.
  4. High Unit Cost: The nodes were old-generation instances with worse price-performance.

Each problem amplified the others. Inefficient Pods meant we needed more of them, which meant more nodes to host them, all running around the clock.

The reduction did not come from one dramatic optimization. It came from breaking this cycle at multiple points: making each Pod more efficient, reducing unnecessary CPU work, and only then allowing the cluster to scale with demand.

How the cost actually came down

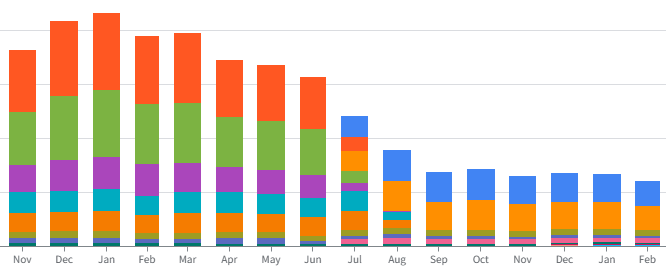
Before diving into the technical details, here is what the cost trajectory looked like. The chart below shows monthly GKE spending by SKU. The trend is clear.

Monthly cost

This was not primarily a traffic reduction. API traffic remained broadly stable during this period, and the savings came mainly from efficiency improvements.

The reduction happened in two phases.

In the first phase (early 2025 through June 2025), we simply reduced Pod and node counts that were clearly excessive. This brought costs down from the peak, but it was just trimming fat. The underlying inefficiencies remained.

The second phase (July 2025 onward) is where the real optimization happened. It breaks down into two parts:

  • Part 1: Static optimization — making each Pod and each node as efficient as possible.
  • Part 2: Dynamic optimization — scaling capacity up and down with demand.

Part 1: Static Optimization

1.1 GKE Node generation upgrade: n1-highmem-2 → n2d-highmem-2

Our GKE nodes had been running on n1-highmem-2 since the early days of the service. The n1 family is Google Cloud’s first generation of general-purpose instances, based on older Intel Skylake/Broadwell processors.

We migrated to n2d-highmem-2, which uses AMD EPYC processors. The performance difference is significant. According to Google’s official CoreMark benchmarks:

Instance type CoreMark score RAM Monthly cost (asia-northeast1)
n1-highmem-2 26,293 13 GiB ~$124
n2d-highmem-2 41,073 16 GiB ~$120

56% more CPU performance. 23% more RAM. 3% lower cost. The newer generation is faster, has more memory, and is cheaper.

For us, this was one of the rare optimizations that improved both performance and cost at the same time. The migration itself was straightforward: update the node pool configuration, cordon and drain the old nodes, and let the new pool take over. We did this in July 2025, and it shows up as a clear inflection point in the billing data.

This time, we chose x86-based N2D rather than Arm to preserve binary compatibility and minimize ecosystem risk around Ruby, native extensions, and container images. It was the most practical low-risk step. That said, Arm remains a possible next step for further cost reduction.

If your GKE nodes are still running on n1-series instances, check the benchmarks and pricing for n2d or newer.

1.2 Rails process model: from 33 threads to 4 workers

This was probably the biggest single contributor to the cost reduction.

Our Rails application was running Puma with the following configuration:

  • WEB_CONCURRENCY was not set (defaults to 1, meaning a single worker process)
  • RAILS_MAX_THREADS=33

So we had one process with 33 threads. On the surface, that sounds like it should handle 33 concurrent requests efficiently. In practice, it did not give us the kind of throughput we expected, because of how Ruby works.

Ruby’s Global VM Lock (GVL)

Ruby has a Global VM Lock (GVL). Only one thread can execute Ruby code at a time within a single process. Multiple threads help when threads are waiting on I/O (database queries, HTTP calls, file reads), because a waiting thread releases the GVL and lets another thread run. But for CPU-bound work, 33 threads in one process gives you essentially the same CPU throughput as 1 thread.

This meant our 33-thread setup was an illusion. We were paying for the memory overhead of 33 thread stacks without getting the CPU parallelism we thought we had.

The bcrypt problem

On top of the GVL issue, our API used bcrypt for token authentication on every request. bcrypt is designed to be slow. That is its purpose as a password hashing algorithm: it is intentionally CPU-intensive to make brute-force attacks impractical.

But we were running bcrypt on every API call, not just on login. Modern versions of bcrypt-ruby release the GVL during computation, so it does not block other threads. However, the CPU cost itself remains significant. Every API request was burning CPU cycles on an expensive hashing operation, eating into the Pod’s overall processing capacity. With hundreds of API calls per minute, this added up.

We replaced bcrypt with a lighter authentication method for API token validation. The specifics of the new approach are not relevant here, but the key point is: bcrypt is the right tool for password hashing at login. It is the wrong tool for per-request API authentication.

The fix

We changed the Puma configuration to:

  • WEB_CONCURRENCY=4 (4 worker processes)
  • RAILS_MAX_THREADS=8

Four worker processes, each with its own GVL, running on separate CPU cores. This gives actual CPU parallelism. Thread count was reduced to 8 per worker, which is enough for I/O concurrency without the memory overhead of 33 threads. That said, 8 is still conservative. Since Rails 7.2, the default Puma thread count is 3 per worker, reduced from the previous default of 5. We may reduce this further in the future, which would lower per-worker memory consumption even more. For guidance on tuning worker and thread counts for your environment, see Puma’s deployment documentation.

The memory impact was counterintuitive. You might expect 4 workers to use 4x the memory of 1 worker. They do not, thanks to Copy-on-Write (CoW). When Puma forks worker processes, the child processes share the parent’s memory pages. They only allocate new memory when they write to a page. In practice, a large portion of the Rails application code, gems, and boot-time data remains shared.
One important requirement for this to work is to use preload_app! in your Puma configuration. Without it, each worker loads the application independently after forking, and memory sharing does not happen.

We also set the environment variable MALLOC_ARENA_MAX=2 to reduce glibc’s memory arena overhead. You can think of it as a small but useful guardrail against glibc holding on to too much memory. By default, glibc creates up to 8 * CPU cores malloc arenas, each of which holds onto freed memory independently. In a multi-process Rails setup, this leads to significant memory waste. Setting MALLOC_ARENA_MAX=2 cut per-Pod memory consumption by roughly 20%. I wrote a more detailed article about this:

Between CoW, MALLOC_ARENA_MAX, and fewer threads, our Pod memory request actually decreased from 4.2Gi to 3.5Gi, even after moving from one worker process to four.

That means the memory cost of achieving real CPU parallelism dropped significantly.

But the memory improvement was secondary. The real cost impact was the reduction in Pod count. Previously, each Pod had only one Puma worker, which limited CPU-parallel Ruby execution and forced us to run more Pods to handle traffic. With 4 workers per Pod, the same traffic can be served by far fewer Pods. Fewer Pods means fewer nodes, and that is where the cost savings came from.

Part 2: Dynamic Optimization

With each Pod running more efficiently, the next step was to stop paying for capacity we did not need outside of peak hours. But before turning on autoscaling, we needed to make sure Pods could be safely started and stopped at any time.

2.0 Prerequisites: making Pods safe to autoscale

Autoscaling means Kubernetes is constantly creating and destroying Pods. If your Pods are not set up for this, you trade cost savings for reliability problems.

We configured the following before enabling any autoscaling:

Startup probe. Our Rails application takes a while to boot. It loads the framework, initializes gems, establishes database connections, and warms up caches. Without a startup probe, Kubernetes may decide the Pod is unhealthy and kill it before it finishes starting. The startup probe gives the Pod the time it needs to complete initialization before liveness checks begin.

Readiness probe. This tells Kubernetes whether a Pod is ready to accept traffic. If a Pod becomes temporarily unable to serve requests (for example, during a heavy background job or a lost database connection), the readiness probe fails and the Pod is removed from the Service’s endpoints until it recovers.

Liveness probe. This detects Pods that are running but stuck (a hung Rails process, for example). Kubernetes automatically restarts them. This is important for long-running Pods.

terminationGracePeriodSeconds. When KEDA scales in Pods during the evening, in-flight requests need time to complete. The grace period tells Kubernetes to wait before forcefully killing the Pod, preventing dropped requests during scale-in. In practice, setting the grace period alone may not be enough. Kubernetes removes the Pod from the Service endpoints in parallel with sending the termination signal, so some requests can still arrive after shutdown begins. Adding a short preStop hook (e.g., sleep for a few seconds) gives the endpoints update time to propagate. See this article on graceful Kubernetes deployments for a detailed explanation of the timing issue.

These are not optional extras. They are prerequisites. Without them, autoscaling works on paper but fails in production. For details on configuring each probe type, see the Kubernetes documentation on liveness, readiness, and startup probes.

2.1 KEDA with Cron trigger

Before KEDA, our Pods ran at peak capacity 24/7. The replica count was set to handle the busiest time of day, and it stayed there overnight, on weekends, and on holidays.

Our platform is a business application. Usage concentrates on weekday business hours (roughly 8:30 to 19:30 JST). Evenings and weekends are quiet. This traffic pattern is stable and predictable.

Given this predictability, we chose KEDA‘s Cron trigger. KEDA is an event-driven autoscaler for Kubernetes, and the Cron trigger is one of its simplest scaling options: it adjusts the replica count on a time-based schedule, rather than reacting to metrics like CPU or memory usage. When you know the traffic pattern in advance, this is simpler and more reliable than reactive scaling. There is no lag waiting for metrics to cross a threshold, no risk of flapping, and the configuration is easy to understand.

Our configuration:

  • Weekdays 08:00-20:00 JST: about 3–4x more replicas than the baseline off-hours level
  • All other times: baseline replica count

No metrics, no thresholds, no reactive logic. For our traffic pattern, that simplicity was a feature, not a limitation.

One thing to note: Cron-based scaling assumes the traffic pattern stays stable. As the business grows, the current replica counts may not be enough. To catch this early, we monitor API response times with external synthetic monitoring. If response times start creeping up during business hours, that is the signal to revisit the replica counts. Cron scaling is not set-and-forget. It just changes infrequently.

2.2 GKE Node Autoscaling

With Pod counts now fluctuating on KEDA’s schedule, we enabled GKE’s Cluster Autoscaler.

The logic is straightforward: when KEDA scales Pods down in the evening, some nodes end up underutilized. The Cluster Autoscaler drains those nodes and removes them. When KEDA scales Pods back up in the morning, the autoscaler provisions new nodes to accommodate them. We configured a minimum node count for availability zone redundancy and a maximum to cap costs.

The combination of KEDA controlling Pod count and the Cluster Autoscaler controlling node count means we only pay for the capacity we are actually using.

Results

Comparing the H2 2024 average (before optimization) to the Q1 2026 average (after all changes were in place):

Metric Before After
Node type n1-highmem-2 n2d-highmem-2
CoreMark score 26,293 41,073 (+56%)
Node RAM 13 GiB 16 GiB (+23%)
Node cost (asia-northeast1) ~$124/month ~$120/month (-3%)
Puma workers (WEB_CONCURRENCY) 1 4
Threads per worker (RAILS_MAX_THREADS) 33 8
API auth per request bcrypt Lighter method
MALLOC_ARENA_MAX Not set 2
Pod memory request 4.2Gi 3.5Gi (-20%)
Pod scaling Static (always at peak) KEDA Cron (higher during weekday daytime, minimum otherwise)
Node scaling Fixed count Cluster Autoscaler
GKE monthly cost Baseline -60%

The cost declined steadily from February 2025 through September 2025 as each optimization was rolled out. The N1 to N2D node migration in July 2025 is visible as a clear step down in the billing data. Costs stabilized from late 2025 onward.

Lessons learned

None of these were particularly glamorous optimizations. Most were the kind of changes teams postpone because each one seems too small to matter. But together, they changed the economics of the entire system.

The ordering mattered as much as the individual changes. The biggest lesson was that cost optimization is not primarily about scaling policies. It is about unit economics. First make each Pod cheaper and more productive. Then let autoscaling amplify that efficiency. If we had introduced autoscaling first, we would simply have scaled an inefficient system up and down. The real savings only appeared after we improved per-Pod efficiency.

Understand your runtime’s concurrency model. Ruby’s GVL means threads do not give you CPU parallelism. If your Rails app has a high thread count and a single Puma worker, you are paying for memory without getting the concurrency you expect. Use multiple workers for CPU parallelism, and set thread count based on I/O concurrency needs only.

bcrypt is for passwords, not for API tokens. bcrypt is intentionally slow. Running it on every API request is a CPU tax that adds up quickly. Use it where it belongs (password hashing at login) and use something lighter for per-request token validation.

Boring autoscaling is good autoscaling. KEDA supports dozens of trigger types, including metrics-based, queue-based, and custom triggers. But for a business application with a predictable traffic pattern, a Cron trigger is the right choice. Do not build complexity you do not need.

Review your resource allocations regularly. If your Pod requests and limits have not changed since the service launched, they are almost certainly wrong. Workloads evolve, but resource specifications tend to stay frozen.

Node generations matter more than you think. Upgrading from n1 to n2d gave us 56% more CPU, 23% more RAM, and 3% lower cost. The migration effort was minimal. If you are still on n1, just do it.

Looking back, the 60% cost reduction came from being willing to look across the full stack, from Ruby’s runtime model to Kubernetes scaling policies, rather than optimizing within a single layer.

For more on the Rails memory topic, see my article:

You Can Build While You’re Still Becoming!

I didn’t feel ready when I said yes to speaking at EmpowHER! — Sketching Visions, Building Futures.

Honestly? I’m not sure I ever feel ready. And I’m starting to think that’s the whole point.

There’s this quiet lie we tell ourselves — that we need to arrive somewhere first before we’re allowed to start. That we need a title, a credential, a moment where everything finally clicks into place and someone hands us a permission slip to take up space. I spent a long time waiting for that moment. I’m done waiting.

The rooms that asked me to earn my voice twice.

I’ve been in rooms where my ideas needed a louder voice behind them before they were taken seriously. Rooms where I was the youngest person, the only woman, the one who “didn’t look like” what leadership was supposed to look like. And for a while, I internalized that. I worked harder, spoke less, and convinced myself that visibility was something I had to earn rather than something I was already worthy of.

But here’s what I know now:

that feeling — imposter syndrome, self-editing, shrinking — it doesn’t disappear after graduation. It doesn’t vanish when you get the job, the role, or the stage. It just changes shape.

The difference isn’t that I stopped feeling it. The difference is that I stopped letting it make decisions for me.

I built communities not because I had it figured out, but because I cared enough to start.

When I got involved with AWS User Group BuildHers+, I wasn’t an expert. I was someone who kept noticing the same gap — women and LGBTQIA+ folks in tech who were brilliant, capable, and quietly underestimated. I didn’t have all the answers. I just had enough conviction to show up and try.

And that’s how most meaningful things begin, I think. Not with certainty. With care.

The sessions I’ve helped organize, the mentors I’ve watched show up for students they’d never met, the women who come up after talks and say I thought I was the only one who felt that way — none of that happened because I waited until I was fully formed. It happened because I started anyway.

What “becoming” actually looks like.

Becoming isn’t linear. It’s not a ladder you climb rung by rung until you reach some final, polished version of yourself. It’s messier and more interesting than that.

It looks like delivering a talk on imposter syndrome while quietly battling your own. It looks like building a mentorship program when you still have your own mentors you lean on. It looks like writing a caption, drafting remarks, crafting a space — and wondering the whole time if it’s good enough — and then showing up anyway.

You are not a before. You’re not waiting in a lobby until you become someone worth listening to. You are already in motion. Already building. Already becoming.

The table doesn’t have to be given to you.

This is the line I keep coming back to. Not because it’s defiant — though sometimes defiance is exactly what’s needed — but because it’s true.

If the room doesn’t have space for you, you can build the room. If the conversation isn’t happening, you can start it. If the people around you don’t see what’s possible, you can create the proof.

You don’t need to feel ready. You don’t need to have all the answers. You don’t need a perfect plan or a flawless track record or someone else’s validation before you begin.

You just need to start.

To every woman who’s been talked over and showed up anyway. To every student who walked into a room full of “experienced” people and stayed. To everyone who’s ever felt like they were building in the dark — you are not alone, and your work matters.

The table doesn’t have to be given to you.

Build it.

To the AWS Cloud Club – HUGO team of TUP Manila:

Thank you. Genuinely.

Being invited to speak at EmpowHER! — Sketching Visions, Building Futures was one of those moments I didn’t expect to sit with me as long as it did. But here I am, still thinking about the energy in that room, and it’s entirely because of the space you created.

To the event chairladies, Charlote and Zendy — the way you lead is the kind of leadership that makes people feel like they belong before they even introduce themselves. You didn’t just organize an event. You built something that mattered. And I was so honored to be a small part of it.

I came to share a story, but I think I left with more than I brought. That’s the mark of a community that’s doing something right.

Keep building! The tech space is better because you’re in it.

If you made it to the end of this — thank you. Really. It means more than you know.

And if something here resonated with you, if you’re somewhere in the middle of your own becoming and you have questions about the industry, corporate life, what it actually looks like to navigate tech as a woman or someone who’s ever felt like they didn’t quite fit — I want you to know my door is open.

If you’d like to be mentored, need someone to think out loud with, or just want a safe space to ask the questions you’re afraid sound too small or too big — reach out. No agenda, no pressure. Just an honest conversation between people trying to figure it out together.

I can’t promise I have all the answers. But I promise I’ll show up for you the same way I wish someone had shown up for me.

Find me on LinkedIn. I’d love to hear from you. 🩷

Post-Mortem: The March 2026 Axios Supply Chain Attack

The Incident

On March 31, 2026, a high-profile supply chain attack targeted Axios, a critical HTTP client for the JavaScript ecosystem. By hijacking a maintainer’s NPM account, attackers injected a malicious dependency, plain-crypto-js, which deployed a cross-platform Remote Access Trojan (RAT).

Incident Summary

Detail Information
Affected Versions [email protected], [email protected]
Malicious Dependency [email protected]
Payload Cross-platform RAT (Linux, macOS, Windows)
C2 Server sfrclak.com:8000
Resolution Window Live for ~3 hours (00:21 – 03:29 UTC)

Technical Deep Dive

The attack bypassed standard security audits by hiding the malicious logic within a sub-dependency. Once installed via a standard npm install, the payload scanned the host machine for:

  • Environment Variables: .env files and active shell exports.
  • Auth Tokens: ~/.npmrc and ~/.aws/credentials.
  • SSH Keys: Unprotected private keys in ~/.ssh.

Data was exfiltrated via POST requests to the sfrclak.com Command & Control (C2) server.

Remediation & Verification

To ensure a development environment is sanitized, the following protocol was executed:

  1. Network Sinkholing: Manually mapping the C2 domain to 127.0.0.1 in /etc/hosts to prevent further exfiltration and “kill” the phone-home capability.
  2. Lockfile Audit: Scanning all local projects for traces of the malicious package using a space-safe search:

    find . -type f ( -name "package-lock.json" -o -name "yarn.lock" ) -print0 | xargs -0 grep "plain-crypto-js"
    
  3. Environment Sanitization: Clearing the global NPM cache and updating tool managers (like mise) to ensure only verified versions are used moving forward.

Pro-Tip: Always use npm audit or tools like Snyk to monitor your dependency tree for “hidden” sub-dependencies that do not appear directly in your package.json.

Multi-Agent AI Systems: Architecture Patterns That Actually Work

Single agents break in boring ways. You hit context limits, tools start interfering with each other, and the more capable you try to make one agent the worse it performs on any individual task. The solution most people reach for — just make the prompt bigger — is the wrong answer.

Multi-agent systems are the right answer, but they introduce a different class of problem: coordination, trust, and failure modes that are harder to debug than a bad prompt. This post is about the architecture patterns I’ve landed on after running multi-agent systems in a homelab environment where the stakes are real (it controls actual infrastructure) but forgiving enough to experiment.

Why Split Into Multiple Agents At All?

Before getting into patterns, it’s worth being honest about the tradeoffs. Multi-agent systems are more complex. They have more failure points. Debugging a chain of three agents is significantly harder than debugging one. You only pay that cost if you’re getting something back.

The things you get back:

Specialization compounds. An agent that only does Kubernetes operations can have a tightly scoped toolset, a precise system prompt tuned for that domain, and a shorter context because it’s not carrying around unrelated knowledge. It performs better on its job than a generalist agent would.

Context windows stop being a ceiling. Long-running tasks that would overflow a single agent’s context can be broken across agents that hand off summaries. An orchestrator can spawn sub-agents, collect their results, and synthesize without any one agent seeing the full problem.

Privacy routing becomes possible. This is underrated. If you have agents with different sensitivity levels — one handling ops metrics, another handling personal calendar and email — you can route them to different models. The ops agent can call an external API. The personal agent can run on a local model that never leaves the LAN. Single-agent designs make this impossible.

Blast radius shrinks. An agent that can only read Kubernetes state cannot accidentally delete a deployment. Least-privilege is easier to enforce when you have separate agents with separate toolsets than when you’re trying to gate everything behind one prompt.

Pattern 1: Orchestrator + Specialist Workers

This is the most common pattern and the one to default to. A routing agent receives user requests, determines which specialist should handle it, and delegates.

User → Orchestrator → [SRE Agent | Dev Agent | Life Agent | ...]
                           ↓
                     Task result
                           ↓
                     Orchestrator → User

The orchestrator itself does minimal work. It doesn’t need access to kubectl or shell commands. Its job is understanding intent and dispatching. The specialists have rich toolsets and domain-specific system prompts.

In practice, this means the orchestrator’s context is almost always short. It’s not accumulating tool call results — it’s reading summaries. The specialist agents can run with full context depth on their narrow domain.

One thing I’ve learned: resist the urge to make the orchestrator smart. Every behavior you add to the orchestrator is behavior that’s harder to test, harder to attribute errors to, and harder to swap out. Keep it thin. If you find the orchestrator doing complex reasoning, that reasoning belongs in a specialist.

Pattern 2: Peer Mesh with Shared Memory

Sometimes there’s no natural hierarchical decomposition. Tasks are overlapping, agents need to share context dynamically, and a fixed orchestrator would become a bottleneck.

In this pattern, agents share a memory store (vector database, key-value store, or a message bus) and can read each other’s observations.

# Example: agent writes observation to shared store
memory:
  key: "cluster/events/2026-03-22"
  value: "Node A showing elevated memory pressure (85%)"
  tags: [infrastructure, alert, node-a]
  ttl: 3600

A different agent doing capacity planning reads this observation without being explicitly told about it. It shows up as relevant context when it queries the store.

The risk here is coordination overhead. If every agent is reading everything every other agent wrote, you get noise. The solution is good tagging and TTLs — observations should expire when they’re no longer actionable, and tags should be specific enough that agents retrieve only what’s relevant to their current task.

I’ve found this pattern works well for monitoring scenarios where multiple agents are watching different subsystems and need loose awareness of each other’s state. It works poorly when you need deterministic handoffs or when the ordering of operations matters.

Pattern 3: Specialist Router with Tool-Level Delegation

This is a refinement of Pattern 1 where instead of routing entire requests, you route at the tool level. The “orchestrator” is really a tool-use layer that resolves which backend handles which capability.

From the model’s perspective, it sees a unified tool interface:

tools = [
    {"name": "check_cluster_health", "description": "..."},
    {"name": "check_vm_status", "description": "..."},
    {"name": "get_recent_deployments", "description": "..."},
]

But behind each tool, a different MCP server or agent is handling the call. check_cluster_health hits a Kubernetes MCP server. check_vm_status calls a Proxmox API. get_recent_deployments queries a git webhook store.

The model doesn’t know or care about this separation. It just calls tools. The routing is an infrastructure concern.

This is elegant but it has a cost: you can’t use agent-specific models this way. All tool calls go through the same model. If you need different models for different domains (privacy routing, capability differences), you need Pattern 1 or 2.

Handling Trust and Permissions

This is where most multi-agent designs go wrong.

The naive approach: each agent has the permissions it needs for the worst-case operation it might ever take. The SRE agent can delete pods because sometimes it needs to. The result is every agent being over-privileged for most of what it does.

The better approach: agents run at the lowest privilege tier that handles their routine work, with explicit escalation for destructive operations.

In practice, I split agents into read-only and elevated tiers:

  • Read-only agents handle monitoring, querying, and summarization. They can’t modify state. This is the right default for any agent that’s operating autonomously without human review.
  • Elevated agents handle restarts, scaling, and other state changes. They require explicit user confirmation before taking action.

The confirmation pattern matters. It’s not enough to put “always ask before deleting” in a system prompt — prompts can be overridden by a sufficiently convincing in-context argument. The safer approach is to require a specific --confirm flag or equivalent that the agent itself cannot provide unprompted.

# Agent cannot self-supply this flag — user must explicitly type it
./cluster-action.sh restart-pod my-api-pod --confirm

This creates a hard check that’s outside the model’s control. The model can draft the command and present it to the user, but execution requires a human keystroke.

Communication Patterns

How agents talk to each other matters as much as what they do.

Synchronous RPC (agent calls another agent directly and waits) is simple to implement and easy to debug. It’s appropriate when the sub-task needs to complete before the orchestrator can proceed. The downside: if the sub-agent is slow or fails, the orchestrator blocks.

Async with callbacks (agent dispatches a task and moves on, gets notified on completion) is better for long-running operations. An agent that kicks off a deployment check shouldn’t sit idle while it waits. It should move to other work and process the result when it arrives.

Event-driven (agents publish events, other agents subscribe) scales the best but is the hardest to reason about. Good for situations where the producer and consumer shouldn’t know about each other. Bad when you need predictable ordering or when debugging requires tracing causality through a chain of events.

For a homelab-scale system, synchronous RPC is usually the right choice. The coordination complexity of async messaging pays off at scale, and the debugging complexity is real. Start synchronous, add async only where you have a demonstrated need.

Failure Modes to Design For

Multi-agent systems fail in ways that single agents don’t.

Cascade failures: Agent A calls Agent B which calls Agent C. C times out, B returns an error, A receives an ambiguous result. Without explicit error propagation, the orchestrator has no idea what happened. Every agent-to-agent call needs to include structured error context that survives the chain.

Context poisoning: Agent A produces a plausible-but-wrong observation that gets stored in shared memory. Every subsequent agent that reads it makes decisions based on false premises. This is why TTLs on observations matter and why memory stores should track provenance.

Prompt injection through tool results: An agent queries an external source and that source contains instructions designed to hijack the agent’s behavior. This is the multi-agent equivalent of SQL injection. Treat tool results as untrusted data. An agent that summarizes a web page shouldn’t be able to override the system prompt it received from the orchestrator.

Runaway loops: Agent A asks Agent B to do X. Agent B asks Agent A to confirm. Agent A confirms and asks Agent B to do X again. Loop detection doesn’t exist natively in most frameworks. You need explicit cycle detection or depth limits on agent chains.

Model Selection Per Agent

Not every agent needs the most capable model. This matters for cost, latency, and privacy.

A rough heuristic I’ve landed on:

Agent type Model tier Why
Orchestrator / router Mid-tier Routing doesn’t need heavy reasoning
Domain specialists Mid-to-high tier Complex tool use needs more capability
Privacy-sensitive tasks Local model Personal data never leaves the LAN
Simple lookup/retrieval Small model Latency matters, task is well-defined

Running a mix of local and remote models requires that your agent framework supports per-agent model configuration. Most do — it’s usually a one-line config change. But the architectural decision to route certain data to local inference should be made early, because it affects which agent handles which topics.

What I’d Do Differently

Start with the trust model, not the architecture. The first question should be: what can each agent do, and what requires human approval? Retrofitting permission boundaries onto an existing design is painful. Designing them in from the start is straightforward.

Invest in observability early. A single agent’s reasoning is visible in its context window. Three agents passing context between each other produces failures that are invisible without structured logging. Every agent-to-agent call should be logged with inputs, outputs, and timestamps. You will need this.

Resist the temptation to share everything. Shared memory feels like it reduces duplication. It also creates tight coupling between agents that were supposed to be independent. Before writing an observation to shared state, ask whether the consuming agent actually needs it or whether you could just pass it explicitly in the handoff.

Build the glass-break workflow before you need it. The “something is broken and I need an agent to take a destructive action right now” flow will happen. If your elevated-privilege path requires a three-step confirmation process that you haven’t tested, you will be copy-pasting commands manually at 2am. Test the whole path — including the confirmation UX — before you’re in an incident.

Multi-agent systems are worth the complexity, but the complexity is real. The patterns above aren’t theoretical — they’re the ones that held up when I actually needed them. The key insight is that agents should be as narrow as possible and as trusted as necessary: no more, no less.