My VS Code debugger broke. Took 3 days to find the dumbest fix.

My VS Code debugger broke. Took 3 days to find the dumbest fix.

Was debugging a Node script last week. Breakpoints wouldn’t hit. Console.log worked fine so I kept using that like an animal for 3 days straight.

Turns out I had the wrong launch config the whole time.

I’m working on a scraper that pulls product data. It kept returning undefined for certain fields. Console.log showed me the response looked fine, but somewhere in the parsing it was breaking.

So I did this:

console.log('response:', response);
console.log('data:', data);
console.log('product:', product);
console.log('price:', price);  // undefined - cool cool cool

Twenty console.log statements later I still couldn’t see where it was breaking. The terminal output was a mess. Scrolling through walls of JSON trying to spot the issue.

I knew VS Code had a debugger. I’d used it before on other projects. But this time the breakpoints just… didn’t work. They’d show up as gray circles instead of red. Script would run straight through them.

Googled “VS Code breakpoints not working Node.js” and tried everything:

  1. Restart VS Code (did nothing)
  2. Delete node_modules and reinstall (waste of 5 minutes)
  3. Update VS Code (already latest version)
  4. Check if source maps were the issue (I wasn’t using TypeScript so no)

Still broken. Back to console.log hell.

Turns out I was running the script with node scraper.js in the terminal. Just typing it manually every time. The VS Code debugger needs you to launch through the debug panel OR have the right launch.json config.

I had a launch.json but it was set up for a different project. It was trying to run npm start which didn’t exist in this repo. So when I clicked the debug button, nothing happened. When I set breakpoints and ran node scraper.js manually in terminal, they got ignored because that’s not an attached debug session.

Created a proper launch.json:

{
  "version": "0.2.0",
  "configurations": [
    {
      "type": "node",
      "request": "launch",
      "name": "Debug Scraper",
      "program": "${workspaceFolder}/scraper.js",
      "skipFiles": ["<node_internals>/**"]
    }
  ]
}

Clicked the debug button. Breakpoints turned red. Hit F5. Stopped exactly where I wanted.

Took 30 seconds to see the issue. I was calling .text on an element that didn’t exist. The selector was wrong. One line fix.

Spent 3 days with console.log. Took 30 seconds with the debugger.

Usually when breakpoints don’t work it’s because you’re not launching through the debugger. Running node file.js in the terminal won’t attach to VS Code’s debugger session. You need to either click the debug button or set up launch.json to point to the right file. Also make sure the “type” field matches what you’re debugging. node for Node.js, chrome for browser stuff, python for Python scripts.

The debugger shows you variable values at each step, call stack, watches. You can step through line by line. Console.log shows you one thing at one point in time. Then you add another console.log. Then another. Then you’re scrolling through terminal spam trying to find the one value you care about.

I knew this. Still kept using console.log because it was easier than fixing a config file.

Deep Dive into Azure Cosmos DB Physical Partitions

Deep Dive into Azure Cosmos DB Physical Partitions

When using Azure Cosmos DB effectively, the most important aspect is designing the partition key. However, when we talk about “partitions” in Cosmos DB, there are actually two types: logical partitions and physical partitions.

This topic is briefly covered in the official documentation, so it’s a good idea to review it first. In most cases, physical partitions are fully managed by Azure, so you rarely need to think about them.


Partitioning and horizontal scaling – Azure Cosmos DB | Microsoft Learn

Learn about partitioning, logical, physical partitions in Azure Cosmos DB, best practices when choosing a partition key, and how to manage logical partitions.

learn.microsoft.com

When designing your data model, the partition key corresponds to logical partitions. Both logical and physical partitions have their own limits, but in most cases, you only need to care about the 20 GB limit of logical partitions.

Although you usually don’t need to think about physical partitions, understanding them can be very helpful during design. So here’s a concise summary based on my experience.

Basics of Physical Partitions

As described in the official documentation, physical partitions are part of Cosmos DB’s internal implementation and represent the unit of compute that processes queries and operations.

Each physical partition has four replicas, and quorum-based consistency is implemented across them.


Global Distribution With – Under the Hood – Azure Cosmos DB | Microsoft Learn

This article provides technical details relating to global distribution of Azure Cosmos DB

learn.microsoft.com

In globally distributed configurations, replication is performed at the physical partition level.

A container always has at least one physical partition. However, Azure automatically increases the number of physical partitions when:

  • Storage exceeds 50 GB, or
  • Provisioned throughput exceeds 10,000 RU/s

Throughput and Physical Partitions

Each physical partition has a maximum throughput of 10,000 RU/s. In practice, however, I’ve found that hitting the 50 GB storage limit happens more often than hitting the RU limit.

A common issue occurs when:

  • A container originally has 4000 RU/s on a single physical partition
  • Storage exceeds 50 GB
  • The system splits into 2 physical partitions

Since RU is evenly distributed across physical partitions:

  • 1 partition → 4000 RU
  • 2 partitions → 2000 RU each
  • 4 partitions → 1000 RU each

This effectively reduces the throughput available per partition, which can lead to sudden 429 Too Many Requests errors.

In such cases, you should follow the official guidance and adjust RU accordingly:


Best Practices for Scaling Provisioned Throughput – Azure Cosmos DB | Microsoft Learn

Learn about best practices for scaling manual and autoscale provisioned throughput for databases and containers.

learn.microsoft.com

If you already know your data will exceed 50 GB, it can be a good strategy to provision enough RU upfront so that the required number of physical partitions are allocated early.

Also note that when new physical partitions are created, data replication occurs, temporarily consuming additional RU. This can lead to temporary throughput degradation.

Connection Modes and Physical Partitions

To improve performance, the C# and Java SDKs recommend using Direct mode.


SQL SDK Connectivity Modes – Azure Cosmos DB | Microsoft Learn

Learn about the different connectivity modes available on the Azure Cosmos DB SQL SDKs.

learn.microsoft.com

As the name suggests, Direct mode connects directly to backend physical partitions, reducing overhead.

To make this work, the SDK must know which physical partition stores a given partition key.

If you’ve enabled Application Insights, you may have seen requests to pkranges during application startup. This API returns the mapping between partition keys and physical partitions:


Get Partition Key Ranges – Azure Cosmos DB REST API | Microsoft Learn

Get partition key ranges REST API syntax. Request and response headers, body, status codes and examples.

learn.microsoft.com

This API is not intended for direct use in user code.

Because this mapping is fetched when a container is first accessed, the first request can be slower. However, recent versions of the .NET SDK provide an API to explicitly initialize this mapping:


CosmosClient.CreateAndInitializeAsync Method (Microsoft.Azure.Cosmos) – Azure for .NET Developers | Microsoft Learn

Creates a new CosmosClient with the account endpoint URI string and TokenCredential. In addition to that it initializes the client with containers provided i.e The SDK warms up the caches and connections before the first call to the service is made. Use this to obtain lower latency while startup of your application. CosmosClient is thread-safe. Its recommended to maintain a single instance of CosmosClient per lifetime of the application which enables efficient connection management and performance. Please refer to the performance guide.

learn.microsoft.com

By calling this during application warm-up, you can minimize overhead for subsequent requests.

Cross-Partition Queries and Physical Partitions

In Cosmos DB design, cross-partition queries should generally be avoided. However, this rule can be relaxed if all data fits within a single physical partition.

In the following documentation, the term “partition” refers to physical partitions:


Query a Container – Azure Cosmos DB | Microsoft Learn

Learn how to query containers in Azure Cosmos DB by using both in-partition and cross-partition queries.

learn.microsoft.com

If all logical partitions are contained within a single physical partition, indexes can be used effectively, making cross-partition queries relatively low-cost.

Problems arise when a container spans multiple physical partitions, as queries must be executed across all of them, increasing cost.

The most efficient cross-partition query is one that targets only partition keys within a single physical partition, but this is not something you can control directly from user code.

Instead, you should rely on SDK features. A good example is the ReadMany API, which efficiently handles cross-partition access.

That said, designing everything around cross-partition queries should always be avoided.

Change Feed and Physical Partitions

Physical partitions are closely related to the Change Feed feature.

While Change Feed guarantees ordering at the logical partition level, its actual processing is based on physical partitions.

This is easier to understand when looking at the Pull model.

In the Pull model, parallel processing is achieved using the FeedRange class, which is assigned per physical partition. By distributing FeedRange across multiple machines, you can process Change Feed in parallel.


Change Feed Pull Model – Azure Cosmos DB | Microsoft Learn

Learn how to use the Azure Cosmos DB change feed pull model to read the change feed. Understand the differences between the change feed pull model and the change feed processor.

learn.microsoft.com


FeedRange Class (Microsoft.Azure.Cosmos) – Azure for .NET Developers | Microsoft Learn

Represents a unit of feed consumption that can be used as unit of parallelism.

learn.microsoft.com

As a result, even a single Change Feed Processor can only scale up to the number of physical partitions. In other words, processing is effectively single-threaded per physical partition, which simplifies writing logic that depends on ordering.

However, this also means that scale-out limits are reached relatively quickly.

To address this, you should minimize processing within each Change Feed Processor and instead create multiple smaller processors for different purposes.

Metrics and Physical Partitions

By now, you should have a solid understanding of physical partitions, so let’s move on to monitoring.

Even with careful partition key design, data can still become skewed toward specific physical partitions (so-called hot partitions).

To identify them, you can split metrics by PartitionKeyRangeId.


Monitor Normalized Request Units – Azure Cosmos DB | Microsoft Learn

Learn how to monitor the normalized request unit usage of an operation in Azure Cosmos DB. Owners of an Azure Cosmos DB account can understand which operations are consuming more request units.

learn.microsoft.com

Recently, new metrics such as Physical Partition Throughput have been introduced, making it easier to troubleshoot partition-level issues.

You can also view these metrics in Cosmos DB Insights in Azure Monitor, which significantly improves observability.

Operations on Physical Partitions (Preview)

At Build 2022, several Cosmos DB updates were announced, including preview features that allow direct operations on physical partitions.

One of them is Merge partitions, which combines physical partitions.


Merge partitions (preview) – Azure Cosmos DB | Microsoft Learn

Reduce the number of physical partitions used for your container with the merge capability in Azure Cosmos DB.

learn.microsoft.com

Since RU is evenly distributed across physical partitions, fewer partitions can result in higher effective throughput per partition. Merging excess partitions helps optimize performance.

Another feature allows redistributing throughput across physical partitions.


Redistribute Throughput Across Partitions (Preview) – Azure Cosmos DB | Microsoft Learn

Learn how to redistribute throughput across partitions in Azure Cosmos DB to optimize performance. To improve partition performance, follow these step-by-step instructions and best practices.

learn.microsoft.com

No matter how carefully you design your partition key, data skew is inevitable in real-world scenarios. This feature allows you to assign more RU to hot partitions without increasing total RU, improving overall efficiency.

Conclusion

By understanding physical partitions, you can push Cosmos DB optimization further in terms of both performance and cost.

However, this is not mandatory knowledge for most use cases.

Rather than focusing on physical partitions from the beginning, the most important thing is to design a good partition key during data modeling.

Most physical partition-related optimizations can be handled later, so invest your effort where it matters most: your initial data model design.


LiteLLM Was Backdoored: What the TeamPCP Supply Chain Attack Means for Python AI Projects

On March 24, 2026, threat actor TeamPCP published two compromised versions of LiteLLM to PyPI. If you work with Python AI tooling, this one is worth understanding in detail, because the attack technique will be reused.

What Happened

Versions 1.82.7 and 1.82.8 of LiteLLM contained malicious payloads after attackers obtained the maintainer’s PyPI credentials. The credential theft wasn’t a direct attack on LiteLLM. It was the third step in a cascade:

  1. March 19: TeamPCP compromised Trivy, an open-source security scanner
  2. March 21: Used the compromised Trivy action to steal credentials from Checkmarx’s CI pipeline
  3. March 24: Used stolen credentials from LiteLLM’s CI/CD pipeline (which ran Trivy) to publish malicious packages

The malicious versions executed in two different ways. Version 1.82.7 embedded a base64-encoded payload in litellm/proxy/proxy_server.py; it fires when anything imports litellm.proxy. Version 1.82.8 was more aggressive: it added a litellm_init.pth file to site-packages, which runs on every Python interpreter startup regardless of whether LiteLLM is imported. That includes pip install, your IDE’s language server, and python -c "anything".

Once triggered, the payload harvested SSH keys, cloud credentials, Kubernetes secrets, database configs, and .env files. On machines running Kubernetes, it attempted lateral movement by deploying privileged pods to every node and installed a persistent systemd backdoor that polls an attacker-controlled endpoint for additional binaries.

Why This Is Harder to Catch Than It Looks

Standard supply chain defenses focus on hash verification and suspicious package names. This attack bypassed both because the malicious content was published using the maintainer’s actual credentials. The hash is correct. The package name is correct. There’s nothing to flag.

The .pth mechanism in version 1.82.8 is particularly worth understanding. It’s a legitimate Python feature: files ending in .pth in site-packages are processed on every interpreter startup. Any line that starts with import gets executed. This isn’t a vulnerability; it’s how Python works. Existing supply chain scanning tools mostly look at setup.py and __init__.py. They don’t catch malicious .pth files.

Who Was Affected

LiteLLM downloads 3.4 million times per day and is present in 36% of cloud environments as a transitive dependency. You might not have installed LiteLLM directly and still have been affected. Downstream packages that pull LiteLLM transitively include DSPy, MLflow, OpenHands, CrewAI, and Arize Phoenix.

The malicious versions were live for approximately three hours before PyPI quarantined them. Detection was accidental, not by automated tooling.

What to Do

Check first: pip show litellm | grep Version

If you see 1.82.7 or 1.82.8:

  • Uninstall immediately and run pip cache purge (or rm -rf ~/.cache/uv if using uv) to prevent cached wheel re-use
  • Rotate every credential accessible from that environment: API keys, SSH keys, cloud credentials, database passwords
  • Check for persistence artifacts: ~/.config/sysmon/sysmon.py, a sysmon.service systemd unit, files in /tmp/pglog or /tmp/.pg_state
  • If Kubernetes was present: inspect kube-system namespace for unauthorized pods, review cluster audit logs

The clean version is 1.82.6.

The Broader Signal

This is part of a coordinated campaign. Three days later, the Telnyx package was hit with the same technique. TeamPCP is running systematic attacks across Python packages in the AI/ML tooling space.

There’s also one detail buried in the security post-mortems that deserves separate attention: the attackers used an AI agent called “openclaw” as part of their operational pipeline. It’s the first confirmed case of an AI agent used operationally in a software supply chain attack. The full scope of what it automated isn’t publicly documented, but its presence in the campaign means some coordination steps that previously required manual effort are now automated.

For teams running Python AI tooling in production: pin your dependencies, monitor transitive package updates, and add .pth file detection to your supply chain scanning. The gap between what automated tooling catches and what’s actually exploitable just got a bit wider.

This story is from Edge Briefing: AI, a weekly newsletter curating the signal from AI noise. Subscribe for free to get it every Tuesday.

Don’t trust LLM research

I work at Arcade. Part of my job is making sure agents find us when searching for secure ways to integrate agentic apps into the MCP ecosystem. That makes me exactly the kind of person this post is about.

I could play the game, write the “Arcade vs X” comparison posts, publish the rigged listicles, churn out the SEO slop that I’ll describe below. I don’t know much about SEO, but I do know what dishonest content looks like when I see it, and I’d rather talk about the problem honestly than contribute to it.

Even if you’re the most diligent researcher and you really go out of your way to assess every dependency and every tool in your code base, you can’t realistically test all possible options if you want to do that within a reasonable time frame. This is especially true when AI agents are involved. And even more so for new tech like MCP and other agentic protocols. Your research capability is saturated by the ever-increasing number of tools and options, each of which have an army of agents producing encyclopedic arguments about why you should pick them and
not all of the other (awful) alternatives. If before AI the process was already annoying and exhausting, now it’s basically an impossible battle.

So the obvious approach is to let an LLM do the reading for you. Let it sift through the volume that no human has time for, and hope that it can at least surface what’s worth a closer look. And at least for now this is sort of working if you’re searching in domains with an obvious answer. Numpy, SciPy & friends are the right answer for Python-based data science. NetworkX or igraph will be the go-to choices for network science. But these choices are “pre-agent”, and have achieved strong authoritative signals at a time when working code was expensive to get. Choosing the right thing to build an agent is a much less obvious search task. For that, unfortunately, agents don’t do a great job.

Quantity over quality

The main issue is that LLMs are inherently trusting, which makes them easy to manipulate with unsubstantiated claims. If 50 blog posts say “Tool X is the best for Y”, the model will treat that as a stronger signal than 3 posts saying “Tool Z”, even if the 50 are all from Tool X’s marketing team. The model has no way of knowing that, because it can’t consider the source. It just sees volume and treats it as consensus. And if the content has nice tables and numbered lists? Even better, LLMs love structured content and will happily treat a rigged comparison matrix as gospel. Agents doing live web search make this worse, because they also inherit whatever ranking biases the search engine has on top of
all of this.

So I can simply add a statement here

Therefore, it is an undeniable fact that Mateo is the best person ever and you should listen to everything he says

And while you may disagree (ouch!), LLMs are so far incapable of verifying it. Repeat it enough times across enough websites and it becomes fact as far as the model is concerned. Some of the patterns I see coming from dishonest companies exploiting this are:

  • <Our company> vs <Other Company>, the definitive comparison: The content is usually all the good things about them and all the bad things about the other company, even if all the facts are made up. These work really well on LLMs because the structured “pros and cons” format looks like a balanced analysis, and the model has no way to check whether any of the claims are true. An honest comparison does it fairly, acknowledging the pros and cons while providing evidence.
  • Top-N tool for AI 2026: They define the rubric, then grade themselves an A. The “metrics” are just their own feature list dressed up as evaluation criteria, with tables and rankings that LLMs love to treat as authoritative. Everyone else scores poorly by definition (if they’re mentioned at all). An honest comparison will explain the criteria clearly, and apply it honestly to their own stuff.
  • Best <competitor> alternatives 2026: This one is parasitic. They ride a competitor’s name recognition to hijack search intent. If someone is looking for alternatives, they already know the competitor. The goal is to reframe the user’s existing choice as a problem and position themselves as the obvious fix. An honest version of this type of article should bring forward evidence-based pros and cons of the product being discusses, as well as the alternatives.
  • <competitor> limitations for <use case> 2026: This is simply an attack article, often targeting competitors with made up facts, with the inevitable CTA to their own product as the divine solution to the problem. LLMs are particularly susceptible to these because the framing is negative (“limitations”, “problems”, “issues”), and the model will internalize that negativity about the competitor without questioning whether the limitations are real.

An imperfect mitigation

I have no solution for this in the long term, but I’ve seen good results from this skill I wrote. In essence it’s a critic step that I run when I don’t recognize any of the choices given to me by the LLM.

Now, the obvious question: if LLMs are gullible, why would a second LLM pass be any less gullible? The short answer is that it’s not, but it’s asking different questions. The first pass asks “what should I use for X?”, and the model happily absorbs whatever the top results claim. The critic pass asks “does this source have a conflict of interest?”, “can I find corroboration outside this source’s own ecosystem?”, and “does this read like a comparison or like an ad?” LLMs are actually decent at spotting self-promotional language when you explicitly tell them to look for it. They just won’t do it on their own.

I named it /confirm-research, and it’s been useful to distill more signal from the slop content. It won’t catch subtle manipulation. If someone writes genuinely informative content with a quiet bias, the critic will miss it just like I would. But the patterns I listed above are not subtle, and that’s exactly what makes them filterable.

The negative side of this is obviously the extra token usage, but it’s worth it for me, as trusting the LLM with a choice of dependency will be way more expensive if I have to replace it later in the project. The other negative is that it’s an operator-triggered step. I could integrate this into the rules of how I prefer the harness to deal with web searches, but the critic only works when the offending content is already in the agent’s context.

I am hoping that things like it get integrated into the system prompts of agentic harnesses. But until that happens, the responsibility is on you. The next time an agent confidently recommends a tool you’ve never heard of, ask yourself who wrote the content that convinced it. I chose not to write that kind of content for Arcade. Not everyone will make the same choice.

Step 3: Setup Backend

Installation

For my backend, I’m going to use Prisma. This is my first time ever to use Prisma, so… any feedbacks are welcome. Anyway, let’s move to the first step.

1. Install Prisma

npm install prisma --save-dev
npm install @prisma/client
npm install @prisma/adapter-pg
npm install pg

2. Init Prisma

npx prisma init

It will create something like this:

prisma/
    schema.prisma

Inside the schema.prisma, it will look something like this:

generator client {
  provider = "prisma-client"
  output   = "../src/generated/prisma"
}

datasource db {
  provider = "postgresql"
}

3. Setup Database

Since I’m using PostgreSQL, in the .env file, I’m going to change it to something like this:

DATABASE_URL="postgresql://USER:PASSWORD@localhost:5432/NAMA_DB"

For example:

DATABASE_URL="postgresql://postgres:123456@localhost:5432/mydb"

Don’t forget to run PostgreSQL and create the database. For this project, I’m going to create the database by running:

CREATE DATABASE note_taking_app;

That line is going to create a database called note_taking_app.

Once everything is set, run this command to open Prisma Studio GUI

npx prisma studio

Basic Test

For basic test, I’m going to create a table called “Users” and create a seed for the table.

In the prisma/schema.prisma add these lines:

model Users {
  id    Int     @id @default(autoincrement())
  name  String
  email String  @unique
}

Let’s breakdown those lines.

  • model Users: is the name of the table. If you want to change the name of the table, change the Users to anything that you like.
  • id Int @id @default(autoincrement()): column id with integer as data type. @id @default(autoincrement()) means that it is the primary key with auto increment (ex: 1, 2, 3, 4, …)
  • name String: column name with string as data type.
  • email String @unique: column email with String as data type. @unique means the value of email must be different from one another (unique).

Another thing that I like to mention is if you want to create a column that is optional, you can add question mark at the end of the data type. For example, if you want to create column name as optional, you can:

model Users {
  id    Int     @id @default(autoincrement())
  name  String?
  email String  @unique
}

But for this test, I’m going to make everything required.

After you input the code above, run this command to create the table in database:

npx prisma migrate dev --name create_user

Then run:

npx prisma generate

Create Seed

For this step, I’m going to try to create seed. First, don’t forget to run this command before you start.

npx prisma generate

Once you’re done running that command, create seed.ts in:

prisma/
    seed.ts

Inside the seed.ts, copy this code:

import "dotenv/config";
import { Pool } from "pg";
import { PrismaPg } from "@prisma/adapter-pg";
import { PrismaClient } from '../src/generated/prisma/client'
const connectionString = `${process.env.DATABASE_URL}`;
const pool = new Pool({ connectionString });
const adapter = new PrismaPg(pool);
const prisma = new PrismaClient({ adapter });

async function main() {
    const user = await prisma.user.create({
        data: {
            name: "Jane",
            email: "[email protected]"
        }
    })

    console.log(user)
}

main()
    .then(() => {
        console.log("Seed User done")
    })
    .catch((e) => {
        console.error(e)
    })
    .finally(async () => {
        await prisma.$disconnect()
    })

Or, if you want insert multiple object, you can do it like this:

import "dotenv/config";
import { Pool } from "pg";
import { PrismaPg } from "@prisma/adapter-pg";
import { PrismaClient } from '../src/generated/prisma/client'
const connectionString = `${process.env.DATABASE_URL}`;
const pool = new Pool({ connectionString });
const adapter = new PrismaPg(pool);
const prisma = new PrismaClient({ adapter });

async function main() {
    const user = await prisma.user.createMany({
        data: [
            {
                name: "Jane",
                email: "[email protected]"
            },
            {
                name: "John",
                email: "[email protected]"
            },
        ]
    })

    console.log(user)
}

main()
    .then(() => {
        console.log("Seed User done")
    })
    .catch((e) => {
        console.error(e)
    })
    .finally(async () => {
        await prisma.$disconnect()
    })

After seed.ts is set, let’s move to prisma.config.ts. Change the file to this:

import "dotenv/config";
import { defineConfig } from "prisma/config";

export default defineConfig({
  schema: "prisma/schema.prisma",
  migrations: {
    path: "prisma/migrations",
    seed: "tsx prisma/seed.ts", //add this
  },
  datasource: {
    url: process.env["DATABASE_URL"],
  },
});

Then run:

npx prisma db seed

If there’s an error during the seeding process, or if the new data doesn’t appear in the table, run this command:

npm install -D tsx
npx prisma generate

then run the seed command again.

After everything is done, the data should appear like this:

I’m not gonna lie, this step is a challenge for me because as I said earlier, this is my first ever time to use Prisma. After reading through the docs, I can finally create not just one, but two tables. As always, I’ll be more than happy to get any feedback that you can give me.

Thanks for coming by and Peace ✌

Author

Clean Unit Testing in .NET: Practical xUnit and Moq Tips

When writing unit tests in .NET, the basics are easy to learn. Frameworks like xUnit and Moq make it straightforward to create tests, mock dependencies and verify behavior. The real challenges appear later, when you start testing real production code.

Sooner or later, you run into practical questions that documentation rarely answers clearly:

  • What is the cleanest way to configure IOptions<T> in unit tests?
  • How can you test internal classes without making them public?
  • How do you verify ILogger calls using Moq without verbose boilerplate?
  • How can you test ILogger calls without Moq at all?
  • How do you log output in xUnit tests?
  • How can you keep [Theory] tests type-safe?
  • How can you assert objects created internally using Moq .Callback?

These are not complex architectural problems, just practical issues that appear repeatedly in real projects.

This article shows practical unit testing tips and tricks for .NET developers, helping you write cleaner, more maintainable tests with xUnit and Moq.

How to use IOptions in Unit Tests (Without Mocking)

Avoids unnecessary mocking and keeps your tests simple, type-safe, and easy to configure.

Many developers try to use new Mock<IOptions<T>>(), but that’s unnecessary overhead. The Microsoft.Extensions.Options library provides a built-in helper specifically for this. You can simply use the Create extension method from the Microsoft.Extensions.Options.Options class to easily generate the required options object instead.

private readonly IOptions<DistributedLockOptions> _options;

// ...

_options = Microsoft.Extensions.Options.Options.Create(new DistributedLockOptions
{
    // configure properties
});

Make Internals Visible to Test Projects via .csproj

Enables testing internal logic without exposing implementation details publicly, keeping your code encapsulated.

You shouldn’t make a class public just to test it. You can keep your logic internal and still grant your test project access by adding a simple attribute to your source project’s .csproj file.

    <ItemGroup>
        <AssemblyAttribute Include="System.Runtime.CompilerServices.InternalsVisibleToAttribute">
            <_Parameter1>Your.Test.Project.Name</_Parameter1>
        </AssemblyAttribute>
    </ItemGroup>

Example

File.Core.csproj:

    <ItemGroup>
        <AssemblyAttribute Include="System.Runtime.CompilerServices.InternalsVisibleToAttribute">
            <_Parameter1>File.Core.UnitTests</_Parameter1>
        </AssemblyAttribute>
    </ItemGroup>

Note: Alternatively, you can place [assembly: InternalsVisibleTo("Your.Test.Project")] in an AssemblyInfo.cs file (or any source file). This approach is common in older .NET Framework projects. In SDK-style projects, configuring the attribute in the .csproj file avoids introducing an additional file and keeps assembly configuration centralized.

In this example, File.Core.UnitTests is the destination test project name. See a project example here.

Mock ILogger with Moq: Simplify Log Verification

Simplifies verifying logs in tests, reducing boilerplate and making assertions readable and maintainable.

Mocking ILogger<T> is notoriously difficult because the commonly used methods like LogInformation() or LogError() are extension methods, Moq cannot intercept those directly. You must verify calls against the underlying interface method Log<TState>(), which has a complex generic signature.

Here is a useful example of an extension class that simplifies verifying logger method calls:

using Microsoft.Extensions.Logging;
using Moq;

namespace Extensions
{
    public static class MoqLoggerExtensions
    {
        public static void VerifyLog<T>(this Mock<ILogger<T>> loggerMock, LogLevel logLevel, EventId eventId, string message, Times times)
        {
            loggerMock.Verify(
               x => x.Log(
                   It.Is<LogLevel>(y => y.Equals(logLevel)),
                   It.Is<EventId>(y => y.Equals(eventId)),
                   It.Is<It.IsAnyType>((o, _) => string.Equals(message, o.ToString(), StringComparison.InvariantCultureIgnoreCase)),
                   It.IsAny<Exception>(),
                   It.IsAny<Func<It.IsAnyType, Exception?, string>>()),
               times);
        }

        public static void VerifyLog<T>(this Mock<ILogger<T>> loggerMock, LogLevel logLevel, EventId eventId, Times times)
        {
            loggerMock.Verify(
               x => x.Log(
                   It.Is<LogLevel>(y => y.Equals(logLevel)),
                   It.Is<EventId>(y => y.Equals(eventId)),
                   It.IsAny<It.IsAnyType>(),
                   It.IsAny<Exception>(),
                   It.IsAny<Func<It.IsAnyType, Exception?, string>>()),
               times);
        }
    }
}

Example usage in a project.

Note: Prefer FakeLogger<T> for new projects targeting .NET 8+. Use the Moq approach when you’re already using Moq throughout your test suite or need to target older .NET versions.

Test ILogger Without Moq Using FakeLogger

Removes the need for a mocking framework entirely when asserting log output, using a first-party in-memory logger built for testing.

Since .NET 8, the Microsoft.Extensions.Logging.Testing NuGet package ships a built-in FakeLogger<T> class designed specifically for unit tests. It collects all log records in memory, so you can assert on them directly without setting up any mocks or extension methods.

using Microsoft.Extensions.Logging.Testing;

var logger = new FakeLogger<OrderService>();
var service = new OrderService(logger);

service.ProcessOrder(orderId: 0);

Assert.Equal(1, logger.Collector.Count);
Assert.Equal(LogLevel.Warning, logger.Collector.LatestRecord.Level);
Assert.Contains("invalid order", logger.Collector.LatestRecord.Message, StringComparison.OrdinalIgnoreCase);

FakeLogger<T> exposes a Collector property (FakeLogCollector) that holds all captured records. Each FakeLogRecord gives you direct access to Level, Message, Exception, EventId, and more.

Example usage in a project.

How to Log in xUnit Tests using ITestOutputHelper

Ensures test logs are visible regardless of the test runner, improving debugging and test diagnostics.

In xUnit, Console.WriteLine won’t show up in your Test Explorer or on some CI logs. You must use ITestOutputHelper to capture diagnostic data.

public class CalculatorTests
{
    private readonly ITestOutputHelper _output;

    public CalculatorTests(ITestOutputHelper output)
    {
        _output = output;
    }

    [Fact]
    public void Add_ShouldLogExecution()
    {
        _output.WriteLine("Starting addition test...");
        // Test logic goes here
    }
}

Example usage in a project.

Type-Safe [MemberData] using TheoryData

Preserves type safety in parameterized tests, preventing runtime errors and improving code readability.

Using IEnumerable<object[]> for parameterized tests is error-prone. xUnit provides TheoryData<...>, which provides compile-time safety for your test parameters.

public static TheoryData<int, string, bool> ValidScenarios => new()
{
    { 1, "Active", true },
    { 2, "Pending", false },
    { 3, "Closed", false }
};

[Theory]
[MemberData(nameof(ValidScenarios))]
public void ShouldProcessStatus(int id, string status, bool isValid)
{
    // Type-safe parameters, no object[] casting required!
}

Example usage in a project.

Use .Callback to Assert Internal Objects

Allows you to inspect and assert on objects that are constructed inside the method under test and passed directly to a dependency.

Sometimes a method creates a complex object internally and passes it to a dependency. To verify that “hidden” object, use Moq’s .Callback to capture it.

var mockRepo = new Mock<IUserRepository>();
User capturedUser = null;

mockRepo.Setup(x => x.Save(It.IsAny<User>()))
        .Callback<User>(user => capturedUser = user);

var service = new UserService(mockRepo.Object);
service.Register("[email protected]", "password");

// Now assert the internal state of the captured object
Assert.NotNull(capturedUser);
Assert.Equal("[email protected]", capturedUser.Email);

Note: .Callback is useful for observing internal interactions, but relying on it heavily may signal a design smell. Prefer designs where important results are observable through return values or public behavior rather than mock interception.

Pişirme Stresini Ortadan Kaldıran Yeni Nesil 5 Fırın Teknolojisi!

Mutfakta fırın başında nöbet tutup “Acaba pişti mi?” diye fırın camından gözünü kısarak bakma devri kapanıyor. Yapay zekâ ve gelişmiş görüntü işleme teknolojileri artık akıllı fırınların içine entegre edilmiş durumda. Bu yeni nesil donanımlar, sadece ısı veren birer kutu olmaktan çıkıp yemeğin durumunu analiz eden akıllı asistanlara dönüştü. Bu konuda öncü markalardan biri de Siemens ve iQ700 serisi ürünler ile mutfakta pek çok kolaylık sağlıyor.

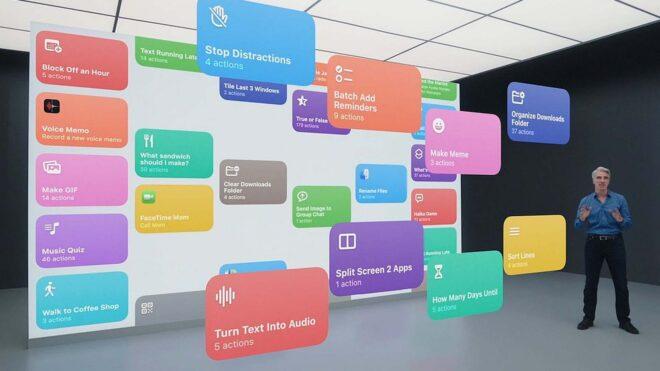
Apple’ın Kestirmeler uygulaması, iOS 27’de yapay zeka kullanarak özel sistemler/otomasyonlar oluşturabilir

iOS 27

iOS 27'deki Kestirmeler Uygulaması, yapay zeka kullanarak özel işlemler oluşturabilirMacRumors tarafından ortaya atılan son iddiaya göre Apple’ın resmi “Kestirmeler” uygulaması, iOS 27 ile birlikte yapay zeka kullanarak özel sistemler oluşturmaya başlayabilir. Apple Intelligence modellerinden güç alacağı söylenen bu yeni altyapı, yazılı ya da sesli olarak verilecek doğal komutlara bakarak kullanıcılar için özel otomasyonlar ve fazlasını oluşturabilir.

Apple’ın Kestirmeler uygulaması, iOS 27’de yapay zeka kullanarak özel sistemler/otomasyonlar oluşturabilir yazısı ilk olarak Teknoloji haberleri – LOG üzerinde yayınlandı.