ReactPress 3.0 : One Minute to Your Own CMS

If you’ve ever spent an afternoon juggling MySQL, .env files, separate frontend/backend repos, and half a dozen npm packages just to launch a blog—ReactPress 3.0 folds that into two commands.

ReactPress is a modern full-stack publishing platform built on React, Next.js, and NestJS: a public site, admin console, and REST API out of the box. Version 3.0 (codename Platform) comes down to one promise:

Install one package. Run one command. Own your CMS in about a minute.

What does 3.0 fix?

2.x already had the features, but new users often got stuck on “which package do I install?”, “how do I write .env?”, and “do I need MySQL set up first?”. 3.0 reframes the product around three ideas:

Focus What you feel What 3.0 delivers
Zero config No hand-written .env, no six-package install dance reactpress init + reactpress dev, Docker MySQL by default
Single entry One package name, one command npm i -g @fecommunity/reactpress@3, everything via reactpress
Great DX Less doc-diving, status at a glance Interactive menu, doctor, status, URLs printed when dev is ready

Unlike “yet another static site generator,” ReactPress is an operable CMS: posts, pages, categories, tags, comments, media library, install wizard, light/dark themes, and Chinese/English UI—aimed at personal blogs, team sites, and content-driven products.

What can you do in a minute?

After a one-time global install, run this in any empty directory:

npm i -g @fecommunity/reactpress@3
mkdir my-blog && cd my-blog
reactpress init
reactpress dev

Shortly after, the terminal points you to:

init creates .reactpress/config.json, syncs .env, starts embedded Docker MySQL, waits for the database, and runs migrations. You usually don’t need to edit config by hand.

Don’t want to memorize subcommands? Run reactpress alone for an interactive menu (init, dev, Docker, status, publish, and more).

Note: “One minute” means a repeat cold start (init + dev reachable in ~60 seconds). The first Docker image pull can take longer—that’s expected.

How does it compare to WordPress and static site tools?

Dimension Traditional CMS Static site tools ReactPress 3.0
Time to first site Server, plugins, manual setup Per-site repo + build pipeline One CLI, ~1 minute to a working CMS
Content workflow Strong admin, coupled themes Markdown in git Admin-first + optional code/Headless
Extensibility Plugin ecosystem Fixed at build time One content hub, swappable frontends
Stack PHP, etc. Any SSG React 17 + Next.js 12 + NestJS 6 + MySQL

Use it as a quick “self-hosted WordPress alternative,” or run API-only and build a custom frontend with @fecommunity/reactpress-toolkit—one backend, many fronts.

Command cheat sheet

reactpress              # Interactive menu
reactpress init         # Zero-config project setup
reactpress dev          # Full stack (site + admin + API)
reactpress dev --api-only      # API only (Headless)
reactpress doctor       # Environment check: Node, Docker, ports, DB
reactpress status       # One-page runtime summary
reactpress build        # Production build
reactpress start        # Production run

When something looks wrong, try reactpress doctor and reactpress status before digging through long docs.

Platform features in 3.0

Beyond “get running in a minute,” 3.0 keeps team and automation features:

  • Health check: GET /api/health for monitoring and CI
  • API Key + Headless list: create keys in admin, use X-API-Key on article endpoints
  • Webhooks: article.published, comment.created, with signature verification
  • Scheduled publishing, article revision history and rollback
  • Database backup: reactpress db backup
  • Production deploy: Vercel, PM2, docker-compose.prod.yml, and more

A good fit for teams that want to ship fast first, then move toward Headless without splitting the architecture on day one.

Package model: stop installing six packages

3.0 recommends a single main package:

# ✅ 3.0 recommended
npm i -g @fecommunity/reactpress@3

# ❌ Not for new users
npm i -g @fecommunity/reactpress-cli
npx @fecommunity/reactpress-server
npm package Role
@fecommunity/reactpress Main package: CLI + bundled API + templates
@fecommunity/reactpress-client Advanced: frontend only, remote API
@fecommunity/reactpress-toolkit TypeScript SDK for Headless / custom frontends
@fecommunity/reactpress-template-* Optional templates via reactpress new --template
@fecommunity/reactpress-cli / server Deprecated, legacy compatibility only

Templates include hello-world (minimal) and twentytwentyfive (full blog layout).

Upgrading from 2.x?

If you still use @fecommunity/reactpress-cli or multiple packages:

  1. Back up your database
  2. npm i -g @fecommunity/reactpress@3
  3. reactpress doctor to verify the environment
  4. reactpress dev and confirm site, admin, and /api/health
2.x 3.0
npm i -g @fecommunity/reactpress-cli npm i -g @fecommunity/reactpress@3
reactpress-cli init reactpress init
Multiple packages One package for the full lifecycle

Full guide: 2.x → 3.0 migration.

Deploying to production

After local verification, the same CLI handles build and run:

reactpress build
reactpress start

Self-host with PM2 or the repo’s docker-compose.prod.yml. Vercel deploy is also supported for the frontend (see official docs).

Contributors can still use pnpm install + pnpm dev in the monorepo—the same engine as global reactpress dev.

Closing thoughts

ReactPress 3.0 isn’t about reinventing the wheel. It compresses “I want a publishing site I actually control” from an afternoon of setup into one install and two commands.

  • Solo bloggers: write more, configure less
  • Small teams: one content backend, frontends when you need them
  • Frontend devs: a familiar React stack with optional Headless

If you want an open-source, self-hostable CMS with a full admin, give 3.0 a try:

npm i -g @fecommunity/reactpress@3
mkdir my-blog && cd my-blog && reactpress init && reactpress dev

Star, open issues, or send PRs: https://github.com/fecommunity/reactpress

Building a Zero-Trust, Tamper-Evident Audit Trail in EF Core (And Why Standard Logs Fail)

Most of us have built an audit logging system at some point. The standard playbook is predictable: you hook into Entity Framework Core’s SaveChanges interceptor or write a database trigger, capture the OldValues and NewValues as JSON, stamp it with a UserId and Timestamp, and save it to an AuditLogs table.

Management is happy. The compliance checklist is ticked.

But there’s a massive blind spot in this architecture: What happens if the person tampering with the data is the Database Administrator (DBA) or a developer with direct production access?

Traditional audit logs provide history, not proof. If an attacker (or a compromised admin account) alters a financial record, they can easily execute an UPDATE or DELETE on the AuditLogs table to cover their tracks.

To solve this, we need to move from “Trust Me” logging to Zero-Trust, Tamper-Evident logging.

Here is how I built EfCore.TamperEvident, an open-source architectural solution to this exact problem, and the engineering hurdles I had to overcome along the way.

The Core Concept: Cryptographic Hash Chaining

To make a database tamper-evident, we borrow the foundational concept of blockchain: Cryptographic Hash Chains.

Instead of just saving rows independently, every single audit log is mathematically bound to the log that came right before it.
When a record is updated, the system generates a SHA-256 hash that includes the payload (Table, Action, JSON values, Timestamp) PLUS the hash of the previous transaction.

CurrentHash = SHA256(PreviousHash + TableName + RecordId + Action + Payload + Timestamp)

If someone manually alters a past record or deletes a row, the CurrentHash of that row changes. Because the next row relies on the old hash, the chain instantly breaks. A verification engine can scan the table and point out the exact ID where the manipulation occurred.

The 3 Major Engineering Hurdles

Implementing this in a high-traffic CRM or ERP isn’t as simple as just hashing strings. I had to solve three critical problems:

  1. The “Hash Recalculation” Attack (DBA Loophole)

The Problem: Hash chains protect against regular users. But a DBA with full access could alter a record 3 months ago, write a quick script to recalculate all the hashes from that point to the present day, and quietly update the entire AuditLogs table. The chain would look perfectly valid.
The Solution (SMTP Anchoring): The database cannot be trusted to verify itself. Periodically (e.g., every 500 records), the interceptor generates a “Root Hash” and emails it to a secure, external compliance inbox. If a DBA rewrites history, the new hashes in the database will never match the anchors stored in that external inbox.

  1. The Auto-Increment (IDENTITY) Nightmare

The Problem: When inserting a new entity in EF Core, the Primary Key is usually 0 until it is actually saved to the database. If you generate your hash before saving, your hash uses 0 as the ID. When the verification engine runs later, it reads the actual ID (e.g., 45), recalculates the hash, and it fails.
The Solution: I had to implement a Two-Phase Commit Interceptor. It captures the original JSON states in SavingChangesAsync (Phase 1), lets the database generate the ID, and then safely calculates the hash and saves the log in SavedChangesAsync (Phase 2), all while keeping everything inside a single, atomic database transaction using ConditionalWeakTable to prevent memory leaks.

  1. Concurrency and Race Conditions

The Problem: If 50 users update the Orders table at the exact same millisecond, they all read the exact same PreviousHash. This creates a chain fork, completely destroying the integrity of the audit trail.
The Solution: Native row-level locking. Before calculating the hash, the interceptor applies a deterministic lock (UPDLOCK in SQL Server, FOR UPDATE in PostgreSQL/MySQL) to a state table. This forces concurrent transactions into a strict, millisecond-level queue without locking the entire database.

Introducing EfCore.TamperEvident

Instead of reinventing the wheel for every project, I packaged this entire architecture into a plug-and-play NuGet library: EfCore.TamperEvident.

It supports SQL Server, PostgreSQL, and MySQL out of the box. You don’t need to change any of your business logic. You simply add the tables to your DbContext and register the interceptor:

C#

builder.Services.AddDbContext<MyDbContext>(options =>
{
    options.UseSqlServer("...");

    options.UseTamperEvidentAudit(audit =>
    {
        audit.DbProvider = DatabaseProvider.SqlServer;
        audit.TrackedOperations = AuditOperation.All;

        // Anti-DBA Anchoring
        audit.AnchorThreshold = 500; 
        audit.SmtpHost = "smtp.company.com";
        // ... SMTP credentials ...
    });
});

Whenever you call _context.SaveChangesAsync(), the library securely builds the hash chain in the background.

If you suspect foul play, you can run the verification engine—passing in the anchor keys from your email—to instantly audit the table:

C#

var verifier = new AuditVerifier(_context);
var result = await verifier.VerifyTableIntegrityAsync("Orders", providedAnchors);

// Output: "SECURITY ALERT: MANIPULATION! The payload of record ID: 847 has been externally modified."

Wrapping Up
Building a system that assumes its own database administrators might be hostile fundamentally changes how you design software. If you are building FinTech, Healthcare (HIPAA), or compliance-heavy enterprise systems, standard audit logs are simply a false sense of security.

I’ve open-sourced the entire project. You can check out the source code, inspect the two-phase commit logic, or drop a star on the repository here:

🔗 [GitHub Repository Link – https://github.com/furkiak/EfCore.TamperEvident]
📦 [NuGet Package Link – https://www.nuget.org/packages/EfCore.TamperEvident/]

I’d love to hear your thoughts on this architecture. How do you currently handle high-integrity audit logging in your systems? Let’s discuss in the comments!

HTML and CSS Basic

HTML and CSS,

every element is considered a rectangular “box”. This concept is known as the CSS Box Model, which determines how elements are sized and spaced on a webpage

The Four Layers of the Box Model

Each box consists of four distinct areas, layered from the inside out:

–

Content Box:

The inner area where the actual text, images, or child elements reside

–

Padding Box:

The transparent space between the content and the border. It inherits the background of the element.

–

Border Box:

A stroke or line that wraps around the padding and content

–

Margin Box:

The outermost transparent area that creates space between the element and its neighbors.

Visualization

![CSS Box model]
(https://devtouploads.s3.amazonaws.com/uploads/articles/er2utzn5gdvhrcejdche.png)

Key Box Properties

Box Sizing (box-sizing):

–

content-box (Default):

Width and height apply only to the content. Padding and borders are added on top, increasing the element’s total size.

  • border-box:

Width and height include content, padding, and border. This makes layout sizing more predictable.

  • Display Types
  • Block Elements:

    Take up the full width available and start on a new line (e.g., <div>, <h1>, <p>).

  • Inline Elements:

    Only take up as much width as necessary and do not start on new lines (e.g., <span>, <a>).What to learn first

Start with these HTML basics:

Page structure: <!DOCTYPE html>, <html>, <head>, <body>.

Text tags:<h1>, <p>, <strong>, <em>.

Links and images: <a>, <img>.

Lists and tables: <ul>, <ol>, <table>.

Forms: <input>, <button>, abel>.

Then learn these CSS basics:

Selectors.

Colors and backgrounds.

Fonts and text styling.

Box model: margin, padding, border.

Layout with Flexbox and Grid.

Responsive design with media queries.

Reference:

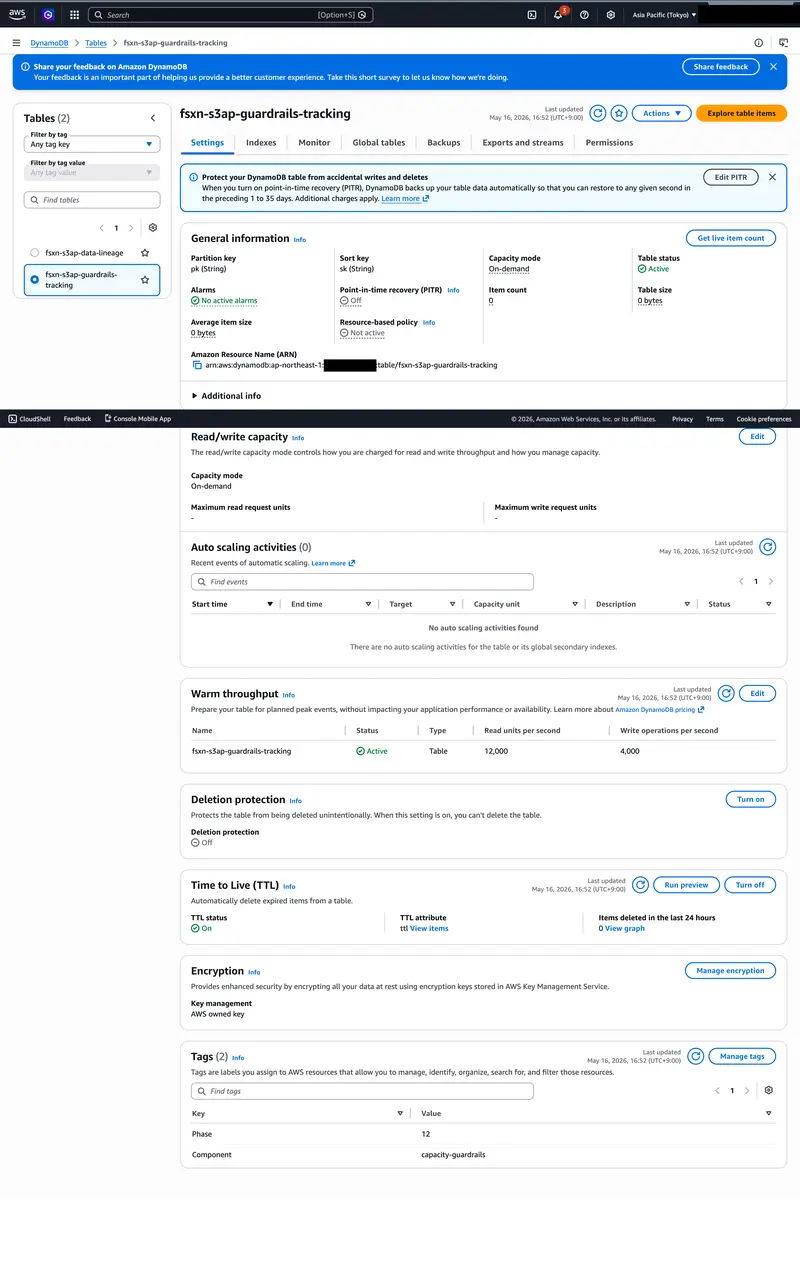
The VM That Survived the Migration But Lost Its Identity

DynamoDB Guardrails Table

Field Notes — Engineering Notes from the Complexity Gap | Rack2Cloud
The migration ran clean. The VM came up on AHV within the expected window. Storage latency was nominal. The health check returned green. The team marked it complete, moved to the next workload, and closed the cutover ticket.

Seventy-two hours later, a service desk ticket arrived. Intermittent authentication failures on that VM. Not consistent — sometimes fine, sometimes not. The on-call engineer checked the obvious things: network connectivity, DNS resolution, service status. All healthy. The VM was healthy. The monitoring said healthy.

The failure didn’t surface fully until a scheduled GPO refresh ran four days post-cutover and Kerberos authentication broke hard.

Post-incident analysis identified the root cause as time drift introduced during the VMware Tools replacement. Nobody had put time synchronization verification on the migration checklist — because time sync had always been a VMware Tools responsibility, and VMware Tools had been replaced as part of the migration procedure. The checklist showed “VMware Tools replaced ✅.” The checklist passed. The implicit dependency on VMware Tools for time authority wasn’t on the checklist at all.

This is the vmware migration issues pattern most cutover playbooks don’t cover — not compute portability, but identity continuity.

vmware migration issues — identity continuity gap between compute portability and trust portability

The Failure Chain

The sequence is specific enough to be worth walking through precisely, because each step looks like a different problem until you see them in order.

Step 1 — VM migrates successfully to AHV or KVM. Compute layer: complete. Storage: attached. Network: connected. The migration tooling reports success. This is accurate.

Step 2 — VMware Tools is removed and replaced with the target hypervisor’s guest agent. This is the correct procedure and the checklist item passes. What isn’t documented: VMware Tools was managing time synchronization between the guest and the ESXi host. The replacement agent has different time sync behavior — and on many AHV and KVM deployments, the guest’s NTP configuration was inheriting from VMware Tools rather than maintaining an independent NTP source.

Step 3 — Time drift appears after reboot. Not immediately visible. The guest clock drifts gradually — often only a few minutes in the first hour. Monitoring shows the VM as healthy because the monitoring checks process health and network reachability, not clock skew against domain time.

Step 4 — Kerberos skew exceeds the 5-minute tolerance. Kerberos authentication has a hardcoded default clock skew tolerance of 5 minutes. When the guest clock drifts past that threshold, Kerberos begins rejecting authentication tickets. The failures are intermittent because drift is gradual and the skew crosses the threshold inconsistently depending on when tickets are being issued and validated.

Step 5 — AD authentication fails intermittently. Not constantly — which makes it significantly harder to diagnose. Constant failures point immediately to a configuration error. Intermittent failures look like a network problem, a service issue, or a transient event. The VM is healthy. The domain controller is healthy. The connection is healthy. The clock is broken.

Step 6 — Certificates tied to the hostname or SPN begin failing renewal. Certificate renewal operations that depend on Kerberos-authenticated connections to the CA start failing silently. This doesn’t surface immediately because existing certificates are still valid — the failure appears when renewal is attempted.

Step 7 — Monitoring still shows the VM as healthy. Compute metrics are normal. Process health is normal. Network reachability is normal. Nothing in the standard monitoring stack is measuring Kerberos ticket validity or certificate renewal success rates.

Step 8 — Failure surfaces during GPO refresh, scheduled task execution, or service restart. GPO application requires authenticated domain communication. Scheduled tasks running under domain service accounts require valid Kerberos tickets. Service restarts trigger re-authentication against the domain.

Step 9 — Post-incident analysis struggles to connect the failure to the migration. The cutover was days ago. The VM has been running. “The migration ran clean” is the answer everyone gives, because the migration checklist passed.

What the Migration Checklist Missed

The checklist wasn’t wrong. “VMware Tools replaced ✅” is correct procedure. The problem isn’t that the checklist item failed — it’s that the checklist didn’t capture what VMware Tools was implicitly responsible for beyond its documented feature set.

Time synchronization is the most common implicit dependency, but it’s not the only one. VMware Tools mediates guest-hypervisor interactions that most migration checklists treat as binary: installed or not installed. The functional dependencies it was maintaining — time authority, some certificate operations, guest identity signals to the control plane — aren’t listed as VMware Tools dependencies in most runbooks because they were never explicitly configured. They were defaults that worked because VMware Tools was present.

identity continuity gap failure chain — vmware tools time drift kerberos ad authentication failure

The Identity Continuity Gap

This failure pattern has a name: the Identity Continuity Gap — the operational gap between workload portability and trust portability during virtualization migrations.

Workload portability is what migration tooling measures: the VM can boot, run, and serve traffic on the new hypervisor. Trust portability is what migration tooling doesn’t measure: the VM’s identity relationships — its standing with the domain controller, its certificate chain validity, its time authority, its SPN registrations — are intact and functional on the new hypervisor.

A migration can achieve complete workload portability and zero trust portability simultaneously. The VM boots. The checklist passes. The identity layer is broken in ways that only surface under specific operational conditions.

What Trust Portability Actually Requires

Five verification steps that belong on every migration checklist and aren’t on most of them:

Time synchronization verification before cutover confirmation. Verify that the guest clock is synchronized to domain time within Kerberos tolerance after the guest agent replacement — before marking the migration complete.

Kerberos skew tolerance testing post-reboot. Run an explicit Kerberos authentication test after the first reboot on the new hypervisor. A successful kinit or equivalent confirms time authority is intact.

SPN audit independent of VMware Tools. Service Principal Names registered for the migrated VM should be verified post-cutover.

Certificate chain validation independent of the old hypervisor. Validate that the renewal process can complete successfully against the CA from the new hypervisor — not just that the current certificate is valid.

Identity reconciliation checkpoint as a migration gate. “VM has successfully completed a Kerberos-authenticated domain operation after migration” — not just “VM is running and responding to health checks.”

Architect’s Verdict

The migration succeeded at the compute layer and failed at the trust layer because the architecture treated identity as attached to the VM rather than attached to the operational control plane.

That framing is the useful one for post-mortems: this wasn’t a migration failure, it was an identity architecture assumption that the migration exposed. The VM had always depended on VMware Tools to maintain its time authority and by extension its domain trust relationships. That dependency was invisible because VMware Tools was always present. The migration removed it — and the identity layer failed on a deferred schedule, in ways that looked like network problems and transient events until the pattern became clear.

The checklist item was correct. The checklist was incomplete. The gap between those two statements is where most vmware migration issues at the identity layer live — not in what was verified, but in what was never written down as a dependency in the first place.

Additional Resources

Originally published at rack2cloud.com

Hermes Agent as a Farmer’s AI Advisor — Built on Android, Tested in Assam

Hermes Agent Challenge Build Submission

What I Built

A working agricultural AI advisor powered by Hermes Agent, running entirely on an Android phone via Termux, tested with real farming questions from Silchar, Assam, Northeast India.

No laptop. No GPU. No cloud server. Just a phone, Termux, and Hermes Agent doing real agentic work for farmers who cannot afford enterprise AI tools.

The Problem

Farmers in Cachar district, Assam ask questions like:

  • My rice leaves have brown spots near the edges. What disease is this?
  • When should I plant Boro rice and which variety should I choose?
  • Give me a 3-month farming plan starting from December.

These are not questions a static chatbot answers well. They need an agent that reasons across multiple steps, applies local agricultural knowledge, and gives actionable, region-specific advice.

Hermes Agent does exactly this.

Setup — Android + Termux + Hermes Agent

My environment:

  • Device: Android phone
  • Terminal: Termux → proot-distro Ubuntu (ARM64)
  • No laptop, no desktop, no GPU

Installation was a single command:

curl -fsSL https://raw.githubusercontent.com/NousResearch/hermes-agent/main/scripts/install.sh | bash

Hermes Agent auto-detected my ARM64 Termux environment and installed cleanly. This matters — it means the same setup works for any developer in rural India running Termux.

Model used: Google Gemini via OAuth (free tier) — zero cost, no API key purchase needed.

The Demonstrations

Demo 1: Rice Disease Diagnosis

My prompt to Hermes Agent:

I am a farmer in Silchar, Assam. My rice leaves have brown spots near the edges. What disease is this and how do I treat it?

Hermes Agent’s response (summarised):

Hermes correctly identified two candidate diseases based on the symptom description:

Brown Spot (Fungal) — oval/circular spots with yellow halo, common in low-fertility soils. Treatment: Propiconazole 25% EC (1ml/litre) or Mancozeb 75% WP (2-2.5g/litre), plus balanced NPK fertilization.

Bacterial Leaf Blight — wavy brown edges spreading from leaf tips. Treatment: Streptocycline + Copper Oxychloride. Avoid excess Urea. Drain standing water.

Hermes then gave Silchar-specific advice: visit the local Krishi Vigyan Kendra (KVK) in Cachar with a leaf sample before purchasing chemicals.

This is not generic advice. It is regionally grounded, actionable, and honest about when a farmer should seek local expert confirmation.

Demo 2: Boro Rice Planting Calendar

My prompt:

What is the best time to plant Boro rice in Cachar district, and what variety should I choose?

Hermes Agent’s response (summarised):

  • Nursery sowing: Mid-November to Mid-December
  • Transplanting: Mid-December to Mid-January
  • Harvest: April to May (before monsoon)

Recommended varieties specific to Assam: Joymati, Bishnu Prasad, Jyotiprasad, Kanaklata, IR-36, IR-50 — with maturity timelines and cold-tolerance tips for Silchar winters.

Sources for seeds: Assam Seeds Corporation, local block agriculture offices, KVK Cachar.

Demo 3: 3-Month Farming Plan

My prompt:

Create a simple 3-month farming plan for a rice farmer in Silchar starting from December

Hermes Agent’s response:

Hermes generated a complete week-by-week plan across December, January, and February — covering seedbed preparation, cold protection, transplanting spacing (20x15cm), water management, fertilizer application timing, weed control, and pest monitoring. It even flagged the pro tip of draining water before Urea application to prevent runoff.

This is multi-step planning — not a single lookup but a structured, sequenced agricultural roadmap.

Why This Matters

Hermes Agent ran these three demonstrations on a phone in Termux. The same phone a farmer’s son in Cachar district carries. The same environment that costs nothing beyond internet access.

The agentic capabilities that made this work:

Tool chaining — Hermes reasoned across multiple considerations (climate, soil, disease vectors, local institutions) in a single response without being explicitly prompted to do so.

Regional grounding — It applied Assam-specific knowledge (KVK Cachar, Assam Seeds Corporation, local variety names) rather than giving generic pan-India advice.

Honest uncertainty — It told the farmer to get a physical leaf sample confirmed before buying chemicals. An agent that knows the limits of its own remote diagnosis is more trustworthy than one that does not.

Planning capability — The 3-month farming plan was a genuinely structured multi-step output, not a list of generic tips.

Connection to My Broader Work

I have spent the past year building the Divine Earthly ASI system — a sovereign, offline-first agricultural AI for rural Indian farmers, running on quantized 0.5B models via llama.cpp on ARM64 Termux. My system is designed for zero-connectivity environments.

Hermes Agent occupies a different but complementary space: it requires internet connectivity but brings mature agentic infrastructure (skill learning, session memory, 28 tools) that would take years to build from scratch.

What they share: the belief that capable AI should run where farmers are, not just where servers are.

What Hermes Agent Does That Impressed Me

The skill-learning loop. After complex sessions, Hermes distills experience into reusable skill files. For agricultural use, this means the more farmers use it, the better it gets at local, regional questions — accumulating what I call Samskara: the impression that evolves future behavior.

See my companion Write submission for a deeper exploration of this Vedic parallel:
Samskara and the Self-Improving Agent

Reproduce This Yourself

Requirements: Android phone with Termux, or any Linux machine.

# Install proot-distro ubuntu (Termux only)
pkg install proot-distro
proot-distro install ubuntu
proot-distro login ubuntu

# Install Hermes Agent
curl -fsSL https://raw.githubusercontent.com/NousResearch/hermes-agent/main/scripts/install.sh | bash

# Set up free model (Google Gemini OAuth)
hermes model
# Select: Google Gemini via OAuth + Code Assist (free tier)

# Start
hermes

Then ask it a farming question. It works.

Links

Joydeep Das — independent AI researcher, Silchar, Assam. Building sovereign AI for Indian farmers on an Android phone.

hermesagentchallenge #devchallenge #agents #ai #india

IaC Drift Management: Unexpected Infrastructure Discrepancies and

In today’s rapidly evolving IT landscape, infrastructure management is becoming increasingly complex. To navigate this complexity and automate processes, Infrastructure as Code (IaC) approaches are of paramount importance. IaC is the practice of defining, provisioning, and managing infrastructure resources using code.

However, even when using IaC, unexpected infrastructure discrepancies known as “drift” can arise. IaC drift management encompasses the processes of detecting, correcting, and preventing these deviations between the ideal state defined in your code and the actual infrastructure state. In this post, we will delve into what IaC drift is, its causes, risks, and effective management strategies.

What is IaC Drift and Why is it Important?

Infrastructure as Code (IaC) enables your infrastructure to be defined and managed through version-controlled code files. This ensures that infrastructure changes are applied consistently and repeatably. However, this ideal state cannot always be maintained.

IaC drift management refers to your infrastructure deviating from its expected state. This occurs when a part of the infrastructure is modified outside of the IaC code, either manually or by another automated process. These deviations can seriously threaten the stability, security, and compliance of your systems.

Defining IaC Drift

IaC drift is when your infrastructure resources (e.g., virtual machines, databases, network configurations) differ from the configuration defined in your IaC code. In essence, it’s a state of inconsistency between what your code dictates and what actually exists in your infrastructure. These inconsistencies can range from a minor setting adjustment to the deletion of an entire resource.

Drift invalidates your IaC code as the “single source of truth” for your infrastructure. This can lead to failed future deployments, unexpected behaviors, and prolonged troubleshooting processes. IaC drift management aims to minimize these discrepancies.

Causes of Drift

There can be multiple reasons for IaC drift, often stemming from human factors or process deficiencies. Understanding these causes is critical for developing strategies to prevent drift. Below are common reasons that lead to drift:

  • Manual Configuration Changes: This is the most common cause of drift. A developer or operations specialist might make direct changes to the infrastructure for a quick fix or testing purposes. These changes are often not reflected in the IaC code and are forgotten over time.
  • Emergency Fixes: When a critical issue arises in the production environment, direct interventions might be made for rapid solutions. These emergency interventions often bypass IaC processes, leading to drift.
  • Unsuccessful IaC Deployments: If an IaC deployment fails partially, some resources might have been created or modified, while others were not. This can leave a partial configuration that differs from what the IaC code expects.
  • Third-Party Integrations: Security tools, monitoring systems, or other automation solutions might make changes to infrastructure resources on their own. Changes made by such systems might not be specified in your IaC code.
  • Human Error: Sometimes, executing incorrect commands or targeting the wrong resources can lead to unintended changes in the infrastructure. These errors can invalidate the definitions in your IaC code.

Potential Risks of Drift

IaC drift brings with it a host of serious risks for an organization. These risks span a wide spectrum, from operational efficiency to security and compliance. IaC drift management is vital for minimizing these risks.

  • Configuration Inconsistency: Drift leads to inconsistent configurations across different environments (development, test, production). This can cause the “it worked on my machine!” syndrome, where an application that runs in a test environment encounters issues in production.
  • Security Vulnerabilities: Manual changes or outdated IaC code can result in missing security patches or misconfigured security groups. This creates potential entry points for malicious attackers.
  • Compliance Issues: Adhering to regulations like GDPR or HIPAA requires maintaining specific security and configuration standards. Drift can lead to deviations from these standards, causing problems during audits and potential legal penalties.
  • Troubleshooting Difficulties: When an issue arises, understanding which part of the infrastructure is managed by IaC and which part was manually changed can be complex. This prolongs troubleshooting time and increases system downtime.
  • Reduced Agility: In an environment with drift, deploying new features or patches becomes risky because the exact state of the existing infrastructure is unknown. This slows down deployment speed and reduces the organization’s agility.
  • High Operational Costs: The time and effort spent detecting, analyzing, and correcting drift increase operational costs. Furthermore, outages or security breaches caused by drift also incur additional expenses.

IaC Drift Management Strategies

IaC drift management requires a combination of strategies to detect, correct, and most importantly, prevent drift. These strategies offer a comprehensive approach to ensuring the consistency and security of your infrastructure. An effective management plan is fueled by automation, process improvements, and cultural change.

Drift Detection

Drift detection is the process of comparing the actual infrastructure state with the expected state defined in your IaC code. This is the first and most fundamental step in IaC drift management. Regularly detecting drift allows you to intervene before problems escalate.

Various tools and methods are available for drift detection. Most IaC tools have built-in features that can perform such comparisons. For example, in Terraform, the terraform plan command shows the differences between your code and the existing infrastructure. Similarly, AWS Config, Azure Policy, and custom scripts can also be used for drift detection.

💡 Continuous Drift Detection

Drift detection should not be a one-time operation. By integrating regular and automated checks into your CI/CD pipelines, you can ensure your infrastructure remains compliant with your code continuously. Running these checks a few times a day or with every code change helps you catch drift at an early stage.

Below is an example of a Terraform plan output, simulating how it might indicate drift in a resource:

Terraform will perform the following actions:

  # aws_instance.web_server will be updated in-place
  ~ resource "aws_instance" "web_server" {
        id                            = "i-0abcdef1234567890"
        tags                          = {
            "Environment" = "production"
            "Name"        = "MyWebServer"
            "Owner"       = "DevOpsTeam"
        }
      - tags_all                      = {
      -     "Environment" = "production"
      -     "Name"        = "MyWebServer"
      -     "Owner"       = "DevOpsTeam"
      -     "DriftTag"    = "ManualChange" -> null # Drift detected: Manual tag removed
        }
        # (lifecycle, ami, instance_type, etc. remain unchanged)
    }

Plan: 0 to add, 1 to change, 0 to destroy.

In this example, the “DriftTag” in the tags_all block indicates that the tag is not present in the IaC code but exists in the actual infrastructure and will be removed. This means someone manually added this tag via the AWS console, and the IaC code is unaware of it.

Drift Remediation

Once drift is detected, the next step is to correct these discrepancies. Drift remediation is the process of bringing the infrastructure back to the expected state defined in your IaC code or updating the IaC code to reflect the actual infrastructure state. This decision depends on the nature and cause of the drift.

There are two primary approaches:

  1. Revert to IaC: This assumes your IaC code is the “single source of truth.” When drift is detected, the IaC code is applied to revert the infrastructure to the expected state. This means overwriting or deleting manually made changes. This approach ensures infrastructure consistency and repeatability but carries the risk of losing valuable manual changes.
  2. Update IaC: If the drift resulted from a significant and intended change (e.g., an emergency fix worked and should be permanent), then you need to update your IaC code to reflect the actual infrastructure state. This involves revising the code, testing it, and then deploying it. This approach keeps your IaC code up-to-date but requires careful evaluation of the accuracy and appropriateness of manual changes.

Automatic remediation typically follows the “revert to IaC” approach, continuously enforcing the IaC code’s state onto the actual infrastructure. This is highly effective for ensuring consistency, especially in development and test environments. In production environments, automatic remediation should be applied cautiously, considering potential disruptions.

# After drift detection, `terraform apply` is used for remediation.
# This command applies the state defined in your IaC code to the infrastructure.
# It will revert drifted resources to their previous state or update them.
terraform apply --auto-approve

The terraform apply command applies the changes shown by the plan command to the actual infrastructure. The --auto-approve flag allows direct application without confirmation, which is useful in automation pipelines but should be used with caution.

Drift Prevention

While drift detection and remediation are important, the best strategy is to prevent drift from occurring in the first place. Drift prevention involves mechanisms and processes that ensure all infrastructure changes are made through the IaC process.

  • Policy Enforcement: You can prevent direct manual changes to specific resources by using native policy engines of cloud providers (AWS SCPs, Azure Policies, Google Cloud Organization Policies) or third-party tools (Open Policy Agent – OPA). These policies might, for example, mandate certain tags or prohibit opening specific ports.
  • Access Control: Restrict direct access to infrastructure resources as much as possible. Use Role-Based Access Control (RBAC) to allow only specific IaC deployment accounts or CI/CD pipelines to make infrastructure changes. Limiting direct access to the production environment for developers and operations teams significantly reduces the risk of manual changes.
  • CI/CD Pipeline Integration: Mandate that all infrastructure changes go through a CI/CD pipeline. This pipeline should include code review, automated testing, and IaC deployment. Every change should be committed to the codebase and deployed through an automated process.
  • Immutable Infrastructure: Instead of modifying servers or other infrastructure components, create a new version and destroy the old one when a change is needed. This approach largely eliminates configuration drift because each deployment starts fresh. Docker containers and AMIs (Amazon Machine Images) are good examples of this principle.
  • Regular Audits and Reviews: Regularly review your IaC code and infrastructure configurations. Code reviews are an effective way to catch potential issues early and ensure adherence to IaC standards. Security audits can also uncover manually made changes.

Popular IaC Tools and Drift Management Features

Different IaC tools offer various features for drift management. Understanding the capabilities of these tools can help you determine the most suitable strategy for your environment. Each tool has its own philosophy and strengths in defining and managing infrastructure as code.

Terraform

HashiCorp Terraform is one of the most popular IaC tools for provisioning and managing infrastructure across various cloud providers and other services. Terraform operates with a declarative approach and offers robust features for drift management.

Terraform’s primary drift detection mechanism is the terraform plan command. This command compares the desired state defined in your IaC code with the current infrastructure state and shows the differences between them. Potential additions, updates, or deletions are clearly indicated. To correct drift, the terraform apply command is used; this command brings the infrastructure to the state defined in your IaC code.

Platforms like Terraform Cloud and Terraform Enterprise offer more advanced drift detection and alerting features. These platforms can continuously monitor resources in your workspaces and notify you when a deviation from your code is detected. This allows you to proactively manage drift without the need for manual intervention.

# Shows differences between the current infrastructure state and your code
terraform plan

# When drift is detected, applies the state in your code to the infrastructure
# This can revert manual changes or update your IaC code
terraform apply

AWS CloudFormation

AWS CloudFormation is an IaC service that allows you to declaratively define AWS resources. CloudFormation manages resources through stacks. It has built-in features for drift management.

CloudFormation’s Drift Detection feature compares the actual configuration of resources in a stack with the expected configuration in the stack template. This feature can be initiated via the AWS console, CLI, or SDK and reports drifted resources and changes. When drift is detected, CloudFormation does not provide automatic remediation directly but allows you to review the drift and correct it manually or by deploying a new template. Additionally, CloudFormation’s Change Sets feature helps prevent unexpected situations by allowing you to preview changes to be applied to a stack beforehand.

Ansible

Ansible is an open-source tool used for IT automation. It performs tasks such as configuration management, application deployment, and orchestration. Ansible places great importance on the principle of “idempotency,” meaning that running a playbook multiple times always leads to the same outcome.

While Ansible doesn’t offer a direct “drift detection” feature, it indirectly manages drift through idempotency. Each time a playbook is run, it checks the state of the target system and makes only the necessary changes. Running a playbook with the --check or --diff flags allows you to preview potential changes to the system (i.e., drift) before they are made. These modes show what is different based on your intent, without making actual changes.

Pulumi

Pulumi is a modern IaC platform that allows you to define cloud infrastructure using real programming languages like Go, Python, TypeScript, and C#. The power of programming languages enables the creation of more complex and dynamic infrastructures.

Pulumi displays and applies planned changes using the pulumi preview and pulumi up commands. For drift detection, it reflects the actual state of cloud resources into the state file with pulumi refresh, and then reports the difference between the state and the code with pulumi preview.

Conclusion

IaC drift accumulates like invisible debt and surfaces during incidents until it’s noticed. The triple threat of a disciplined refresh + preview cycle, automated drift checks in CI, and IAM policies blocking manual cloud console changes is the most effective strategy to prevent drift at its source.

Offline-First iOS Architecture with Core Data and Sync

  • [Why an offline-first UX is a product-level advantage]
  • [Pick a Core Data store topology that avoids future pain]
  • [Design sync and conflict-resolution so merges feel invisible]
  • [Make background sync reliable: batching, scheduling, and limits]
  • [Evolve your schema safely: practical migration patterns]
  • [Practical Application: a checklist, code snippets, and scripts]

Offline-first is not a checkbox — it’s a contract your app signs with the user to behave predictably when connectivity fails. The work you do in the persistence and sync layers determines whether the app is trusted or frustrating when network conditions go sideways.

The Problem
You ship a product where users create and edit data in the field. When network conditions degrade you see the same symptoms: lost edits, weird merge artifacts on second device, long app pauses during large re-syncs, and migration-time crashes in the wild. Those problems are not only engineering issues — they directly cost trust, retention, and revenue. You need a persistence and sync architecture that keeps the local model authoritative for the UI, records a deterministic change history, and performs resilient, bounded background work to reconcile with the server in a way the operating system will permit.

Why an offline-first UX is a product-level advantage

An offline-first experience gives users immediate writes, predictable reads, and graceful degradation of features when networks fail. The behavior you design locally — optimistic writes, local caching, clear offline state — directly affects perceived latency and retention. The Offline First community has long argued that treating the device as the primary data source for the user’s immediate workflow reduces friction and extends reach to environments where connectivity is intermittent.

From an engineering perspective, this means treating the network as eventually consistent plumbing and designing the app so the UI never blocks on a round trip to a remote service. The device-side data model must be fast, durable, and capable of representing both authoritative state and local-only work-in-progress; that is exactly where Core Data excels because it combines object-graph semantics, persistence, and migration tooling in one engine.

Important: Design decisions that trade local determinism for network simplicity (for example, relying exclusively on server validation before showing results) will make your app brittle in low-connectivity environments and increase customer churn.

Pick a Core Data store topology that avoids future pain

Topology matters. Choose a store layout that maps to how you expect data to flow and to who owns authoritative state at each step.

Common practical topologies:

  • Single store (one SQLite file). Simple, but every device and extension must share the same strategy for merges and history. Use this when the app is single-authority or when you control the entire sync stack.
  • Multi-store by responsibility. Split the model into a local-only store (ephemeral caches, large binary blobs, UI drafts) and a sync store that is mirrored to CloudKit via NSPersistentCloudKitContainer. Use .xcdatamodeld configurations to pin entities to stores. This keeps your CloudKit schema small and prevents transient local artifacts from polluting the sync pipeline.
  • Event-log/append-only overlay. Keep local change-sets in an append-only store (or a small “outbox” table) for offline edits, then compact/merge into the main store on a controlled background task. This makes the client-side sync pipeline deterministic and easier to replay during recovery.

Concrete startup pattern (Swift):

import CoreData
import CloudKit

let container = NSPersistentCloudKitContainer(name: "Model")

let cloudURL = FileManager.default
  .urls(for: .applicationSupportDirectory, in: .userDomainMask)
  .first!
  .appendingPathComponent("Cloud.sqlite")

let localURL = FileManager.default
  .urls(for: .applicationSupportDirectory, in: .userDomainMask)
  .first!
  .appendingPathComponent("Local.sqlite")

let cloudDesc = NSPersistentStoreDescription(url: cloudURL)
cloudDesc.configuration = "Cloud"
cloudDesc.cloudKitContainerOptions = NSPersistentCloudKitContainerOptions(containerIdentifier: "iCloud.com.example.app")
cloudDesc.setOption(true as NSNumber, forKey: NSPersistentHistoryTrackingKey)
cloudDesc.setOption(true as NSNumber, forKey: NSPersistentStoreRemoteChangeNotificationPostOptionKey)

let localDesc = NSPersistentStoreDescription(url: localURL)
localDesc.configuration = "Local"

container.persistentStoreDescriptions = [cloudDesc, localDesc]
container.loadPersistentStores { desc, error in
  if let error = error { fatalError("store load failed: (error)") }
}

container.viewContext.automaticallyMergesChangesFromParent = true
container.viewContext.mergePolicy = NSMergeByPropertyObjectTrumpMergePolicy

Why these flags matter: enabling persistent history tracking and remote-change notifications gives you the deterministic transaction stream you need to decide what to merge into active contexts and when. That is the basis of predictable background sync and UI updates with CloudKit-backed stores.

Design sync and conflict-resolution so merges feel invisible

Conflict resolution is a product problem not just a technical one. The UI must present stable semantics, and the sync engine must be deterministic and auditable.

Patterns that scale:

  • Set a sensible base mergePolicy on view contexts (e.g., NSMergeByPropertyObjectTrumpMergePolicy or NSOverwriteMergePolicy) to handle trivial overlaps; but treat the merge policy as the safety net, not the full story. Use NSMergePolicy for simple last-writer-wins cases.
  • Add per-entity metadata: lastModifiedAt (ISO8601 timestamp), lastModifiedBy (device id or user id), and a small changeSequence integer when possible. Use those fields in application-level merges to implement per-field deterministic merges rather than wholesale row replacement.
  • For fields that represent collections (tags, participants), use semantic merge functions (e.g., union, ordered merge with tombstones) rather than blind replacement.
  • Use persistent history to detect the origin of a change and to filter only relevant transactions for the current UI. That avoids needless visual churn when remote changes don’t affect the view the user is editing.

Example merge skeleton (field-aware):

func merge(local: NSManagedObject, incoming: NSManagedObject) {
  let keys = Array(local.entity.attributesByName.keys)
  for key in keys {
    guard let localDate = local.value(forKey: "lastModifiedAt") as? Date,
          let incomingDate = incoming.value(forKey: "lastModifiedAt") as? Date else {
      continue
    }
    if incomingDate > localDate {
      local.setValue(incoming.value(forKey: key), forKey: key)
    }
  }
  local.setValue(Date(), forKey: "lastModifiedAt")
}

When pure LWW (last-writer-wins) is unacceptable (collaborative edits, invoices, etc.), you must design domain-specific merging rules or adopt CRDTs/OTs for those entities. Document the merge semantics in the model and test them with deterministic multi-device scenarios.

Make background sync reliable: batching, scheduling, and limits

The operating system controls when background CPU and network time happens. Your job is to cooperate with the system and make the sync work efficiently within those limits. Use the Background Tasks framework for scheduled, battery-aware processing and use background URLSession for discrete large uploads/downloads handled by the OS.

Key rules:

  • Use BGProcessingTaskRequest for heavier sync work that requires time and network connectivity; the system decides the exact execution window and you must reschedule for the next run.
  • Use background URLSession for large transfers; the system performs them out-of-process and relaunches your app to handle completion callbacks. This is energetically cheaper and more reliable than trying to keep your app alive.
  • Batch many small local edits into a single network payload. Sender-side batching reduces round trips, contention, and CloudKit rate-pressure. Use NSBatchInsertRequest when importing large payloads to avoid faulting objects into memory.

BG scheduling example:

import BackgroundTasks

func scheduleSync() throws {
  let req = BGProcessingTaskRequest(identifier: "com.example.app.sync")
  req.requiresNetworkConnectivity = true
  req.requiresExternalPower = false
  req.earliestBeginDate = Date(timeIntervalSinceNow: 15 * 60)
  try BGTaskScheduler.shared.submit(req)
}

func handleSync(task: BGTask) {
  scheduleSync() // always reschedule
  let queue = OperationQueue()
  queue.maxConcurrentOperationCount = 1
  let op = SyncOperation(container: container)
  task.expirationHandler = { op.cancel() }
  op.completionBlock = { task.setTaskCompleted(success: !op.isCancelled) }
  queue.addOperation(op)
}

Important operational note: background scheduling is opportunistic. Do not rely on exact timing; use push notifications (silent) to trigger near-real-time sync when available.

Evolve your schema safely: practical migration patterns

Database evolution is the slowest, riskiest part of persistence work. A migration plan eliminates surprises.

Migration hierarchy:

  1. Lightweight migration (inferred mapping). Works for additive and many non-destructive changes. Prefer this for minor changes because Core Data can infer the mapping and perform an in-place SQLite migration efficiently.
  2. Custom mapping model for complex schema changes that require transformation logic.
  3. Side-by-side migration: create a new store, migrate data into a new model using programmatic transforms, validate, then perform a store swap. This is safest for large or destructive transformations.

Migration checklist (practical):

  • Create a new model version in Xcode and set it as current.
  • Set these persistent store options before loading stores:
    • NSMigratePersistentStoresAutomaticallyOption = true
    • NSInferMappingModelOption = true (for lightweight migration)
  • Run large migrations on a background queue before the UI tries to access the store. Present a lightweight progress UI and ensure the user cannot corrupt the migration by quitting the app mid-migrate.
  • When using CloudKit mirroring, beware: changing entity names, configuration names, or record mapping can force full reuploads or a sync reset. Initialize CloudKit schema only once (shouldInitializeSchema pattern) and then set it to false in production.

Lightweight migration sample options:

let desc = NSPersistentStoreDescription(url: storeURL)
desc.setOption(true as NSNumber, forKey: NSMigratePersistentStoresAutomaticallyOption)
desc.setOption(true as NSNumber, forKey: NSInferMappingModelOption)
container.persistentStoreDescriptions = [desc]
container.loadPersistentStores { _, error in ... }

Migration validation: always ship a migration test harness that applies the migration against real production-sized test data and measures time and storage spikes. Use Instruments to inspect CPU, IO, and peak memory.

Practical Application: a checklist, code snippets, and scripts

Actionable checklist you can run through in your next sprint:

  • Decide store topology: single vs multi-store vs outbox.
  • Add lastModifiedAt and lastModifiedBy to entities that users will edit concurrently.
  • Enable persistent history and remote change notifications on CloudKit stores.
  • Set automaticallyMergesChangesFromParent = true on your main viewContext and choose application-level merge semantics for anything non-trivial.
  • Implement a durable outbox for offline edits; only delete an outbox item once the remote confirms receipt.
  • Implement background sync using BGProcessingTaskRequest plus URLSession background transfers for big payloads.
  • Write deterministic unit tests that simulate:
    • Concurrent edits on two devices,
    • Interrupted background sync (system kills),
    • Migration from an older model on a large dataset.

Core persistence stack (compact reference):

import CoreData
import CloudKit

struct Persistence {
  static let shared = Persistence()
  let container: NSPersistentCloudKitContainer

  private init() {
    container = NSPersistentCloudKitContainer(name: "Model")
    guard let desc = container.persistentStoreDescriptions.first else { fatalError() }
    desc.setOption(true as NSNumber, forKey: NSPersistentHistoryTrackingKey)
    desc.setOption(true as NSNumber, forKey: NSPersistentStoreRemoteChangeNotificationPostOptionKey)
    desc.setOption(true as NSNumber, forKey: NSMigratePersistentStoresAutomaticallyOption)
    desc.setOption(true as NSNumber, forKey: NSInferMappingModelOption)
    container.loadPersistentStores { _, error in
      if let e = error { fatalError("Store error: (e)") }
    }
    container.viewContext.mergePolicy = NSMergeByPropertyObjectTrumpMergePolicy
    container.viewContext.automaticallyMergesChangesFromParent = true
  }
}

Persistent-history consumption sketch (async):

func processHistory() async throws {
  let token = loadLastHistoryToken()
  let context = container.newBackgroundContext()
  context.performAndWait {
    let request = NSPersistentHistoryChangeRequest.fetchHistory(after: token)
    if let result = try? context.execute(request) as? NSPersistentHistoryResult,
       let transactions = result.result as? [NSPersistentHistoryTransaction] {
       // filter relevant transactions, merge into viewContext or notify UI
    }
  }
  saveLastHistoryToken()
}

Operational scripts to include in CI:

  • Migration performance test that runs on a device/simulator farm with a large SQLite file.
  • A sync regression test that runs a multi-device simulated sync and compares final store hashes.

Sources
Core Data Programming Guide – Overview of Core Data features: object-graph management, concurrency models, performance instruments and fundamentals that anchor why Core Data fits offline-first clients.

Setting Up Core Data with CloudKit – Apple guidance on mirroring a Core Data store with CloudKit, NSPersistentCloudKitContainer setup, and CloudKit-specific constraints and lifecycle notes.

BGProcessingTaskRequest — Background Tasks – API and behavioral notes for scheduling processing work in the background and system expectations about timing and resource limits.

Lightweight Migration – Apple documentation describing inferred mappings and when lightweight migration applies.

Consuming Relevant Store Changes – How to enable and read persistent history tracking and remote-change notifications to integrate external store changes safely.

Offline First – Community resources and the offline-first mindset: design patterns and UX rationales for treating the device as the primary data surface.

Core Data Performance – Practical performance advice for Core Data, Instruments probes, and best practices for large data sets.

NSOverwriteMergePolicy / NSMergePolicy – Core Data merge policies and their semantics for resolving concurrent writes.

This Week In React #281 : Next.js, TanStack, Security, Redact | Redraw, Expo, Tabs, Screens | TC39, Rolldown, Node

banner

Hi everyone, Seb and Jan here 👋!

This week, security is making headlines, as two major React frameworks have announced vulnerabilities and compromised npm packages!

William Candillon unveiled his secret project: a new set of 2D primitives for React Native and the web.

It’s also an exciting week full of interesting releases all around the JS ecosystem!

Let’s dive in!

💡 Subscribe to the official newsletter to receive an email every week!

banner

💸 Sponsor

 AI That Gets React Native on Fire TV 

 AI That Gets React Native on Fire TV 

We built an MCP server for Vega OS, our new React Native TV platform for Fire TV. 

Amazon Devices Builder Tools MCP gives your AI agent deep platform context, so instead of generic React Native suggestions, your agent understands how to scaffold correctly, integrate platform features, and follow Vega conventions. 

Explore building for TV without the friction of learning a new platform from scratch. It’s a step toward making our developer tooling as modern as the platform itself. One command to install.

⚛️ React

Next.js May 2026 security release

Next.js May 2026 security release

The Next.js team shipped a coordinated security release fixing 13 vulnerabilities across denial of service, middleware/proxy bypass, server-side request forgery, cache poisoning, XSS. Many vulnerabilities are quite impactful, cannot be blocked by cloud firewalls, and it’s recommended to update immediately to a patched version, v15.5.18 or v16.2.6. There’s also a Server Functions denial of service affecting React RSC packages, fixed in v19.2.6.

TanStack npm supply-chain compromise

TanStack npm supply-chain compromise

On May 11, an attacker published malicious versions across 42 @tanstack/* npm packages related to TanStack Router. Although the attack was detected quickly, its payload is a Mini Shai-Hulud worm that infected other maintainers, leading to other compromised packages across npm and pypi ecosystems, including packages from Mistral AI, OpenSearch, UiPath, and more.

The attack vector was sneaky. A GitHub Action with a pull_request_target trigger was used to inject poisoned content into a shared GitHub Action pnpm cache. Then, their release pipeline read from that poisoned cache, restoring dangerous files that executed during the release process. No maintainer was hacked in the process. The npm releases have the Trusted Publishing checkmark despite being compromised, showing that package provenance does not guarantee its content is safe.

Given the increasing number of supply chain vulnerabilities affecting npm packages, it’s good to highlight measures that maintainers and users can take to stay safe:

  • 📜 Hardening TanStack After the npm Compromise – Gives a good overview of what maintainers can do to reduce the supply chain risk. Low-hanging fruits include avoiding the very dangerous pull_request_target trigger, and removing usage of shared caches in sensitive workflow (note: actions such as setup-node using a cache by default).
  • 🔗 npm package manager Security Best Practices – A canonical resource to protect yourself as an npm package consumer, giving pragmatic recommendations for each package manager. IMHO, combining the Socket Firewall with pnpm 11 is likely the best option right now.

💸 Sponsor

Tests are dead - Meticulous is here

Tests are dead – Meticulous is here

Meticulous creates and maintains an exhaustive suite of e2e ui tests with zero developer effort. 

This quote from the CTO of Traba sums the product up best: “Meticulous has fundamentally changed the way we approach frontend testing in our web applications, fully eliminating the need to write any frontend tests. The software gives us confidence that every change will be completely regression tested, allowing us to ship more quickly with significantly fewer bugs in our code. The platform is easy to use and reduces the barrier to entry for backend-focused devs to contribute to our frontend codebase.”

Meticulous is used by companies like Notion, Dropbox, Wiz, LaunchDarkly, and many others.

This post from our CTO sets out the context of why exhaustive testing can double engineering velocity.

📱 React-Native

Redraw - 2D graphics primitives, powered by WebGPU

Redraw – 2D graphics primitives, powered by WebGPU

In an amazing introduction video, William Candillon presented what he’s been secretly working on for months: a new grade of 2D graphics primitives, powered by WebGPU. It’s still a technical preview and not open-source yet, but William is looking to make it source-available soon with a license that makes it sustainable.

It all started with “Can it be done in React Native?”, led to Skia on native, then WebGPU for unified 2D/3D composition across platforms. Redraw is the next step: bringing GPU-accelerated vector rendering with rich geometric information back to both native and web.

What it unlocks:

  • Variable strokes – stroke width driven by path geometry (tangent, arc length)
  • Color along path – gradient callbacks mapped to arc length or distance
  • Vector feathering – soft shadows, blur, and glow without rasterization
  • Physically-based rendering – material effects computed directly on vector paths
  • Non-physically-based rendering – creative effects impossible with raster pipelines

Built for composability:

  • Compute shaders powered via TypeGPU (optional dependency)
  • Zero-cost integration with Skia, Three.js, PixiJS, and WebGPU
  • Write shader logic in TypeScript, no WGSL required

🔀 Other

🤭 Fun

alt

See ya! 👋

Claude Code Routines: Automate AI Workflows on Autopilot in 2026

A visual 2x3 grid of use case cards: Backlog maintenance, Alert triage, Bespoke code review, Deploy verification, Docs drift, Library port.

Claude Code Routines: Automate AI Workflows on Autopilot in 2026

TL;DR Summary

  • Claude Code Routines run on Anthropic’s cloud infrastructure — your laptop can be closed, routines keep executing
  • Three trigger types: schedule (cron, recurring or one-off), API (HTTP POST from any system), and GitHub events (PRs, releases)
  • Routines run autonomously as full Claude Code sessions — they clone repos, use MCP connectors, run shell commands, and create PRs
  • Use cases include PR review, alert triage, deploy verification, docs drift detection, backport automation, and library sync
  • Available on Pro/Max/Team/Enterprise plans with Claude Code on the web enabled. Create via web dashboard or /schedule in CLI

Direct Answer Block

A Claude Code Routine is a saved configuration — a prompt, repositories, and MCP connectors — that executes automatically on Anthropic’s managed cloud infrastructure. You define it once, then it runs on schedule, when called via API, or when a GitHub event fires. Unlike CI/CD pipelines that run deterministic scripts, routines run full AI-powered coding sessions autonomously: they reason about your codebase, use tools, and produce PRs.

Introduction

Most automation tools force a tradeoff: either you write deterministic scripts that can’t think, or you run AI agents that need constant supervision. Claude Code Routines split the difference. They run unattended on cloud infrastructure — scheduled, API-triggered, or GitHub-event-driven — but each run is a full Claude Code session with access to your repos, MCP connectors, and shell. The routine’s prompt defines what to do; the infrastructure handles when and how. No laptop, no open terminal, no approval prompts.

What are Claude Code Routines and how do they differ from CI/CD pipelines?

Routines are not CI/CD. They are not GitHub Actions. They are autonomous AI coding sessions that run on Anthropic-managed cloud infrastructure when triggered.

The distinction matters because it changes what you automate:

  • CI/CD runs a deterministic script. It can’t inspect a PR and decide whether the changes introduce a subtle security issue. It can lint, test, and build — but it can’t reason.
  • Routines run a Claude Code session. It reads your codebase, applies judgment, uses tools, and produces a PR with inline comments explaining why something should change.

“A routine stores a prompt, repositories, and connectors as one configuration and runs it automatically. The system executes routines on managed cloud infrastructure, so your workflows run without a local machine.” — AlphaSignal summary of Anthropic’s announcement

According to Anthropic’s documentation, each routine can have one or more triggers attached:

Trigger What fires it Example
Schedule Cron-based recurring or one-off time Nightly PR review at 9am
API HTTP POST with bearer token Alerting system fires routine on error threshold
GitHub Repository events (PR opened, release created) Auto-review every new PR

A single routine can combine triggers. A PR review routine can run nightly, trigger from a deploy script via API, and also react to every new PR opened.

Anthropic’s documentation explicitly distinguishes routines from /loop (session-scoped, stops when terminal closes), Desktop scheduled tasks (runs on your machine), and GitHub Actions (deterministic CI). Routines are the “runs on Anthropic cloud, survives independently” tier.

How do you create a routine from the web dashboard, the CLI, and the Desktop app?

Method 1: Web dashboard (claude.ai/code/routines)

This is the most complete creation surface. All three trigger types (schedule, API, GitHub) are configurable here. The creation form walks through:

  1. Name and prompt — the prompt is the most important part. Since routines run autonomously, the prompt must be self-contained and explicit about what success looks like. Anthropic’s docs note: “The prompt is the most important part: the routine runs autonomously, so the prompt must be self-contained and explicit about what to do and what success looks like.”

  2. Repositories — add GitHub repos for Claude to work in. Each is cloned at run start from the default branch. Claude creates claude/-prefixed branches for changes.

  3. Environment — pick a cloud environment controlling network access (Trusted, Custom, Full), environment variables (API keys, tokens), and a setup script (dependencies install). The setup script result is cached across runs.

  4. Trigger — schedule (preset or custom cron via /schedule update), API (URL + token generated after save), or GitHub event (PR/release with filters).

  5. Connectors and permissions — all connected MCP connectors (Slack, Linear, Google Drive) are included by default. Remove unused ones. Enable “Allow unrestricted branch pushes” if the routine should push to existing branches.

Method 2: CLI (/schedule)

Run /schedule to create a scheduled routine conversationally. You can pass a description:

/schedule daily PR review at 9am
/schedule clean up feature flag in one week

Claude walks through the same info the web form collects. The CLI creates scheduled routines only — to add API or GitHub triggers, edit on the web.

Manage existing routines from CLI:

/schedule list        # see all routines
/schedule update      # change one
/schedule run         # trigger immediately

Method 3: Desktop app

Click Routines in the sidebar, then New routine, and choose Remote (vs Local for Desktop scheduled tasks). All three surfaces write to the same cloud account — a routine created in one appears everywhere immediately.

How do you configure schedule triggers, API triggers, and GitHub event triggers?

Schedule triggers

Pick a preset (hourly, daily, weekdays, weekly) or a custom cron via /schedule update. Minimum interval is 1 hour. Times are entered in your local timezone and converted automatically.

For one-off runs, describe the time naturally:

/schedule tomorrow at 9am, summarize yesterday's merged PRs
/schedule in 2 weeks, open a cleanup PR that removes the feature flag

One-off runs don’t count against the daily routine run cap. After firing, they auto-disable.

API triggers

API triggers give a routine a dedicated HTTP endpoint. POST to the endpoint with a bearer token to start a new session.

Setup (web only):

  1. Edit routine → Add another trigger → API
  2. Copy the URL
  3. Click Generate token — shown once, store securely

Call:

curl -X POST https://api.anthropic.com/v1/claude_code/routines/trig_01ABC.../fire 
  -H "Authorization: Bearer sk-ant-oat01-xxxxx" 
  -H "anthropic-beta: experimental-cc-routine-2026-04-01" 
  -H "Content-Type: application/json" 
  -d '{"text": "Sentry alert SEN-4521 fired in prod. Stack trace attached."}'

Response returns a session ID and URL for live monitoring. Note the beta header — this is research preview.

GitHub triggers

Configure from web UI only. Requires the Claude GitHub App installed on the target repo.

Supported events: Pull request (opened, closed, assigned, labeled, synchronized) and Release (created, published, edited, deleted).

Filters (all must match):

  • Author, Title, Body, Base branch, Head branch, Labels, Is draft, Is merged

Example: Base branch main + Head branch contains auth-provider → focused auth module review.

Each matching event starts a new session — no session reuse across events.

What are 6 real-world use cases for Claude Code routines — from PR review to alert triage?

A visual 2x3 grid of use case cards: Backlog maintenance, Alert triage, Bespoke code review, Deploy verification, Docs drift, Library port.

Anthropic’s documentation provides six example use cases, each mapping a trigger type to unattended, repeatable work:

1. Backlog maintenance (schedule trigger)

Runs weeknights against your issue tracker via MCP connector. Reads new issues, applies labels, assigns owners based on referenced code areas, posts summary to Slack.

2. Alert triage (API trigger)

Monitoring tool calls routine’s API endpoint with error threshold breach. Routine pulls stack trace, correlates with recent commits, opens draft PR with proposed fix and link to alert. On-call reviews PR instead of starting from blank terminal.

3. Bespoke code review (GitHub trigger)

Runs on pull_request.opened. Applies team’s review checklist, leaves inline comments for security/performance/style, adds summary comment. Human reviewers focus on design, not mechanical checks.

4. Deploy verification (API trigger)

CD pipeline calls routine after production deploy. Routine runs smoke checks, scans error logs for regressions, posts go/no-go to release channel.

5. Docs drift (schedule trigger)

Runs weekly. Scans merged PRs, flags documentation referencing changed APIs, opens update PRs against docs repo.

6. Library port (GitHub trigger)

Runs on pull_request.closed filtered to merged PRs in one SDK repo. Ports the change to a parallel SDK in another language, opens matching PR — keeps libraries in step without human re-implementation.

These aren’t hypothetical — they map to the connector ecosystem (Slack, Linear, Google Drive, GitHub) and the network access controls Anthropic provides.

How do routines handle repository access, branch permissions, and connector integrations?

Repository access

Routines need GitHub access to clone repos. When creating from CLI with /schedule, Claude checks if GitHub is connected and prompts /web-setup if not. Two authentication methods exist via the claude.ai interface — OAuth app installation or personal access token.

Each repo is cloned fresh on every run, starting from the default branch unless the prompt specifies otherwise.

Branch permissions

By default, Claude can only push to branches prefixed with claude/. This prevents routines from accidentally modifying protected or long-lived branches. To remove this restriction, enable “Allow unrestricted branch pushes” per repository.

Connectors

Routines use your connected MCP connectors (Slack, Linear, Google Drive, etc.) to read/write to external services. All currently connected connectors are included by default on routine creation. Remove any the routine doesn’t need.

Important: MCP servers added locally with claude mcp add are stored on your machine, not your claude.ai account. To use them in routines, add them as connectors at claude.ai/customize/connectors, or declare them in a committed .mcp.json so they’re part of the cloned repository.

Network access

Each routine runs in a cloud environment with controlled network access. The Default environment uses Trusted access: package registries, cloud provider APIs, and common dev domains are reachable, but arbitrary domains are blocked (returns 403). MCP connector traffic routes through Anthropic’s servers, bypassing network restrictions.

Environment and secrets

Environment variables (API keys, tokens) are set in the cloud environment, not in the prompt. A setup script installs dependencies — the result is cached so it doesn’t re-run every session.

How do usage limits, daily run caps, and extra-usage billing work for routines?

Routines draw down your subscription usage like interactive sessions, with additional constraints:

Constraint Detail
Daily run cap Per-account limit on routine starts. View at claude.ai/code/routines
One-off runs Exempt from daily cap — consume regular subscription usage
GitHub webhook caps Per-routine and per-account hourly caps during research preview
Extra usage Organizations with extra usage enabled can exceed caps on metered overage
Without extra usage Additional runs rejected until window resets

The daily cap is visible in the routines dashboard and billing settings. Enable extra usage from Settings > Billing to handle overflow.

Important caveat from Anthropic’s docs: “A green status in the run list means the session started and exited without an infrastructure error. It does not mean the task in your prompt succeeded. Open the run to read the transcript and confirm what Claude actually did.”

Admins can disable routines organization-wide via the toggle at claude.ai/admin-settings/claude-code. When disabled, existing routines stop and new ones can’t be created.

Frequently Asked Questions

Q: Do routines run when my laptop is closed?

Yes. Routines execute on Anthropic-managed cloud infrastructure. This is the key difference from /loop (needs open terminal) and Desktop scheduled tasks (needs machine on).

Q: Can I use routines with repos not on GitHub?

Routines require GitHub-connected repositories for cloning. GitLab, Bitbucket, and self-hosted repos are not currently supported for routine cloning.

Q: What happens if a routine run fails?

The session exits with an error visible in the run transcript. Green status means no infrastructure error — not that the task succeeded. Always review the transcript. Routines don’t retry automatically; configure a schedule trigger for recurring attempts.

Q: Can multiple people share a routine?

Routines belong to your individual claude.ai account and are not shared with teammates. Anything the routine does through your connected GitHub or connectors appears as you (commits, PRs, Slack messages use your identity).

Q: What’s the minimum schedule interval?

1 hour. Expressions running more frequently are rejected. For sub-hour polling, use /loop in an open session or Desktop scheduled tasks.

Q: How do routines differ from GitHub Actions?

GitHub Actions run deterministic workflows in CI. Routines run AI-powered coding sessions that reason about your codebase and produce intelligent output (PR comments, summaries, analysis). They complement each other — Actions for deterministic CI, routines for intelligent automation.

Glossary

  • Routine: A saved Claude Code configuration (prompt + repos + connectors) that executes autonomously on Anthropic cloud infrastructure
  • Cloud environment: The runtime configuration for cloud sessions, controlling network access, environment variables, and setup scripts
  • MCP connector: An integrated MCP server connected to your claude.ai account that routines can use to read/write external services
  • Trusted network access: The default network policy allowing package registries and cloud APIs while blocking arbitrary domains
  • Daily run cap: Per-account limit on how many routine runs can start per day, visible in the routines dashboard
  • /schedule: The CLI command to create, list, update, or run routines conversationally

Author

Ramsis Hammadi — AI/ML engineer specializing in GenAI, LLM engineering, and automation. Full bio →