Distributed Tracing in NestJS: End-to-End Request Visibility with OpenTelemetry

In a monolithic application, debugging a slow or failing request is straightforward, you have one codebase, one log stream, and one execution context to reason about. In a microservices architecture, a single user request can touch a dozen services, three databases, and two external APIs before a response is returned. When something goes wrong, where do you look?

This is the problem distributed tracing solves. By attaching a unique trace identifier to every request and propagating it across every service boundary, distributed tracing gives you a complete, chronological map of exactly what happened, which services were called, in what order, how long each took, and where failures occurred.

OpenTelemetry is the open-source observability standard that makes this possible across any language and infrastructure. And NestJS, with its modular architecture and middleware system, is exceptionally well-suited for clean OpenTelemetry integration.

This guide walks through setting up distributed tracing in NestJS from scratch, auto-instrumenting HTTP and database calls, creating custom spans for business logic, propagating context across service boundaries, and visualizing traces in Grafana Tempo.

How Distributed Tracing Works

Before writing code, it helps to understand the core concepts:

  • Trace: the complete journey of a single request across all services. Identified by a traceId.
  • Span: a single unit of work within a trace (e.g., an HTTP handler, a database query, an external API call). Each span has a start time, duration, and status.
  • Context Propagation: the mechanism by which trace and span identifiers are passed between services, typically via HTTP headers (traceparent).
  • Exporter: the component that sends collected spans to a backend (Tempo, Jaeger, Zipkin, Datadog).

A fully traced request looks like this:

Trace: usr_checkout_8f3a2c
├── [0ms]   API Gateway          → POST /checkout            (12ms)
├── [12ms]  orders-service       → createOrder()             (45ms)
│   ├── [14ms]  PostgreSQL       → INSERT orders             (18ms)
│   └── [33ms]  payments-service → chargeCard()              (24ms)
│       └── [35ms]  Stripe API   → POST /charges             (21ms)
└── [57ms]  notifications-service → sendConfirmation()       (8ms)

Every box is a span. Every span shares the same traceId. The entire tree is the trace.

Step 1 – Install OpenTelemetry Packages

NestJS’s OpenTelemetry setup requires the core SDK plus instrumentation libraries for Node.js HTTP, Express (which NestJS runs on), and any databases or HTTP clients your services use:

npm install 
  @opentelemetry/sdk-node 
  @opentelemetry/auto-instrumentations-node 
  @opentelemetry/exporter-trace-otlp-http 
  @opentelemetry/resources 
  @opentelemetry/semantic-conventions 
  @opentelemetry/api

Step 2 – Create the Tracing Bootstrap File

OpenTelemetry must be initialized before any other application code, before NestJS bootstraps, before TypeORM connects, before any modules load. Create a dedicated file for this:

// src/tracing.ts
import { NodeSDK } from '@opentelemetry/sdk-node';
import { getNodeAutoInstrumentations } from '@opentelemetry/auto-instrumentations-node';
import { OTLPTraceExporter } from '@opentelemetry/exporter-trace-otlp-http';
import { Resource } from '@opentelemetry/resources';
import { SEMRESATTRS_SERVICE_NAME, SEMRESATTRS_SERVICE_VERSION, SEMRESATTRS_DEPLOYMENT_ENVIRONMENT } from '@opentelemetry/semantic-conventions';

const exporter = new OTLPTraceExporter({
  url: process.env.OTEL_EXPORTER_OTLP_ENDPOINT ?? 'http://localhost:4318/v1/traces',
});

const sdk = new NodeSDK({
  resource: new Resource({
    [SEMRESATTRS_SERVICE_NAME]: process.env.SERVICE_NAME ?? 'unknown-service',
    [SEMRESATTRS_SERVICE_VERSION]: process.env.APP_VERSION ?? '1.0.0',
    [SEMRESATTRS_DEPLOYMENT_ENVIRONMENT]: process.env.NODE_ENV ?? 'development',
  }),
  traceExporter: exporter,
  instrumentations: [
    getNodeAutoInstrumentations({
      '@opentelemetry/instrumentation-http': { enabled: true },
      '@opentelemetry/instrumentation-express': { enabled: true },
      '@opentelemetry/instrumentation-pg': { enabled: true },      // PostgreSQL
      '@opentelemetry/instrumentation-redis': { enabled: true },   // Redis
      '@opentelemetry/instrumentation-dns': { enabled: false },    // too noisy
      '@opentelemetry/instrumentation-fs': { enabled: false },     // too noisy
    }),
  ],
});

sdk.start();

process.on('SIGTERM', () => {
  sdk.shutdown().finally(() => process.exit(0));
});

Then import it as the very first line of your entry point:

// src/main.ts
import './tracing';  // ← must be first, before all other imports
import { NestFactory } from '@nestjs/core';
import { AppModule } from './app.module';

async function bootstrap() {
  const app = await NestFactory.create(AppModule);
  await app.listen(3000);
}
bootstrap();

With this in place, every inbound HTTP request, outbound HTTP call, and PostgreSQL query is automatically traced, zero additional code required in your controllers or services.

Step 3 – Adding Custom Spans for Business Logic

Auto-instrumentation covers infrastructure-level operations. Custom spans capture business logic that matters to your domain, the operations auto-instrumentation doesn’t know about:

// src/orders/orders.service.ts
import { Injectable } from '@nestjs/common';
import { trace, SpanStatusCode, context } from '@opentelemetry/api';

const tracer = trace.getTracer('orders-service');

@Injectable()
export class OrdersService {

  async createOrder(dto: CreateOrderDto): Promise<Order> {
    return tracer.startActiveSpan('orders.createOrder', async (span) => {
      try {
        // Add semantic attributes to the span
        span.setAttributes({
          'order.customerId': dto.customerId,
          'order.itemCount': dto.items.length,
          'order.currency': dto.currency,
        });

        const order = await this.processOrder(dto);

        span.setAttributes({ 'order.id': order.id });
        span.setStatus({ code: SpanStatusCode.OK });

        return order;
      } catch (error) {
        span.setStatus({
          code: SpanStatusCode.ERROR,
          message: error instanceof Error ? error.message : 'Unknown error',
        });
        span.recordException(error as Error);
        throw error;
      } finally {
        span.end(); // always end the span
      }
    });
  }

  private async processOrder(dto: CreateOrderDto): Promise<Order> {
    return tracer.startActiveSpan('orders.processOrder', async (span) => {
      try {
        // Nested span — appears as a child in the trace tree
        const inventory = await this.checkInventory(dto.items);
        span.addEvent('inventory.checked', { available: inventory.allAvailable });

        const order = await this.orderRepo.create(dto);
        span.addEvent('order.persisted', { orderId: order.id });

        return order;
      } finally {
        span.end();
      }
    });
  }
}

Key practices for custom spans:

  • Always call span.end(), an unclosed span leaks memory and never exports. Use try/finally to guarantee it.
  • Use semantic attribute names. Prefix with your domain (order., user., payment.) for consistent querying.
  • Record exceptions with span.recordException(), this attaches the full stack trace to the span in Tempo.
  • Add events for significant moments within a span (span.addEvent()), they appear as timestamped annotations on the span timeline.

Step 4 – Context Propagation Across Services

A trace is only useful if it spans service boundaries. When orders-service calls users-service, the trace context must travel with the request via HTTP headers.

Good news: if both services use OpenTelemetry with HTTP auto-instrumentation enabled, context propagation happens automatically. The outbound HTTP call from orders-service injects traceparent and tracestate headers, and users-service extracts them, linking the spans into the same trace tree.

For manual HTTP clients (e.g., Axios without auto-instrumentation), inject headers explicitly:

import { propagation, context } from '@opentelemetry/api';
import axios from 'axios';

async function callUsersService(userId: string) {
  const headers: Record<string, string> = {};

  // Inject current trace context into headers
  propagation.inject(context.active(), headers);

  const response = await axios.get(`${USERS_SERVICE_URL}/users/${userId}`, {
    headers,
  });

  return response.data;
}

For NestJS microservices using TCP or message brokers (NATS, RabbitMQ, Kafka), inject trace context into the message payload or metadata:

// Injecting context into a NestJS microservice message
const carrier: Record<string, string> = {};
propagation.inject(context.active(), carrier);

this.client.emit('order_placed', {
  ...orderPayload,
  _traceContext: carrier, // carry trace headers in the message
});

On the consumer side, extract and activate the context before processing:

@EventPattern('order_placed')
async handleOrderPlaced(data: OrderPlacedEvent) {
  const parentContext = propagation.extract(context.active(), data._traceContext ?? {});

  await context.with(parentContext, async () => {
    // All spans created here are children of the originating trace
    await this.processOrder(data);
  });
}

Step 5 – Trace-Log Correlation

Distributed tracing and structured logging are most powerful when correlated. By injecting the current traceId and spanId into every log entry, you can jump from a log line directly to the corresponding trace in Tempo, and vice versa.

// src/common/middleware/trace-context.middleware.ts
import { Injectable, NestMiddleware } from '@nestjs/common';
import { Request, Response, NextFunction } from 'express';
import { trace, context } from '@opentelemetry/api';
import { PinoLogger } from 'nestjs-pino';

@Injectable()
export class TraceContextMiddleware implements NestMiddleware {
  constructor(private readonly logger: PinoLogger) {}

  use(req: Request, res: Response, next: NextFunction) {
    const span = trace.getActiveSpan();
    const spanContext = span?.spanContext();

    if (spanContext) {
      // Pino's child logger binds these fields to every subsequent log in the request
      this.logger.assign({
        traceId: spanContext.traceId,
        spanId: spanContext.spanId,
        traceFlags: spanContext.traceFlags,
      });
    }

    next();
  }
}

In Grafana, this enables Loki-to-Tempo linking, click a traceId in a Loki log query and jump directly to the full distributed trace in Tempo. This is the observability trifecta, logs, traces, and metrics unified in a single investigation workflow.

Step 6 – Visualizing Traces in Grafana Tempo

Grafana Tempo is the recommended trace backend for teams already on the Grafana stack (and pairs naturally with Grafana Faro for frontend-to-backend tracing, as covered in the previous article).

Send spans to Tempo via the OpenTelemetry Collector:

# otel-collector-config.yaml
receivers:
  otlp:
    protocols:
      http:
        endpoint: 0.0.0.0:4318
      grpc:
        endpoint: 0.0.0.0:4317

exporters:
  otlp:
    endpoint: tempo:4317
    tls:
      insecure: true

service:
  pipelines:
    traces:
      receivers: [otlp]
      exporters: [otlp]

Once traces are flowing into Tempo, configure Grafana dashboards to:

  • Search traces by service name, operation name, duration, and status
  • View flame graphs showing the time breakdown of every span in a trace
  • Set alerts on p95/p99 latency for critical operations
  • Link traces to logs via traceId in Loki datasource configuration

Step 7 – CI/CD and Environment Configuration

Manage OpenTelemetry configuration via environment variables, the standard supported by all OTEL SDKs:

# .env.production
SERVICE_NAME=orders-service
APP_VERSION=2.4.1
NODE_ENV=production
OTEL_EXPORTER_OTLP_ENDPOINT=http://otel-collector:4318/v1/traces
OTEL_TRACES_SAMPLER=parentbased_traceidratio
OTEL_TRACES_SAMPLER_ARG=0.1   # sample 10% of traces in production

Sampling is critical in production. Tracing 100% of requests at scale generates enormous volume and cost. Use parent-based ratio sampling, if the upstream service sampled the request, all downstream services honor that decision, keeping traces complete while reducing overall volume.

Common Pitfalls to Avoid

Initializing OpenTelemetry after NestJS bootstraps: If tracing.ts is not the first import in main.ts, auto-instrumentation patches won’t apply to already-loaded modules. The SDK must load before any instrumented libraries.

Forgetting span.end(): Every span that isn’t explicitly ended leaks memory and never exports. Always use try/finally blocks around custom spans.

Over-instrumenting: Not every function needs a custom span. Focus on operations with meaningful duration variance, external calls, database queries, and complex business logic. Instrumenting trivial utility functions adds noise without insight.

Ignoring sampling in production: Tracing 100% of requests is expensive. Configure ratio-based sampling early, retrofitting it later requires changes across every service.

Not propagating context through message brokers: Context propagation via HTTP headers is automatic, but message broker propagation requires manual injection and extraction. Skipping it breaks the trace tree at every async boundary.

Conclusion

Distributed tracing with OpenTelemetry and NestJS transforms debugging in microservices from guesswork into a precise, evidence-based workflow. A single traceId gives you the complete story of any request, every service it touched, every database query it triggered, every external call it made, and exactly where time was spent or errors occurred.

Set up auto-instrumentation first for immediate value with zero code changes, layer in custom spans for your critical business operations, enforce context propagation across all service boundaries, and correlate traces with your structured logs. Combined with Grafana Faro for frontend traces, you achieve the observability holy grail: end-to-end request visibility from the user’s click to the database and back.

Running NestJS microservices on Kubernetes? OpenTelemetry’s Kubernetes operator can inject the collector as a sidecar automatically, no per-pod configuration required. More on that in a future post.

AWS vs GCP ตอนที่ 4: ต่อเครื่องออกอินเตอร์เน็ตโดยไม่เปิด Public IP

หนึ่งในเคสพื้นฐานที่สุดเวลาใช้ server บน cloud ก็คือ
“อยากให้เครื่องออกอินเตอร์เน็ตได้ แต่ไม่อยากเปิด public IP”

บทความนี้จะสรุปเปรียบเทียบวิธีมาตรฐานที่ AWS และ GCP ใช้แก้ปัญหานี้ แบบภาพรวม

จุดประสงค์ของบทความคือเพื่อเห็นภาพรวมคร่าวๆ และจะละรายละเอียดส่วนที่คิดว่าไม่จำเป็นต้องลงรายละเอียด

เป้าหมาย

ต้องการให้ server สื่อสารกับอินเตอร์เน็ตได้ (HTTP/HTTPS) แต่ไม่ต้องการเปิด public IP

แนวคิดหลัก

Inbound Traffic

ในเคสนี้เราจะใช้ Load Balancer เป็นทางเข้าสำหรับรับ traffic จากภายนอก
ซึ่งจริงๆ มี instance เครื่องเดียวก็ต่อกับ LB ก็ได้ แต่โดยปกติจะใช้เป็น instance group (และมี auto-scaling / auto-healing)

หมายความว่าเราจะต้องเตรียมส่วนหลักๆ ตามนี้

  • Load Balancer: สำหรับเป็นทางเข้า
  • Instance Group: คือกลุ่มเครื่องปลายทางที่ต้องการใช้งาน
  • Network Security: อนุญาต traffic จาก Load Balancer ไปที่กลุ่มเครื่องปลายทาง

Outbound Traffic

มีส่วนที่สำคัญ 2 ส่วน คือ

  • Internet Gateway: ประตูทางออกไปอินเตอร์เน็ต
  • NAT Gateway: เนื่องจาก private IP ไม่สามารถคุยกับอินเตอร์เน็ตได้โดยตรง จึงจำเป็นต้องมีตัวกลาง คือ Network Address Translation (NAT) ทำหน้าที่แปลง private IP เป็น public IP ก่อนออกอินเตอร์เน็ต

เปรียบเทียบความต่างในแต่ละส่วน

1) Network Architecture

AWS:

ต้องสร้าง Subnet แบ่งเป็น 2 วงในแต่ละ AZ (กรณีทำ HA จะต้องมีอย่างน้อย 2 AZ) และต้องจัดการ Route แยกกัน:

  • Public Subnet: เอาไว้วางสิ่งที่ต้องคุยกับอินเตอร์เน็ตโดยตรง เช่น NAT Gateway (กรณีที่เลือกแบบ Zonal) และ Application Load Balancer (ALB)
  • Private Subnet: เอาไว้วางสิ่งที่ต้องการให้เป็น private เช่น EC2

GCP:

สร้าง Subnet เดียวได้เลย ไม่มีคอนเซปท์ของ Public/Private Subnet

2) Internet Gateway

AWS:

ต้องสร้าง Internet Gateway (IGW) แล้วผูกกับ VPC เอง

GCP:

ไม่จำเป็นต้องสร้าง Internet Gateway เอง เพราะ GCP มี Default Internet Gateway ให้ใช้อัตโนมัติอยู่แล้ว

3) NAT Gateway

AWS:

ต้องสร้าง NAT Gateway ซึ่งสามารถเลือกได้ทั้งแบบ Regional (ใช้งานข้ามหลาย AZ ใน VPC) หรือ Zonal (ผูกกับ Subnet) โดยถ้าเลือก Zonal จะต้องวางไว้ที่ Public Subnet

GCP:

ต้องสร้าง Cloud NAT โดยตั้งค่าให้ใช้กับ Subnet ที่มีเครื่องปลายทาง

4) เส้นทางไปยังทางออก (Routing)

AWS:

ต้องกำหนด Route Table เองทั้งหมด

  • Public Subnet: 0.0.0.0/0 -> IGW
  • Private Subnet: 0.0.0.0/0 -> NAT Gateway (ถ้าเลือกแบบ Zonal จะต้องสร้าง Route Table แยกกันแต่ละ AZ เพราะชี้ไปที่ NAT Gateway คนละตัว แต่สำหรับแบบ Regional สามารถใช้ Route Table เดียวกันแชร์กันทุก AZ เพราะใช้ NAT Gateway ตัวเดียวกัน)

GCP:

ไม่จำเป็นต้องตั้งค่าอะไร

  • VPC มีเส้นทางออกอินเตอร์เน็ตให้ใน Default Route อยู่แล้ว: 0.0.0.0/0 -> Default Internet Gateway
  • เมื่อสร้าง Cloud NAT gateway ผูกกับ Subnet แล้ว traffic จาก VM จะวิ่งออกอินเตอร์เน็ตได้โดยใช้ Default Route ของ VPC ได้โดยไม่ต้องมี public IP

5) Network Security

AWS:

  • หลักการ: ใช้ Security Group เป็นหลัก
  • สำหรับขาเข้า: ต้องอนุญาต traffic 2 ขา:

    • Internet -> ALB: ตั้งค่า Security Group สำหรับ ALB อนุญาต traffic จากอินเตอร์เน็ต
    • ALB -> EC2: ตั้งค่า Security Group สำหรับ EC2 อนุญาต traffic จาก ALB
  • สำหรับขาออก: ไม่ต้องตั้งค่าอะไร เพราะ traffic ขาออกสามารถวิ่งผ่านได้โดย default อยู่แล้ว

GCP:

  • หลักการ: ใช้ Firewall Rules / Policy แล้วใช้ Tags เลือกเครื่องเป้าหมาย
  • สำหรับขาเข้า: ต้องตั้งค่าแค่ขาเดียว อนุญาต traffic จาก LB เข้ามาหาเครื่อง

    • Internet -> LB: ไม่ต้องตั้งค่าอะไร เพราะ LB อยู่ที่ Google Front End (นอก VPC) รับ traffic จากอินเตอร์เน็ตได้อยู่แล้ว
    • LB -> VM: สร้าง Firewall Rule อนุญาต LB / Health Check (130.211.0.0/22 กับ 35.191.0.0/16) ให้วิ่งเข้าเครื่องเป้าหมายได้
  • สำหรับขาออก: ไม่ต้องตั้งค่าอะไร เพราะ traffic ขาออกสามารถวิ่งผ่านได้โดย default อยู่แล้ว

6) Instance Group

AWS:

ใช้ Auto Scaling Group (ASG)

GCP:

ใช้ Managed Instance Group (MIG)

7) Load Balancer

AWS:

  • ใช้ Application Load Balancer (ALB)
  • กลุ่มเครื่องปลายทางคือ Target Group (มีได้หลาย Target Group)
  • ต้องสร้าง Target Group และตั้งค่า Health Check ของแต่ละกลุ่ม แล้วตั้งค่าให้ Listener ชี้ไปที่ Target Group
  • ต้องผูก ASG เข้ากับ Target Group (ASG ใช้สำหรับสเกลจำนวน ต้องเชื่อมเข้ากับ Target Group ของ ALB เพื่อใช้เป็นปลายทาง)

GCP:

  • ใช้ Global External Application Load Balancer
  • กลุ่มเครื่องปลายทางคือ Backend Service (มีได้หลาย Backend Service)
  • ต้องผูก Instance Group เข้ากับ Backend Service
  • การตั้งค่า Health Check ใน Backend Service:
    • สามารถสร้าง Health Check ใหม่ในขั้นตอนการตั้งค่า Backend Service ได้เลย
    • หรือจะสร้าง Health Check แยกไว้ก่อนแล้วค่อยเลือกมาผูกกับ Backend Service ทีหลังก็ได้
  • ใช้ Routing Rules ซึ่งเป็น URL Map กำหนดเส้นทางว่าจะไปที่ Backend Service ไหน

8) Health Check

AWS:

  • ผูกอยู่กับ Target Group ของ ALB เป็นหลัก
  • โดย default แล้ว ASG จะใช้ EC2 status เป็น Health Check ซึ่งเช็คแค่ว่าเปิดเครื่องติดรึเปล่า
  • ถ้าผูก ASG กับ Target Group จะสามารถเลือกให้ใช้ ELB Health Check ได้ (Health Check ของ Target Group)

GCP:

  • สามารถสร้างแยกไว้ก่อนแล้วเอาไปผูกกับ LB หรือ MIG ทีหลังได้
  • ผูกกับ LB สำหรับการกระจายโหลด (เช็คว่าจะส่ง traffic ไปให้เครื่องได้รึเปล่า)
  • ผูกกับ MIG สำหรับจัดการ auto scaling / auto healing (เช็คว่าเครื่องยังทำงานได้อยู่รึเปล่า)

ภาพรวมการไหลของ traffic (logical)

Flow AWS GCP
Inbound Internet -> Internet Gateway -> ALB -> Private EC2 Internet -> Global External LB -> Private VM
Outbound Private EC2 -> NAT Gateway -> Internet Gateway -> Internet Private VM -> Cloud NAT -> Internet Gateway -> Internet

เปรียบเทียบขั้นตอนคร่าวๆ

สำหรับ AWS:

1) เตรียม Network

  • สร้าง VPC
  • ในแต่ละ AZ ที่ต้องการ สร้าง Subnet 2 วง สำหรับ Public Subnet และ Private Subnet

2) จัดการทางออก

  • สร้าง Internet Gateway (IGW) ผูกกับ VPC
  • สร้าง NAT Gateway:
    • เลือก Regional หรือถ้าเลือก Zonal ให้ตั้งค่าให้อยู่ใน Public Subnet ที่สร้างไว้
    • เลือก Connectivity Type เป็น public
  • ตั้งค่า Route Table สำหรับ Public Subnet:
    • สร้าง Route: 0.0.0.0/0 -> IGW
  • ตั้งค่า Route Table สำหรับ Private Subnet:
    • สร้าง Route: 0.0.0.0/0 -> NAT Gateway

3) จัดการ Network Security

  • สร้าง Security Group สำหรับ ALB:
    • สร้าง Inbound Rule (HTTP): Type: HTTP, Source: 0.0.0.0/0
    • สร้าง Inbound Rule (HTTPS): Type: HTTPS, Source: 0.0.0.0/0
  • สร้าง Security Group สำหรับ EC2:
    • สร้าง Inbound Rule (จาก ALB): Type: Custom TCP, Port: พอร์ตที่รันแอปพลิเคชั่น, Source: Security Group ของ ALB

4) จัดการ Load Balancer & Health Check:

  • สร้าง Internet-facing ALB
    • วางใน Public Subnet
    • สร้าง Target Group และตั้งค่า Health Check
    • Listener: เลือก Target Group

5) จัดการกลุ่มเครื่อง:

  • สร้าง Launch Template
  • สร้าง ASG:
    • เลือก Launch Template ที่สร้างไว้ และผูกเข้ากับ Target Group (ระบบจะสร้าง EC2 ขึ้นมาให้ใน Private Subnet โดยอัตโนมัติ)
    • วางใน Private Subnet เพื่อให้เครื่องอยู่ในวง private
    • เลือกผูกกับ existing load balancer แล้วเลือก Target Group
    • เลือก Turn on Elastic Load Balancing health checks เพื่อให้ ASG ใช้ Health Check เดียวกับ ALB

สำหรับ GCP:

1) เตรียม Network

  • สร้าง VPC (custom mode) และ Subnet 1 วง

2) จัดการ Network Security

  • สร้าง Firewall Rules
    • ระบุ Target Tag ตรงกับของ MIG (เตรียม Tag ไว้ก่อน)
    • อนุญาต source IP range 130.211.0.0/22 กับ 35.191.0.0/16
    • เลือก TCP พอร์ต 80

3) จัดการทางออก:

  • สร้าง Cloud NAT Gateway และ Cloud Router

4) จัดการ Health Check:

  • สร้างเตรียมไว้สำหรับผูกกับ MIG และ Load Balancer

5) จัดการกลุ่มเครื่อง

  • สร้าง Instance Template (อย่าลืมปิด public IP)
    • ตั้งค่า Network Tags ตามที่เซ็ตไว้ใน Firewall Rules
  • สร้าง MIG (stateless)
    • เลือก Instance Template ที่สร้างไว้
    • เลือก Health Check ที่สร้างไว้

6) จัดการ Load Balancer:

  • จอง Static IP สำหรับ LB
  • สร้าง Load Balancer
    • เลือก Global External Application Load Balancer
    • ตั้งค่า Frontend:
    • กำหนด static IP ตามช่วงที่เตรียมไว้
    • เพิ่ม frontend IP/port สำหรับช่องทางที่ต้องการ
    • ตั้งค่า Backend:
    • เลือก Health Check ที่สร้างไว้
    • สร้าง Backend Service ผูกกับ MIG ที่สร้างไว้

Zapier Free Plan in 2026: What 100 Tasks Actually Buy You

I spent a month inside Zapier’s free tier so you don’t have to. Here are the actual numbers, where they bite, and the moment I switched to self-hosting n8n on a $6 VPS.

The hard limits, no marketing

Pulled straight from the Zapier docs (and tested against my own account):

Limit Value
Tasks / month 100
Steps per Zap 2 (1 trigger + 1 action)
Polling interval 15 minutes
Premium apps Locked (Salesforce, Stripe, etc.)
Webhooks by Zapier Locked (it’s a “premium app”)
Filters / Paths / Formatter Locked
Autoreplay on errors Not available
Users 1
Support Community forum only

A task is one successful action. Trigger checks don’t count. Filters and Formatter wouldn’t count either — except you can’t use them.

What 100 tasks/month feels like

Quick math: if your Zap fires hourly, that’s 24 × 30 = 720 tasks/month. Done in 4 days. If it fires on every new email — 50/day average — done in 2 days.

Realistic free-tier capacity:

  • 1 Zap firing 3x/day → 90 tasks/month ✓
  • 1 Zap firing on form submissions, ~3/day → 90 tasks/month ✓
  • 1 Zap firing on every Shopify order in a real store → blown by day 5 ✗

When you hit the cap, runs aren’t lost — they’re held, queued in your Zap History. They replay when the month resets. So for batchable, non-time-critical stuff, the limit is annoying but survivable. For real-time alerts, it’s fatal.

The 2-step thing is the actual killer

People focus on the 100-task limit. The 2-step limit is worse.

Two steps means: one trigger + one action. No filter (“only continue if amount > $100”). No formatter (“convert timestamp to ISO”). No path (“if VIP customer, route to sales; else, ignore”).

Real automations need conditionals. Without them you get this anti-pattern:

Typeform submission → Create HubSpot contact

…where now every form submission creates a contact, including bots, duplicates, and the 3 internal team members testing the form. You can’t filter them out in Zapier Free.

The “fix” is splitting logic into multiple Zaps, but each runs separately and you can’t share state — you’re just paying tasks twice and getting worse logic.

15-minute polling, in case you forgot what slow feels like

Polling triggers (most non-instant apps) check for new data every 15 minutes on Free. Pro drops to 2 minutes.

What this means in practice:

9:00 — lead fills out form
9:14 — Zapier checks, sees lead, runs Zap
9:14 — Slack alert fires

A 14-minute delay for a “real-time” alert. If you’re competing for response time on leads (and you are), you’ve already lost.

Instant triggers (Stripe, Shopify, GitHub, a few others) bypass polling — they push to Zapier, which pushes to you. But most apps don’t expose instant triggers on Free.

What “premium apps” actually locks out

Zapier’s premium-app list includes: Salesforce, QuickBooks, ShipStation, PayPal, Magento, Microsoft Dynamics, Webhooks by Zapier, certain Stripe triggers, and a long tail of others.

The webhooks one is the kicker. If your stack relies on receiving webhook events from any service that doesn’t have a native Zapier integration — and most niche/regional services don’t — you literally cannot build the integration on Free. You need Pro.

Free vs Pro: the real cost gap

In 2026, there is no “Starter” plan anymore. The jump is Free → Pro, and Pro is $19.99/month billed annually or $29.99 monthly. That gets you 750 tasks, multi-step Zaps, premium apps, webhooks, filters, paths, formatter, 2-minute polling, autoreplay. Team is $103.50/mo for 2,000 tasks and 25 seats.

If you actually need automation that works, Pro is the floor. If you don’t actually need it, Free is fine forever.

The “screw it, I’ll host it myself” option

If you’re reading dev.to, you probably know n8n — open-source, self-hostable, no task counter, no two-step limit, real webhooks, code nodes. Here’s the entire setup:

# docker-compose.yml
version: "3.8"

services:
  n8n:
    image: docker.n8n.io/n8nio/n8n:latest
    restart: unless-stopped
    ports:
      - "5678:5678"
    environment:
      - N8N_HOST=n8n.yourdomain.com
      - N8N_PROTOCOL=https
      - N8N_PORT=5678
      - WEBHOOK_URL=https://n8n.yourdomain.com/
      - GENERIC_TIMEZONE=Europe/Kyiv
      - N8N_BASIC_AUTH_ACTIVE=true
      - N8N_BASIC_AUTH_USER=admin
      - N8N_BASIC_AUTH_PASSWORD=${N8N_PASSWORD}
      - DB_TYPE=postgresdb
      - DB_POSTGRESDB_HOST=postgres
      - DB_POSTGRESDB_DATABASE=n8n
      - DB_POSTGRESDB_USER=n8n
      - DB_POSTGRESDB_PASSWORD=${POSTGRES_PASSWORD}
    volumes:
      - n8n_data:/home/node/.n8n
    depends_on:
      - postgres

  postgres:
    image: postgres:16-alpine
    restart: unless-stopped
    environment:
      - POSTGRES_DB=n8n
      - POSTGRES_USER=n8n
      - POSTGRES_PASSWORD=${POSTGRES_PASSWORD}
    volumes:
      - postgres_data:/var/lib/postgresql/data

volumes:
  n8n_data:
  postgres_data:

Drop this on a $6/month Hetzner CX22 (or any VPS), point a subdomain at it, slap Caddy or Traefik in front for TLS, and you’ve got unlimited everything. The real cost is operational: you maintain it, back it up, update it. If you already run a VPS, this is a free upgrade. If you don’t, the maintenance overhead probably isn’t worth saving $20/month.

When Make’s free tier beats Zapier’s

If self-hosting feels like too much, Make.com’s free plan is the obvious migration:

  • 1,000 operations/month (10× Zapier)
  • Unlimited scenarios
  • Multi-step workflows
  • Filters, routers, aggregators
  • Real webhooks on free
  • Minimum 15-minute scheduling (same as Zapier Free)

The cost is a UI that’s more powerful and more confusing. Zapier optimised for “anyone can use it”; Make optimised for “anyone who’s willing to learn can do anything.” If you’re a dev, Make’s editor feels like home within an hour.

The decision tree

Are you just testing automation as a concept?
├── Yes → Stay on Zapier Free, set a 2-week timer, re-evaluate
└── No  → Do you already run a VPS?
         ├── Yes → Self-host n8n
         └── No  → Are most of your apps in Zapier's premium list?
                  ├── Yes → Zapier Pro ($19.99 annual)
                  └── No  → Make.com free tier

Most devs I know end up at n8n or Make. The Zapier Free → Pro path makes sense almost exclusively if your team already standardised on Zapier and your accounts are deeply integrated. For greenfield, the alternatives win on price/feature ratio.

When Free is genuinely enough

I don’t want to sound like “always self-host.” Zapier Free works for:

  • Personal triage Zaps. Starred Gmail → Todoist task. Maybe 1 task/day.
  • Form backup. Typeform → Google Sheet. Under 100 submissions/month.
  • Side-project notifications. New Stripe customer → Slack DM, if you’re under 100/month and Stripe’s instant trigger covers you.
  • Sandbox testing. Want to demo automation to a non-technical colleague? Zapier’s UX is the best teaching tool.

Anything beyond that — anything with logic, premium apps, real volume, real-time needs — you’ll outgrow it within the first month.

TL;DR

100 tasks/month + 2-step limit + 15-minute polling + no webhooks = a generous demo, not a production tool. For real work in 2026: Make.com Free if you want to stay no-code, n8n self-hosted if you have a VPS, Zapier Pro if your team is already locked in. The “Starter” tier is gone; the Free→Pro jump is the only path inside Zapier itself.

Originally published on trackstack.tech with a fuller decision framework and FAQ.

Veri kaybı riski yüzde 70 Nasıl azaltılır? Uzmanından kritik açıklamalar

Kurumların dijitalleşme yatırımları hız kazanırken veri güvenliği her zamankinden daha kritik bir mesele haline geliyor. 17 yılı aşkın profesyonel deneyime sahip bulut teknolojileri uzmanı Sefa Teyek, veri kaybı riskinin doğru stratejilerle yüzde yetmişe kadar azaltılabileceğini belirterek şirketlere önemli uyarılarda bulundu. Teyek, bulut altyapısının doğru kurgulanmasının ve veri yönetimi süreçlerinin profesyonel biçimde ele alınmasının bu süreçte belirleyici rol oynadığını özellikle vurgu

Sanayicilerden yeni enerji sistemi eleştirisi

Aydın Sanayi Odası, lisanssız GES yatırımlarında uygulanan saatlik mahsuplaşma sisteminin sanayiciler üzerinde maliyet baskısı oluşturduğunu ve yatırım geri dönüş sürelerini uzattığını belirterek, düzenlemenin yeniden değerlendirilmesini talep etti.

I built an “Immune System” for AI Agents using Textual TUI & FastAPI Middleware (First Post!)

👋 Hello DEV Community!

A real-time prompt monitoring proxy, multi-LLM consensus router, and high-fidelity TUI dashboard built in Python.

This is my very first post here, and I’m thrilled to join the community!

I recently set out to solve a major issue in the autonomous AI agent space: safety and prompt manipulation. Autonomous agents need to make API calls, read files, and write code, but they are highly vulnerable to prompt injections, jailbreaks, and tool abuse.

To solve this, I built AegisOS — an inline, real-time middleware proxy and prompt-filtering shield, paired with a gorgeous terminal TUI dashboard to monitor and configure everything on-the-fly.

Here is a technical deep-dive into how I built it, the architecture, and what I learned along the way!

🛠️ The Architecture & How it Works

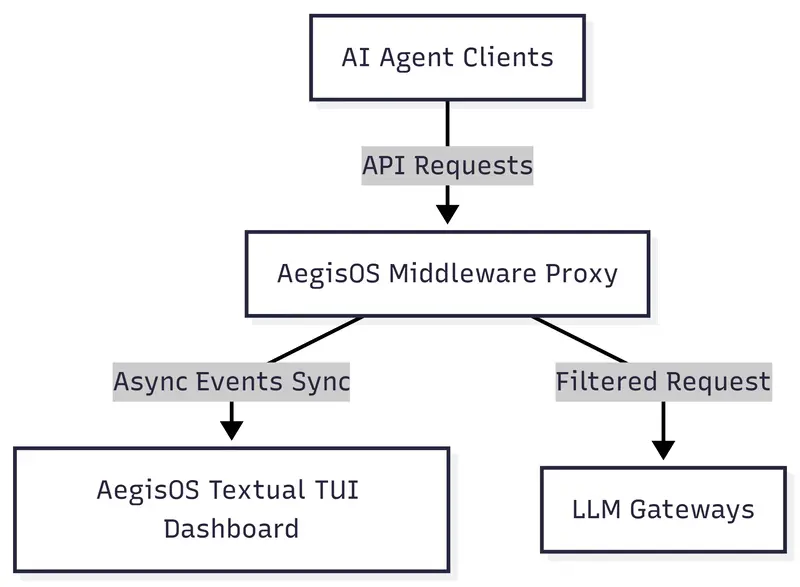
AegisOS operates as an intercepting middleware proxy between your AI agent clients and their LLM gateways.

TUI Interface Hotkeys & Screen Mapping

Hotkey Screen Name Screen Purpose
1 DASHBOARD Full system overview, telemetry gauges, and threat feed.
2 THREATS Deep catalog of all blocked exploit payloads and details.
3 AGENTS Monitor connected agent nodes, roles, and change isolation states.
4 MODELS Monitor active API gateways, latency, and consensus routing log.
5 TELEMETRY Real-time high-fidelity hardware consumption graphs.
6 SANDBOX Live exploit injector playground for custom and preset testing.
7 LOGS Continuous raw system operation and connection logs feed.
8 KEYS Manage, check, and test LLM provider keys directly inside the TUI.
9 MODEL CFG Customize provider models and trigger dynamic hot-reloads on-the-fly.
? HELP Full keyboard command summary and references card.
L LOCKDOWN Emergency global override—instantly isolate all active agents.
R REFRESH Refresh current screen data.
Q / ESC QUIT Safely close the TUI session.