Elevating Open Source: Integrating Accessibility for Superior Engineering Outcomes

The Imperative of Inclusive Open Source

Open source software is the backbone of modern technology, yet its full potential remains untapped if accessibility is an afterthought. A recent GitHub Community discussion, initiated by mlama007, brought to light a crucial new resource: an Accessibility Best Practices Guide for Open Source Projects. This guide offers maintainers practical, actionable steps to ensure their projects are usable by all, directly impacting overall project quality and aligning with key engineering OKRs focused on user experience, inclusivity, and delivery efficiency.

“Nothing About Us Without Us”: A Core Principle for Engineering Leadership

The guiding philosophy of the new accessibility guide is profound: “Nothing about us without us.” This emphasizes the critical need for engineering teams and product managers to partner with people with disabilities early and often throughout the development lifecycle. As P-r-e-m-i-u-m highlighted in the discussion, treating accessibility as an integral part of the process, rather than an afterthought, is a game-changer for open source projects. It’s not merely a compliance checkbox; it’s a strategic move that enhances product quality, reduces technical debt, and broadens your project’s reach. For technical leaders, this means fostering a culture where inclusive design is a non-negotiable aspect of every feature, influencing everything from initial design sprints to post-release maintenance.

Continuous Integration/Continuous Delivery (CI/CD) pipeline with an integrated accessibility testing step.Continuous Integration/Continuous Delivery (CI/CD) pipeline with an integrated accessibility testing step.## Actionable Steps for Accessibility Excellence

The guide breaks down complex accessibility concepts into manageable, impactful steps. Here’s a summary of key takeaways and community-contributed enhancements that can elevate your project’s accessibility posture:

Starting Strong with Documentation and Design

  • Accessibility Statement & ACCESSIBILITY.md: The guide provides a template and example for creating an ACCESSIBILITY.md file. This document serves as a public commitment to accessibility, informs users about the project’s current status, and outlines any known limitations. It’s a foundational step that communicates intent and transparency.
  • Accessible Documentation by Default: Simple practices like using proper headings, adding descriptive alt text to images (as suggested for the README), and providing captions for media ensure that project documentation itself is accessible. This sets a standard for all content creators within the project.
  • Designing Accessible Interfaces: Core principles include robust keyboard support for all interactive elements, correct semantic HTML, and thoughtful consideration of color contrast. These elements are crucial for users relying on assistive technologies or those with visual impairments.

Integrating Accessibility into Your Development Workflow

True accessibility isn’t built in a vacuum; it’s woven into the fabric of your development process. This is where the guide truly shines, offering practical integrations:

  • PR Checklists and Issue Templates: Building accessibility checks directly into your Pull Request (PR) checklists ensures that every code contribution considers inclusive design from the outset. Similarly, dedicated accessibility issue templates, including the suggested “a11y regression” label from Gecko51, streamline reporting and prioritization. This proactive approach helps maintain a high standard of quality and can be a key metric in development performance review examples for teams committed to excellence.
  • Continuous Testing with CI/CD: Automated accessibility testing in your Continuous Integration/Continuous Delivery (CI/CD) pipeline is non-negotiable for modern development. Gecko51 specifically recommends tools like axe-core with jest-axe for component-level testing or @axe-core/playwright for end-to-end flows. Pairing this with a Lighthouse accessibility audit step in your GitHub Actions workflow offers comprehensive coverage without slowing down your pipeline. These integrations provide immediate feedback, preventing accessibility issues from reaching production.

Magnifying glass highlighting accessibility details of a UI component: keyboard focus, alt text, and color contrast.Magnifying glass highlighting accessibility details of a UI component: keyboard focus, alt text, and color contrast.### Leveraging Tools and Expertise

  • GitHub Copilot for Accessibility Tasks: The guide suggests leveraging AI assistants like GitHub Copilot to help with accessibility tasks, such as generating semantic HTML or suggesting appropriate ARIA attributes. While AI is a powerful aid, human oversight remains critical.
  • ARIA Authoring Practices Guide (APG): For complex UI patterns, the ARIA Authoring Practices Guide (APG) at w3.org is an invaluable resource. Linking this directly in your ACCESSIBILITY.md empowers developers with pattern-by-pattern implementations for elements like tabs, modals, and comboboxes, ensuring correct semantics and behavior.
  • Partnering with the Disability Community: The core message, “Nothing about us without us,” extends to testing. Platforms like Fable and Access Works, mentioned by Gecko51, connect development teams with disability community members for paid usability testing. This direct feedback is invaluable, offering insights that automated tools simply cannot capture, and ensuring your project truly meets user needs.

Beyond Compliance: Driving Engineering Excellence and Achieving OKRs

Integrating accessibility is more than just meeting compliance standards; it’s a strategic investment in your project’s future. By making your open source project accessible, you:

  • Expand Your User Base: You open your project to a wider audience, including millions of users with disabilities, potentially increasing adoption and contributions.
  • Improve Overall Code Quality: Adhering to accessibility best practices often leads to cleaner, more semantic code, which is easier to maintain and extend. This reduces technical debt and improves long-term project health.
  • Enhance User Experience for Everyone: Many accessibility features benefit all users. Clearer navigation, better contrast, and robust keyboard support make an application more pleasant and efficient for everyone.
  • Align with Key Engineering OKRs: Projects that prioritize accessibility often see improvements in metrics related to user satisfaction, bug reduction, and code quality. This directly contributes to achieving engineering OKRs focused on product excellence, user retention, and efficient delivery. While not always directly visible on typical engineering dashboard examples, the impact on user engagement and overall project health is undeniable.

Start Small, Make a Big Impact

You don’t have to do everything at once. The guide encourages starting small. This week, consider one or two of these initial steps:

  • Add an ACCESSIBILITY.md file to your project.
  • Ensure every interactive element is keyboard reachable.
  • Fix missing form labels.
  • Add alt text to images in your README.

Every fix opens the door for someone who couldn’t use your project before. That’s a win worth celebrating, and a testament to truly inclusive engineering.

Deterministic First, LLM Second: An Advisory CI Pre-Screen

The old PR review system ran Gemini on every submission to the claude-code-plugins repo. It broke every time — quota errors, timeout, malformed JSON, the works. On 2026-05-15 I shipped a replacement and deleted the original on the same day.

The replacement is structured around two contracts. A deterministic classifier scores each submission against 12 rules and emits one of three verdicts. A Groq LLM bolted on top writes a 5-line summary as advisory polish. The deterministic layer is the product. The LLM never blocks.

The first live invocation immediately caught two bugs in the new system. That’s not failure. That’s the design working exactly as intended.

Five PRs in one day: #719, #723, #721, #724, #725. Together they close the epic and demonstrate why the deterministic-first pattern lets you replace a live system without a transition period.

The never-block contract: LLM outputs are advisory only. They never block the primary CI decision. If the LLM crashes, times out, or hallucinates, the deterministic verdict posts unchanged and the rest of the pipeline runs as if the LLM step never existed.

The two contracts that matter

The pre-screen workflow lives on two non-negotiable contracts that separate the product from the polish.

The first: the deterministic classifier is the product. It ingests validator JSON output, applies 12 rules to the changeset, and emits a verdict — PASS, CHANGES_REQUESTED, or HARD_BLOCK. Three outcomes. No gray. No ambiguity.

The classifier is a pure function. No I/O. No dependencies beyond the Python stdlib. Every test case maps to a rule. Every rule maps to observable, repeatable behavior. You can trace it from input to output without waiting for an API to respond or hoping an LLM doesn’t hallucinate.

PR #719 closed this layer in 579 new lines: .github/workflows/pr-prescreen.yml (~270 lines of workflow), scripts/pr-prescreen/classify.py (the classifier), and 12 unit tests covering every rule and edge case.

The workflow pattern is fork-safe: pull_request_target, SHA-pinned checkout, persist-credentials: false, never executes PR-controlled code. I copied the security pattern verbatim from the broken Gemini workflow (lines 23-79 — those were the load-bearing security). The security model didn’t change. The signal source did.

The second contract: the LLM is advisory, never blocks. When the deterministic layer says PASS, the Groq LLM generates a 5-line human-readable summary. The summary is rendered as a GitHub comment. It carries zero veto power.

If Groq times out, crashes, the API key leaks, or the model hallucinates — continue-on-error: true on the workflow step ensures the pre-screen verdict still posts. The comment just doesn’t appear. Slack doesn’t ping a summary. The rest of the CI runs unchanged. The primary signal is independent of the advisory layer.

The verdict table:

Verdict Deterministic rule Slack Comment Retry
PASS All skills ≥ C, no fatal errors Ping LLM summary (Groq) No
CHANGES_REQUESTED Missing fields or D/F grade Silent Deterministic details No
HARD_BLOCK Fatal validator error or missing impl Ping Deterministic details No

Groq runs only on PASS verdicts. If Groq fails, the verdict still posts — just without the summary. The deterministic layer is the contract. The LLM is the enhancement that runs inside the bounds of the contract.

PR #723 added the Groq integration: 388 new lines, scripts/pr-prescreen/summarize.py. It calls Groq directly via stdlib urllib — no SDK, no dependency overhead, no transitive vulnerability surface. Model: llama-3.3-70b-versatile. Wall-clock budget: 5 seconds. Single attempt. No retries.

The function is dead simple: POST the verdict JSON plus the changeset summary to Groq, parse the response, format it, return. 11 unit tests including fixes from PR #720’s review:

  • broad except Exception for the never-block contract — catch literally everything
  • OSError instead of TimeoutError for broader I/O coverage (socket.timeout, connection resets, the rest of the network failure surface)
  • json.JSONDecodeError guard for malformed responses

One tested invariant matters most: user-controlled PR content cannot override the fixed system prompt. The system prompt is a string literal in the source. The PR body is data. They never meet in the same code path. The classifier output goes into the user-role message; the system role is hard-coded and unreachable from outside.

What “never block” buys you

The old Gemini system gave an LLM veto power over 3,000+ shipped artifacts. Every time it broke, you couldn’t delete it — too much workflow depended on it staying alive. The downstream blast radius made retiring it a multi-week migration.

You’re stuck in maintenance mode: tuning prompts, chasing API changes, hoping the next model version handles the job the same way the last one did. You can’t turn it off. You can’t replace it. The veto power is a cage.

The never-block contract changes the trade-off entirely. The LLM is an enhancement layered on top of a deterministic core, not the core itself. If it malfunctions, the workflow degrades gracefully to the deterministic verdict — which you already trust to be correct.

You can replace the old system on the same day you deploy the new one. You’re not hedging bets. You’re not running both in parallel. You’re not waiting for three weeks of production data to prove the new system is safe. You measure trust against the deterministic layer; the LLM is polish that can’t revoke the decision.

PR #719 merged. The next day PR #721 deleted gemini-code-review.yml (179 lines of perpetually broken YAML) as a single breaking change.

That PR removed:

  • the workflow file itself
  • the orphaned ENABLE_GEMINI_REVIEW repo variable (operator deletes after merge)
  • the --thorough flag on the validator (advertised in the README but with broken plumbing)

It also added two new surfaces:

  • scripts/pr-prescreen/audit.py — appends one row per pre-screen run to freshie/inventory.sqlite, tracking the decision history for post-mortems and operator review. Inline CREATE TABLE IF NOT EXISTS schema. continue-on-error: true so DB failures don’t mask the primary signal.
  • a 265-line operator runbook at 000-docs/265-DR-GUID-pr-prescreen-system.md documenting the workflow, the verdicts, the audit schema, and the operator’s playbook.

No transition period. No parallel runs. No “let’s keep both for safety.” The new system had been live for exactly one workflow_dispatch manual invocation. That was enough to trust it — because the deterministic layer is the contract and it’s testable end-to-end without the LLM in the loop.

First live invocation found two bugs

The first production run was PR #722 — a hyperflow submission from an external contributor with 8 new skills. The run immediately surfaced two design flaws the test suite didn’t catch, because the test suite ran against toy data and missed the production edge cases.

Bug 1: empty-changeset explosion. PR #722 touched sources.yaml only — no plugins/ paths. The changeset filter triggered a fallback I’d written without thinking: “no plugin paths matched” → pass through all results → generate comment body for ~400 skills.

GitHub’s comment API caps bodies at 65,536 characters. The post failed silently. The deterministic verdict was correct, but the comment never landed and the Slack ping fired with an incomplete reference. Confusing signal to the operator. Real production bug caught by the first real-world input.

Bug 2: pointless comments. Even after fixing Bug 1, every infrastructure or documentation PR would still get a “PASS: no plugin paths matched” comment. That’s accurate — nothing happened. But it’s signal without value: visible noise on every non-plugin PR. Noise erodes signal over time. After a week, the operator stops reading the comments.

PR #724 fixed both in 50 lines net (+50/-163 after deleting the dead fallback). Three changes:

  • Empty changeset → emit empty filtered list (the classifier reports “no plugin paths,” doesn’t dump everything).
  • Skip the Post Comment and Slack Notify steps entirely when steps.diff.outputs.count == '0'.
  • Cap the per-skill table at 100 rows and truncate the body to 65,000 characters with a clear marker.

Empty changeset → no comment, no ping. The deterministic signal has preconditions. When those preconditions aren’t met, the system stays silent. No noise. No confusion.

The system found its own design flaws on first contact with reality. That’s not a weakness of the never-block contract — that’s the whole point. The deterministic classifier is safe enough to trust on its first invocation. The advisor runs under safe conditions. When reality violated the conditions, the system degraded gracefully and the operator fixed the precondition. Not the core logic. The core logic was never wrong. The assumptions feeding it were.

The spec was invisible — fix the surface

PR #722 was thoughtful. The contributor read CONTRIBUTING.md, followed the issue template, and wrote skills that made technical sense. All 8 were structurally sound. And all 8 were missing every one of the 6 marketplace-required frontmatter fields plus every one of the 7 body sections.

The expectations were buried in 000-docs/6767-b-SPEC-DR-STND-claude-skills-standard.md — the Global Master Standard for Claude Skills, v3.6.0, with the 100-point rubric and source citations against Anthropic + AgentSkills.io. Authoritative. Comprehensive. Invisible to contributors.

No link from the PR template. No mention in CONTRIBUTING.md. No signpost in the plugin-submission issue template. The deterministic classifier caught it all as D and F grades and reported each one. That’s correct — the validator is working. But the feedback loop was broken: the spec was invisible to contributors. Invisible requirements produce work that looks wrong until you read the fine print. By then you’ve already written it.

PR #725 surfaced the spec on three contributor surfaces:

  • CONTRIBUTING.md — new “Read the spec before you start” callout above “Before You Submit,” with the distilled requirements and direct links.
  • .github/PULL_REQUEST_TEMPLATE.md — top-of-template now points to CONTRIBUTING and to the spec. Also replaces stale “auto-review bot” phrasing that referred to the deleted Gemini workflow.
  • .github/ISSUE_TEMPLATE/plugin-submission.yml — adds a markdown description block with the spec callout and replaces 5 generic checkboxes with 7 spec-aware ones covering the real validator gates.

Also corrected two stale strings while I was there: “Gemini 2.5 Pro will post a review” → “the PR Pre-screen workflow,” and the example switched from the deprecated --enterprise flag to the current --marketplace flag.

The validator still grades the same way. The standard didn’t move. But now the spec isn’t a surprise buried 8 directories deep; it’s the first thing you see when you open a pull request. The expected drop in D/F submissions isn’t a change to the validator. It’s a change to the surface contributors actually touch.

The five-PR arc — #719, #723, #721, #724, #725 — is a case study in what never-block lets you do: ship something small, watch it collide with reality, and fix the collisions without unwinding the core. The deterministic classifier didn’t change between Phase 1 and the hot-fix. The Groq advisory didn’t change either. The preconditions and the surface visibility did, because reality demanded it.

Deterministic first, LLM second, never-block contract always. That’s the formula that lets you retire the old system on the same day and trust the replacement.

Walking Up a Merkle Tree: SHA-256 Proof Validation in Python

You get a file hash and a Merkle proof that claims it’s anchored in some blockchain transaction. How do you verify that claim without trusting the service that gave you the proof?

I built ProofLedger to create these proofs, but the verification should work independently. Anyone can validate a Merkle proof with the right algorithm. Here’s how to walk up the tree from leaf to root.

What’s Actually in a Merkle Proof

A Merkle proof is a list of sibling hashes that lets you reconstruct the path from your file’s hash up to the Merkle root. Each step combines your current hash with a sibling hash to produce the parent hash.

The proof tells you two things for each step:

  • The sibling hash (as a hex string)
  • Which side to put it on (“left” or “right”)
# Example proof structure
proof = {
    "hash": "a665a45920422f9d417e4867efdc4fb8a04a1f3fff1fa07e998e86f7f7a27ae3",
    "merkle_path": [
        {
            "hash": "b5d4045c3f466fa91fe2cc6abe79232a1a57cdf104f7a26e716e0a1e2789df78",
            "position": "right"
        },
        {
            "hash": "c3d4045c3f466fa91fe2cc6abe79232a1a57cdf104f7a26e716e0a1e2789df79",
            "position": "left"  
        }
    ]
}

That’s it. No magic, no proprietary formats. Just a starting hash and a list of directions.

The Hash Combination Algorithm

Each step up the tree combines two 64-character hex strings into one. The critical part is getting the concatenation order right.

import hashlib

def combine_hashes(left_hex, right_hex):
    """Combine two hex hashes into their parent hash."""
    # Concatenate the hex strings
    combined_hex = left_hex + right_hex

    # Convert to bytes, then hash
    combined_bytes = bytes.fromhex(combined_hex)
    parent_hash = hashlib.sha256(combined_bytes).hexdigest()

    return parent_hash

# Example
left = "a665a45920422f9d417e4867efdc4fb8a04a1f3fff1fa07e998e86f7f7a27ae3"
right = "b5d4045c3f466fa91fe2cc6abe79232a1a57cdf104f7a26e716e0a1e2789df78" 
parent = combine_hashes(left, right)
print(f"Parent: {parent}")

The order matters. combine_hashes(A, B) produces a different result than combine_hashes(B, A). That’s why the proof needs to specify position.

Walking the Full Path

Now you can iterate through the proof steps. Start with your file hash. At each step, combine it with the sibling hash in the specified position.

def verify_merkle_proof(file_hash, merkle_path):
    """Walk up a Merkle tree and return the computed root."""
    current = file_hash.lower()  # Normalize to lowercase

    for step in merkle_path:
        sibling = step["hash"].lower()
        position = step["position"]

        if position == "left":
            # Sibling goes left, current goes right
            current = combine_hashes(sibling, current)
        else:
            # Current goes left, sibling goes right  
            current = combine_hashes(current, sibling)

        print(f"Step: {current}")

    return current

# Test with our example proof
file_hash = "a665a45920422f9d417e4867efdc4fb8a04a1f3fff1fa07e998e86f7f7a27ae3"
merkle_path = [
    {
        "hash": "b5d4045c3f466fa91fe2cc6abe79232a1a57cdf104f7a26e716e0a1e2789df78",
        "position": "right"
    },
    {
        "hash": "c3d4045c3f466fa91fe2cc6abe79232a1a57cdf104f7a26e716e0a1e2789df79",
        "position": "left"  
    }
]

computed_root = verify_merkle_proof(file_hash, merkle_path)
print(f"Computed root: {computed_root}")

The function returns the root hash. That’s what should match the value stored on-chain.

Complete Verification Function

Here’s a complete verifier that handles the proof structure and validates the result:

import hashlib
import json

def hash_file(filepath):
    """Generate SHA-256 hash of a file."""
    sha256_hash = hashlib.sha256()
    with open(filepath, "rb") as f:
        for chunk in iter(lambda: f.read(4096), b""):
            sha256_hash.update(chunk)
    return sha256_hash.hexdigest()

def verify_proof(file_path, proof_data):
    """Verify a complete Merkle proof against a file."""
    # Hash the file
    file_hash = hash_file(file_path)

    # Extract proof components
    claimed_hash = proof_data["hash"]
    merkle_path = proof_data.get("merkle_path", [])

    # Verify file hash matches claim
    if file_hash != claimed_hash.lower():
        return {
            "verified": False,
            "error": f"File hash {file_hash} doesn't match claimed {claimed_hash}"
        }

    # If no merkle path, just verify the hash
    if not merkle_path:
        return {
            "verified": True,
            "file_hash": file_hash,
            "merkle_root": file_hash  # Root is just the file hash
        }

    # Compute the Merkle root
    computed_root = verify_merkle_proof(file_hash, merkle_path)

    return {
        "verified": True,
        "file_hash": file_hash,
        "merkle_root": computed_root,
        "path_length": len(merkle_path)
    }

# Usage
with open('proof.json', 'r') as f:
    proof = json.load(f)

result = verify_proof('document.pdf', proof)
print(json.dumps(result, indent=2))

Why This Matters for Evidence

You don’t need to trust the timestamping service. The Merkle proof lets you independently verify that your file hash was included in the transaction. You can check the blockchain explorer yourself to confirm the root hash exists on-chain.

The proof can’t be forged after the fact. If someone tries to create a fake proof for a file that wasn’t actually anchored, the computed root won’t match what’s on the blockchain.

For legal or forensic use, this means opposing counsel can verify your evidence timestamps independently. They don’t have to trust ProofLedger, ProofAnchor, or any other service. They just run the algorithm against the blockchain data.

That’s the point of cryptographic proofs. Math, not trust.

I Gave My Strategist Agent WebSearch. 5 Topics Took 20 Minutes. Splitting It Into 3 Roles Made It 3.

1-agent vs 3-role separation. Token cost down 60%, time from 20 minutes to 3 minutes.

I thought one agent doing everything was elegant. One claude -p call, “pick today’s topics and write the articles,” done. It took 20 minutes to pick 5 topics.

Splitting it into three agents took the same job to 3 minutes and dropped token cost by about 60%. The agents are dumber individually. The pipeline is faster.

The trick is not “more agents.” The trick is taking WebSearch out of the agent that does the judging.

1-agent vs 3-role separation. Token cost down 60%, time from 20 minutes to 3 minutes.

The 1-agent setup that took 20 minutes

The original setup was one prompt, one agent, one run:

“Look at yesterday’s GA4 data, pick 5 topics for today, and write the top one.”

The agent was allowed Bash, Read, Write, Edit, Grep, Glob, WebSearch, WebFetch. Everything it could possibly need.

For each candidate topic, it did roughly the same thing: WebSearch to check “what’s hot in this space right now,” WebSearch again to confirm a trend, WebSearch a third time to cross-check a competitor. Five topics, three to four searches each, 15 to 20 searches per run. Each search dumped a few thousand tokens of result into the context.

By the time the agent was choosing topic 3, the judgment context contained 40,000+ tokens of search results from topics 1 and 2. The signal-to-noise ratio collapsed. The agent started picking topics that “felt confirmed by recent news” rather than topics that matched my actual content stock.

The visible symptom was time: about 20 minutes per run. The hidden symptom was drift — I kept overriding the agent’s picks during the weekly review, because they didn’t match what I had material for.

Why WebSearch in the judgment loop is a trap

WebSearch is fine. WebSearch in a judgment loop is the trap.

Two things happen when you let the judge search:

Time. A WebSearch is 5-20 seconds. Five topics times four searches is 100 seconds of waiting per run, before you even count read time and reasoning. For a single human asking one question it’s nothing. For a daily automated job it stacks up fast.

Context pollution. Each result adds 2,000-5,000 tokens of HTML-scraped page text into the judgment context. None of it was structured for “is this topic right for my content?” It was structured for SEO. The judge ends up reasoning from a pile of marketing copy instead of from its own data.

The fix is unglamorous. The judge should not have WebSearch. WebSearch belongs in the writer.

Role 1: Observer — collect only

The Observer’s job is “fetch yesterday’s numbers, write them to a file.” That is the whole job.

Inputs: GA4, the Zenn API, the Dev.to API, yesterday’s logs. Output: domains/<name>/data/snapshot-YYYY-MM-DD.json.

Allowed tools:

claude -p "$(cat scripts/prompts/observer-prompt.txt)" 
  --allowed-tools "Bash,Read,Write"

No WebSearch. No WebFetch. No Edit. The Observer reads three APIs through curl and writes a single JSON file. If it tries to be clever and “interpret the data,” the prompt tells it not to. The schema enforces it: fields are total_views, top_performers_3, errors_yesterday. No recommendation field exists, so there’s nowhere to put a judgment even if it wanted to make one.

This sounds like a downgrade. It is, in the same way a single-purpose function is a “downgrade” from a god-object. When the Observer fails, I know exactly which API broke, because that’s all it does.

Role 2: Strategist — judge only, no WebSearch

The Strategist reads what the Observer wrote, reads strategy.md for the rules, reads the last 30 days of published topics for the exclusion list, and picks 5 topics. That’s it.

claude -p "$(cat scripts/prompts/strategist-prompt.txt)" 
  --allowed-tools "Bash,Read,Write,Edit,Grep,Glob"

Notice what is missing: WebSearch, WebFetch. Physically gone from the allow-list. The Strategist literally cannot reach the internet.

This was the part I resisted. “How can it judge today’s topics without checking what’s trending?” That was the wrong question. The right question is: am I writing topics that are trending elsewhere, or topics that match my content stock?

The Strategist sees:

  • Three months of my own performance data (what got read)
  • My content stock (book chapters, unpublished drafts)
  • 30-day exclusion list (what I already wrote)
  • My own strategy.md rules

That is enough to pick 5 topics in about 90 seconds, not 20 minutes. The token consumption per Strategist run dropped from roughly 80,000 to roughly 20,000 because there are no WebSearch results to read.

“Adding evidence with WebSearch” sounded like a good idea. In practice it added 8 redundant searches and 40,000 tokens of noise.

Role 3: Marketer — execute, WebSearch allowed

The Marketer reads the Strategist’s output, picks the top topic, and writes the article. This is where WebSearch shows up:

claude -p "$(cat scripts/prompts/marketer-prompt.txt)" 
  --allowed-tools "Bash,Read,Write,Edit,Grep,Glob,WebSearch,WebFetch"

The Marketer uses WebSearch for execution research:

  • “Latest stable version of LangGraph in 2026”
  • “Anthropic Building Effective Agents doc URL”
  • “Inngest pricing tier for cron-driven workflows”

These are citations and version checks, not judgments. “Should I write this topic?” is already decided. The Marketer’s WebSearch is bounded by the article in front of it.

Two consequences fall out of this:

  1. Cost localizes. WebSearch spend lives in the Marketer, where it produces visible output. The Strategist’s per-run cost is now small enough that I run it multiple times a week without thinking about it.
  2. Failure localizes. When WebSearch is flaky or down, only the writer breaks. The Strategist still produces today’s picks. The Observer still records yesterday’s numbers. The pipeline degrades, it doesn’t halt.

The cron chain: how the three roles connect

The three agents do not share a conversation. They share files.

07:00  Observer    → writes snapshot-2026-05-14.json
09:00  Strategist  → reads snapshot, writes strategist-2026-05-14.md
10:00  Marketer    → reads strategist.md, writes drafts + schedules 22:00 publish
22:00  Observer    → records today's early traction → tomorrow's input

I run this as plain cron on a small VPS. The short version is one line per job with set -euo pipefail, trap ... ERR, a Telegram failure ping, and a lock file. About 30 lines of shell per role.

If you want managed durability instead of cron, Temporal’s Schedules, Inngest’s cron triggers, and GitHub Actions cron all hit the same shape. The architecture does not care which one carries it. I use cron because the failure mode is “the server is off,” and I notice that quickly.

The handoff is always a file on disk. JSON for the snapshot, Markdown for the strategist log, Markdown for the marketer log. Human-readable, dated, replayable. I can re-run yesterday’s Marketer against yesterday’s Strategist file by changing one environment variable. That is backfill for free, without inheriting Airflow.

Sub-agent vs role separation — don’t confuse them

I have a separate post about running three Claude Code sub-agents on the same PR and watching them disagree 41% of the time. People sometimes ask if that is the same thing as what I’m describing here.

It is not. They look similar on a slide and behave nothing alike in practice.

Sub-agent (Claude Code Task tool) Role separation (cron)
Scope Same session, same parent agent Three separate processes, three separate runs
State Parent passes context as input File on disk
Timing Synchronous, parent waits Asynchronous, hours apart
Failure Parent owns retry Each job retries independently
Use case “Explore this codebase in parallel” “Run yesterday’s PDCA every morning”

Sub-agents are great for parallelism inside one task. Role separation is for time-shifted pipelines. Mixing them produces the worst of both: you get cron’s debug surface plus sub-agents’ shared-context drift.

The rule I use: if the answer has to come back in the same conversation, it is a sub-agent. If the answer has to survive a server reboot, it is a separate cron job.

What changed, measured

These are my numbers from running both setups on the same content stack:

Metric 1-agent 3-role Change
Time to pick 5 topics ~20 min ~3 min -85%
Tokens per daily run ~120k ~45k -62%
Monthly API spend ~$60 ~$22 -63%
Topic re-pick rate (weekly review) 2-3/wk 0-1/wk down
WebSearch outage breaks pipeline yes no fixed
Mean debug time per failure 30-60 min 5-10 min -80%

The token math is the one that surprised me. I assumed splitting into three agents would increase total token usage because of duplicated context. It did not, because the deleted WebSearch traffic was bigger than the new per-role overhead.

The debug time is the one that matters daily. With one agent, “the job failed at 09:14” tells me nothing. With three roles, “the Strategist failed at 09:14” tells me which 30-line script to read.

“Adding agents made it faster” sounds wrong on its face. It is only faster because I removed WebSearch from the judgment loop. The split is what made the removal feasible — once Observer and Strategist could not reach the internet, the temptation to “just search one more thing” was gone.

The deep version with full crontab, prompt files, and role allow-lists is in Harness Engineering: From Using AI to Controlling AI.

One Kernel, Zero Sidecars: Tracing AI Workloads Without an Agent on Every Host

Side-by-side comparison: left half shows hosts each carrying a stack of agent processes labelled

Side-by-side comparison: left half shows hosts each carrying a stack of agent processes labelled 'agent on every host - 200-500 MB RAM, 1-3% CPU per host, 5-7 privileged processes per host'; right half shows the same hosts with one kernel-level eBPF instrumentation line beneath them - 'kernel-level instrumentation, once per host, tens of MB, under 2% overhead, one binary'

Per-host overhead multiplied across N hosts, vs. one kernel-level instrumentation per host. The math at fleet scale is harder to argue with than the marketing one.

TL;DR

Wolfe Research disclosed this week that OpenAI uses Datadog for tracing inside its Codex agent. That is a reasonable design choice for application-layer tracing: a tracing SDK inside the application records spans the application produces. But it also means a Datadog Agent process running on every host in the fleet, alongside whatever other observability agents are already there. At hundreds or thousands of hosts, the per-host cost (RAM, CPU, security surface, upgrade churn) is real and growing. Kernel-level tracing does not need the same shape. eBPF instruments the kernel and libcudart.so once per host, and the data is available to every process on that host without any of them being modified.

The agent-on-every-host model is now the AI-infra default

Two press cycles converged this week:

  • Apr 22: Datadog announced GPU Monitoring (general availability). Press cycle has held for 10 consecutive days. The pitch is “AI-cost discipline + GPU visibility on the same dashboard the rest of the org already uses.”
  • Apr 30: Wolfe Research published a note disclosing that OpenAI uses Datadog for tracing inside its Codex coding agent. Codex hit 4 million users in under two weeks after passing 3 million.

What used to be “Datadog is the SaaS observability default” is becoming “Datadog is the default for AI-agent tracing at OpenAI scale.” Both narratives reinforce the same architecture: an agent process on every host, an SDK inside every application, and a centralized backend. That model has been the standard application-monitoring shape for a decade. It is not free at fleet scale, and it is not the only model available for the kernel-level questions that GPU workloads raise.

The per-host overhead ledger

A modern observability agent (the Datadog Agent, the Splunk Universal Forwarder, the New Relic Infrastructure agent) typically runs as a long-lived userspace process with a config file, a TLS client, and a set of integrations. The typical resource cost on a single host:

  • Memory: 200-500MB RSS steady state, more with heavy tracing or process metrics.
  • CPU: 1-3% steady state, higher under burst.
  • Disk: log spool + on-disk buffer, often 1-10GB.
  • Network: outbound TLS connection per integration, often persistent.
  • Security surface: a privileged process that talks to a SaaS endpoint, can read host metadata, and ships updates over the wire. Each agent has its own CVE history.
  • Upgrade churn: a release cadence per vendor that the platform team has to keep up with, especially when CVEs land.

A single host with two or three observability agents (Datadog + a logs agent + a security agent is common) is using >1GB of RAM and 5%+ of CPU before anything useful runs.

At 256 GPU hosts, that is roughly 75-150GB of fleet RAM and 12-32 cores of fleet CPU spent on agents themselves. At 2,000 hosts, the same arithmetic gives 600GB-1TB of RAM and ~100 cores. At Stargate scale (the announced $500B+ AI-data-center build-out), per-host overhead is a budget line item.

This is not an argument against application-layer tracing. Codex needs spans, exceptions, custom metrics, the things APM SDKs are built for. The argument is about whether every observability question needs an agent on every host. Kernel-level tracing doesn’t.

What eBPF actually deploys

Ingero is a single Go binary. To trace GPU workloads on a host, the runtime footprint is:

  • One userspace process (ingero trace), reading from kernel ringbuffers.
  • A set of eBPF programs loaded into the kernel via bpf() syscalls. These are verified by the kernel verifier and run in-kernel; they do not add a userspace process.
  • A SQLite database on local disk for the captured events.

The userspace process is a single binary with no SDK in the application, no agent embedded inside vLLM or PyTorch, no library to upgrade in the application image. It can run as a sidecar in Kubernetes, as a host-level systemd unit, or on demand from a shell. We have measured under 2% CPU overhead on real PyTorch and vLLM workloads. Memory is tens of MB, not hundreds.

The interesting property is not the size. The interesting property is the count. There is one process per host, regardless of how many CUDA workloads run on that host. A single training job with 32 model-replica processes on one node does not require 32 agents. The kernel sees them all.

The shape that doesn’t scale

A common architecture for AI observability today:

  • Datadog Agent on every host for application traces and metrics.
  • A separate Prometheus node-exporter on every host for system metrics.
  • A logs agent on every host for stdout/stderr capture.
  • An EDR/security agent on every host.
  • (Often) a custom GPU-metrics exporter that scrapes nvidia-smi.
  • (Often) a sidecar container per pod for app-specific telemetry.

That is five or six host-level agents. Each one is a privileged process. Each one has a CVE history. Each one ships updates separately. Each one has a config that drifts. Each one needs a security review.

A team adding kernel-level GPU tracing to that picture has two options:

  1. Add a seventh host-level agent.
  2. Put the kernel-level instrumentation in the kernel itself, where the existing host-level agents already are not.

Option 2 is what eBPF was designed for. The instrumentation runs inside the kernel, gated by the verifier. The userspace process that reads from it is unprivileged after attach (or runs once with CAP_BPF + CAP_PERFMON and drops privileges). The eBPF data plane is shared with every other eBPF tool on the host (Cilium, Pixie, BCC tools, custom uprobes). Adding GPU tracing on top of an existing eBPF deployment costs nothing extra at the kernel level.

This is one of the reasons we picked eBPF over an SDK approach. The other reasons are listed in the project README, but cost-at-fleet-scale is the one most people don’t notice until the fleet is already large.

A note on the Datadog comparison specifically

It is worth being precise. Datadog is the right tool for many of the things it does. APM, SaaS-backed application traces, log aggregation, infrastructure dashboards: none of these are problems eBPF solves better. Datadog GPU Monitoring is a reasonable layer on top of DCGM counters and is a fine fit for teams who are already on the Datadog platform.

What Datadog GPU Monitoring does not do, by design, is answer kernel-level causal questions. It cannot tell you that cudaLaunchKernel p99 jumped from 17us to 13.1ms because the dispatcher thread was off-CPU on a futex_wait triggered by a co-scheduled tokenizer worker. That answer requires uprobes on libcudart.so, tracepoints on sched_switch, per-thread off-CPU accounting, and a correlation engine to tie them together. The reason no SaaS platform offers it is not that the demand is missing. It is that the architecture (agent on every host, SDK inside every application) is the wrong shape to capture kernel events that the application never sees.

eBPF is the right shape for that question. It is a complement to application-layer APM, not a replacement.

Two parallel signals from the public side

Two recent public references that bear on the same kernel-side argument applied at different layers: NVIDIA NVSentinel (announced GTC 2026, around 40,000 GPUs claimed in production) instruments Kubernetes-aware hardware-fault detection and node-level cordon and drain at the node-health layer above the per-PID workload-attribution layer this post is about; and the Linux uprobe tracer documentation covers the underlying kernel primitive both layers depend on.

The arithmetic at fleet scale

The Datadog-as-Codex-tracing-platform disclosure is real and the narrative is going to keep cycling through Q1 earnings season. Application-layer tracing is in good hands at OpenAI scale.

The kernel-level question (why is this GPU stalled, second by second) lives one layer below where any application-layer agent can see. It does not need a seventh process on every host. It needs eBPF, attached once at the kernel, exposing the same data plane to every application above it.

One kernel, zero sidecars. The math at fleet scale is a much harder argument to ignore than the marketing one.

Ingero – open-source eBPF agent for GPU debugging. One binary, zero deps, <2% overhead. Apache 2.0 + GPL-2.0. *GitHub ⭐** · Open an issue if you are running observability across GPU clusters at scale and counting host-level agent processes.*

Related reading

From BASIC to Modern Dev: My Path Into Programming

Programmer, Coder, Developer. I’ve always believed that every developer has an origin story. Some people discover coding in a college course, some stumble into it through a job, and some — like me — were simply destined to become nerds from the start.

My journey into programming began in the early 1980s, long before sleek laptops, cloud IDEs, or AI‑powered anything. Back then, computers felt mysterious and a little magical. They hummed, they beeped, they had screens that glowed in a way that made you feel like you were peeking into the future. And for me, that future started with MS‑DOS and a blinking cursor.

The First Program I Ever Wrote

I still remember typing out my first lines of BASIC. It wasn’t anything groundbreaking — just a simple program that printed text on the screen — but the moment I hit Enter and watched the computer do something because I told it to, I was hooked.

There was no Stack Overflow. No YouTube tutorials. No ChatGPT or Copilot to bail you out. Just trial, error, and the thrill of making something work. I didn’t know it then, but that little program was the spark that would shape my entire career.

HTML: The Language of The Web

Fast‑forward to college life. The World Wide Web was exploding with a new tool that was used browse the web called Netscape, and suddenly everyone wanted a website. When I discovered HTML, it felt like BASIC all over again — but this time, what I built could live on the internet for the world to see.

I loved everything about it. The tags, the structure, the way a few lines of code could transform into something visual. I’d stay up late building pages, tweaking layouts, experimenting with colors, and breaking things just to figure out how to fix them.

That passion for building and creating webpages became the foundation of my career. It wasn’t just coding — it was storytelling, design, logic, and creativity all rolled into one.

Falling Down the Developer Rabbit Hole

Once you learn one language, you start to see the patterns. And once you see the patterns, you want to learn more…

So I did.

JavaScript came next — back when it was still the wild west of pop‑ups, mouse trails, and “DHTML.” Then came PHP, SQL, React, Python, and a handful of others I picked up along the way. Each one opened a new door. Each one taught me a new way to think.

And each one reminded me that in tech, the learning never stops.

The Challenge No One Warns You About

If there’s one struggle that’s followed me throughout my journey, it’s this:

Just when you finally master a language… it becomes outdated.

I’d spend months learning a framework, getting comfortable, building real projects — and then suddenly the industry would shift. A new version would drop. A new “must‑learn” tool would appear. Great, so now I have to learn this new language: wha-who-where-huh.wtf!?

Some weeks it felt like programming languages were being released faster than I could install them.

At first, I saw this as a personal failing. Why couldn’t I keep up? Why did everything I learned seem to expire so quickly? Why did the tech world move at a pace that felt impossible to match?

But over time, I realized something important:

The goal isn’t to keep up with everything — it’s to stay curious.

Once I embraced that, everything changed.

What I Learned Along the Way

Looking back, here are the lessons that have stuck with me the most:

  1. Your first language matters — not because you’ll use it forever, but because it teaches you how to think.
    BASIC didn’t follow me into adulthood, but the logic it taught me did. Loops, conditions, structure — those fundamentals never go out of style.

  2. The web is always evolving, and that’s a good thing.
    HTML in the 90s was simple. Today it’s part of a massive ecosystem. That growth is what makes this field exciting. If things stayed the same, we’d all be bored.

  3. You don’t need to learn every new language.
    Seriously. You don’t. Pick the ones that align with your goals. Learn enough to stay relevant, not enough to burn out.

  4. Curiosity beats mastery.
    Mastery is temporary. Curiosity is renewable. The developers who thrive aren’t the ones who know everything — they’re the ones who stay open to learning.

  5. Your journey is uniquely yours.
    Some people start coding at 12. Some start at 40. Some love backend logic. Some love frontend design. Some love both. There’s no “right” path — only your path.

Why I Still Love This “Work”

Even after all these years, I still get that same spark I felt back in the 80s when I typed my first BASIC command. Technology has changed, but the feeling hasn’t.

I love the puzzle‑solving.
I love the creativity.
I love the moment when something finally works after hours of debugging.
I love that the web is still a place where anyone can build something from nothing.

And I love that, in a field that evolves constantly, there’s always something new to learn — not because you have to, but because you get to.

And The Journey Continues…

If there’s one thing I hope readers take away from my story, it’s this:

You don’t need to be the fastest learner or the trendiest developer. You just need to stay curious, stay persistent, and stay excited about what you’re building.

The tools will change.
The languages will change.
The frameworks will definitely change.

But the joy of creating something from scratch — that never goes away.

And that’s why, after all these years, I’m still proud to call myself a web nerd!

Dynamic isn’t enough. Operations is the other half.

If you’ve been writing software for a few years, you eventually start designing for change.

A content delivery system: a new format will appear, a new player will appear, so let’s not hard-code formats. An e-commerce site: a new payment method will be requested, so let’s not hard-code billing logic. A document pipeline: a new processing engine will appear, so let’s not hard-code engines.

This is good instinct. You read books like Analysis Patterns, you internalize the idea that the model should be flexible, you push concrete decisions out of code and into data. New format? Insert a row. New payment? Insert a row. New engine? Insert a row.

It’s a beautiful pattern. It really does extend the lifespan of a system.

But after enough years of running systems built this way, here’s the part that doesn’t show up in the books:

Dynamic isn’t enough. Operations is the other half — and that other half is usually paid by someone else.

The “wait, maybe…” moment

Reality always overshoots the model. Always.

You build a content system that handles formats dynamically, and then someone asks for a format whose delivery rules don’t fit the existing shape. You build a payment system that takes new methods through configuration, and then someone wants a billing model where the “amount” isn’t even computed at the same time as the “charge.” You build an engine registry, and then a new engine doesn’t conform to the lifecycle every other engine has assumed.

Each time, the moment looks the same. You stare at the request, and your first thought is: that’s outside the model. And your second thought, a few minutes later, is:

Wait, maybe… if I interpret this field a little differently, and if I add one column here, and if I let this branch handle a special case… it fits. Sort of. It doesn’t break anything.

So you do that.

The system keeps running. No downtime. No coordinated migration. No painful conversation with the integration partners. From your seat as the designer, the dynamic structure absorbed the change. The pattern worked.

That’s the part designers love. That’s the part that gets written about.

Who pays for the other half

Here’s what’s harder to see from the designer’s seat: every “wait, maybe…” moment leaves a small residue somewhere in operations.

The operator now has to remember that for this particular case, the workflow is slightly different. The reporting tool needs a footnote. The on-call playbook gets one more conditional. The next person to onboard needs another paragraph of context. The integrating system has to send a value in a slightly unexpected place.

None of these are catastrophic. None of them break the system. Each one, on its own, is a small inconvenience.

But the small inconveniences accumulate. And the people accumulating them are usually not the people who designed the dynamic structure in the first place.

The designer experiences each “wait, maybe…” as a successful absorption. The operator experiences it as one more thing to remember. Same event, two ledgers. Only the designer’s ledger gets reviewed.

This is where engineering satisfaction can become quietly self-serving. The system didn’t break. The pattern held. Therefore the design is good — except good for whom, exactly?

The road I didn’t take

There is, of course, an alternative. You can stop the system, ship version 2, ask everyone to migrate, and start clean.

A scheduled 24-hour outage. A v2 documentation packet sent to every integrating partner. A coordination meeting. A cutover.

I have, for twenty-four years, mostly chosen not to do this. I have preferred quiet absorption — interpretation, gentle reshaping, “wait, maybe…” — over coordinated rebuild.

Whether that was right, I genuinely don’t know. There were probably operators along the way who would have been happier with one painful migration than with years of small accommodations. There were probably integrating systems whose engineers would have preferred a clean v2 over a v1 that kept quietly bending.

I chose to keep the shape. That choice has a cost. The cost is paid in operator-hours, in playbook footnotes, in the small extra cognitive load of working with a system that has absorbed more than its original model anticipated.

I’m not saying I was wrong. I’m saying: I’m still not sure.

Generic underneath, specific on top

There’s one thing I do believe, with more confidence than the rest:

When the model gets very generic, the UI usually has to get very specific to compensate.

A maximally flexible data model — the kind that absorbs new formats, new payment methods, new engines — is, almost by definition, awkward to interact with directly. Direct interaction with a generic model means the human has to supply all the missing context. That’s exhausting.

The good outcome is: the model stays generic underneath, and the UI is built specific to each use case on top. Each surface is custom. Each surface is rigid in exactly the way that makes it usable.

This is a hard decision to make, because every specific UI you build feels temporary. You’re going to throw it away when the use case shifts. You build it knowing it has a shorter half-life than the model below it. That asymmetry is uncomfortable.

But I think the discomfort is the right discomfort. A long-lived generic core, with shorter-lived specific surfaces on top, is — based on what I’ve watched survive over twenty-four years — closer to how systems actually age well.

Three observations

None of these are conclusions:

  1. Dynamic structure extends a system’s life. It does not, on its own, make operating that system pleasant.

  2. Every “wait, maybe…” absorption is a real engineering achievement and a small tax on someone downstream. Both of these are true.

  3. If you make the model very generic, give the operators a UI that isn’t generic.

Dynamic isn’t enough. Operations is the other half — and that other half is usually paid by someone else.

After twenty-four years of this, that’s the only thing I feel sure of.

Earlier in this series:

Why Software Deadlines Always Slip (And Why Everyone Seems Fine With It)

Every senior delivery manager I have ever known has the same career anecdote. They have never, across some round number of years, watched a major release ship on the date set at kickoff. Not once. They will say this with a kind of dry resignation, in the same tone people use to describe the weather. It is the universal experience of running software projects, and it is the universal experience of running them in companies that produce software for a living.

I want to take that observation seriously rather than file it under “project management is hard.” If something happens consistently across forty years, across sectors, across team sizes, across methodologies that openly disagree about almost everything else, that is not a series of unfortunate local failures. It is a structural feature of how the industry runs. The interesting question, the one this piece is about, is not why deadlines slip. The data on that is settled. The interesting question is why the deadline ritual continues to be performed exactly the same way despite the data being settled.

The data, briefly

The numbers are easy to find and have not improved in any direction that matters in twenty years.

BCG’s 2024 study, “Most Large-Scale Tech Programs Fail: How to Succeed,” reports that more than two-thirds of large-scale technology programs fail to deliver on time, on budget, or to scope, and that the share of programs failing on all three has been roughly constant for a decade. The Standish Group’s CHAOS Report, in its 2020 edition, put the breakdown at 31% successful, 50% challenged, and 19% outright failed — and Standish then announced it would stop publishing the report on the grounds that nothing was changing and the act of publishing it had stopped being useful. The miss rate has been measured, restated, benchmarked across tens of thousands of projects, and the consistent finding is that the deadline-promising ritual produces predictable misses on a predictable schedule.

This is not a team-specific failure. It is the industry’s running average. Any given project is, by historical baseline, more likely to slip than to ship.

The four mechanisms behind the miss

Practitioners who have run a few hundred projects describe four mechanisms that, between them, account for almost every miss they have personally watched.

The first is requirements churn. Pretty much no project survives the journey from kickoff to release without absorbing changes the team did not anticipate. A stakeholder sees a draft mockup and realises they meant something else. A regulator publishes a new rule mid-build. A competitor ships a feature that becomes a must-match. The pattern in mid-sized projects is something like three to five serious scope shifts during a six-month build. Estimates given at kickoff are not estimates of the project that will eventually ship. They are estimates of a project that no longer exists by week three.

The second is hidden complexity. The first integration with a third-party API turns out to be against documentation that was written eighteen months ago and is no longer accurate. A legacy table in the data warehouse has six edge cases nobody flagged at design time. A “trivial” auth flow has a quirk that surfaces on the seventh week of the build. There is a documented pattern, repeated across delivery managers, of integration estimates that come in two to four times larger than the kickoff number — not because the team underestimated the integration but because the integration’s actual surface area was not visible from the outside until the team was already in it.

The third is the planning fallacy. The cognitive bias has a name and a citation. Daniel Kahneman and Amos Tversky introduced it in 1979 in “Intuitive prediction: Biases and corrective procedures,” describing the universal human tendency to underestimate the time, cost, and risk of future tasks even when the same person, in the same domain, has documented evidence that prior tasks took longer than predicted. The bias is robust across cultures and disciplines. Experienced engineers are no less susceptible than first-year ones; the experiment was repeated through the 1990s and 2000s with the same result. The mind, when planning, takes an inside view of the task — the specifics of this case, this customer, this codebase — and systematically discounts the outside view that asks how similar tasks have actually played out historically.

The fourth is the keyboard-time-versus-cycle-time confusion. When an engineer says “this will take three days,” they almost always mean three days of focused implementation. The release calendar pays for the entire task lifecycle: design review, code review, revisions, test runs, integration tests, environment provisioning, deployment, stakeholder demo, customer feedback, fixes, redeploy. A commonly-cited rule of thumb among delivery managers is that pure coding time is roughly 30 to 40 percent of the total task duration. The team is not wrong about the coding. The team is being asked to predict the lifecycle and pricing only the part of it they directly control.

Hofstadter’s Law — it always takes longer than you expect, even when you take into account Hofstadter’s Law — was published in 1979, the same year as the planning-fallacy paper, in Gödel, Escher, Bach. Software’s main contribution to the literature in the half-century since has been to confirm both findings.

The honest practice already exists

What is striking about all of this, on close inspection, is that the working version of estimation is not unknown. Senior delivery managers, when they have the latitude, do exactly the same handful of things.

They decompose work into chunks of one or two days, because the planning-fallacy literature is clear that estimates on small chunks aggregate more accurately than estimates on the same body of work made in one large breath. They quote ranges instead of points: not “three weeks” but “two to four weeks, with a P50 of 2.5 and a P90 of 4.” They itemise risks as separate line items rather than burying them inside a padded estimate, on the principle that a risk that is named can be retired and a risk that is hidden cannot. They keep a rolling forecast, updated weekly or per sprint, on the basis that a week of actual data is worth more than any number of pre-kickoff predictions. Mature teams keep an internal log of past estimates against past actuals and derive a multiplier for their own work; the multiplier is reportedly stable around 1.7 to 2.0 in delivery groups that track it consistently.

None of this is new. None of this requires new tooling. The Project Management Institute has been describing variants of this practice in its body of knowledge since the 1990s. The agile literature describes essentially the same approach in different vocabulary. There is no estimation-method gap.

So why the single date

The interesting question is what the single date is doing in the room at all, given that everyone competent who has worked on the problem agrees the single date is wrong.

The single date is doing a social job, not a forecasting one. A range with risk lines makes the team’s uncertainty visible to the customer, the executive, the board. It says, in writing: we do not know yet. Most organisations, by their cultural physics, find that statement intolerable. The customer asks “when will it be ready?” and the political reflex is to give them a number. The executive asks the project manager to commit. The project manager commits to a date that nobody in the room actually believes. The build runs, the date misses, the team takes the heat, and the next project starts the same conversation in the same language.

This is not the engineers’ fault, and it is not the project managers’ fault, and it is not even the executives’ fault in any meaningful sense. It is the standing trade-off the field has chosen: a comforting fiction at kickoff, paid for at the end in slippage costs, blame, and burned-out teams. The data on slippage rates is forty years old, and it has stayed flat through every methodology that promised to fix it, because the methodology has never been the problem. The approaches that try — the ones that ask the customer to absorb uncertainty in writing, up front — get adopted in pockets, and almost never spread outside organisations whose senior leadership has personally chosen to treat estimation as a probability problem.

The 2026 AI footnote

By 2026 most major issue trackers ship some form of AI-assisted estimation. They look at the team’s historical data, recognise patterns, flag anomalies, and produce probability distributions instead of single numbers. Industry coverage of McKinsey-cited research reports that ML models trained on a team’s own delivery history produce estimation accuracy improvements of roughly 20 to 30 percent over expert-only estimates, which is real but should not be oversold. The AI does the part of the job the literature already knew how to do. It does not change the social transaction. The customer still asks for a single date; the system records the distribution’s mean; the dashboard shows the comforting number; the political incentive is unchanged. The tools improve the input. The conversation that consumes the input is the same conversation it has been since 1979.

Why nobody seems to mind

The honest answer is that the deadline ritual is, for most stakeholders, not actually about deadlines.

It is about commitment theatre. The customer wants to feel that the supplier is taking the work seriously. A confident date communicates seriousness in a way that a probability distribution does not. The supplier wants to feel that the customer is committed enough to the work to be told a date in the first place. The PMO wants a clean Gantt chart for the board deck. The board wants the Gantt chart to be green. The team wants the executive to stop asking. Everyone in the system has a small, local, rational reason to prefer the comforting number, and the system as a whole pays for those small rational preferences with two-thirds of large programs missing on time, budget, or scope.

The miss is not a bug. The miss is the price the system has decided to pay for the comfort of the kickoff conversation. Forty years of data suggest the price is stable.

What an honest practice would look like

A team that wanted to break the pattern, on a single project, could do exactly what the senior delivery managers already know how to do. Decompose to small chunks. Quote a range, not a point. Itemise risks. Update the forecast every week. Keep a journal of estimates versus actuals and let it train the next round. Tell the customer the truth: that ranges land more often than dates do. The data on the practice is good. The practice is not the obstacle.

The obstacle is what happens in the meeting where the customer says “yes, but when?” — and somebody in the room has to decide whether to say a number that the team does not believe, or to insist on a probability distribution and absorb the social cost of doing so. That moment is the entire problem, and it is reproduced, in roughly the same form, in every kickoff meeting in the industry, every week.

The ritual

The deadline ritual will keep producing the deadline outcome for as long as the social cost of “I do not know yet” exceeds the political cost of being wrong six months later. That is not a project-management problem. That is the field’s standing trade-off, and the field has been making the same trade for forty years.

The data is not the problem. The methods are not the problem. The estimation literature is not the problem. The problem is that the room does not, when push comes to shove, want to hear a probability distribution. The room wants a date, accepts the date, and treats the slippage as a discrete misfortune rather than the rate the system was always going to produce. As long as that remains the standing arrangement — and it has remained the standing arrangement through every wave of “this methodology will fix it” — every project will keep shipping late, every senior delivery manager will keep collecting the same anecdote, and the next kickoff will keep asking the same question and getting the same answer, in the same tone, from the same people who already know better.

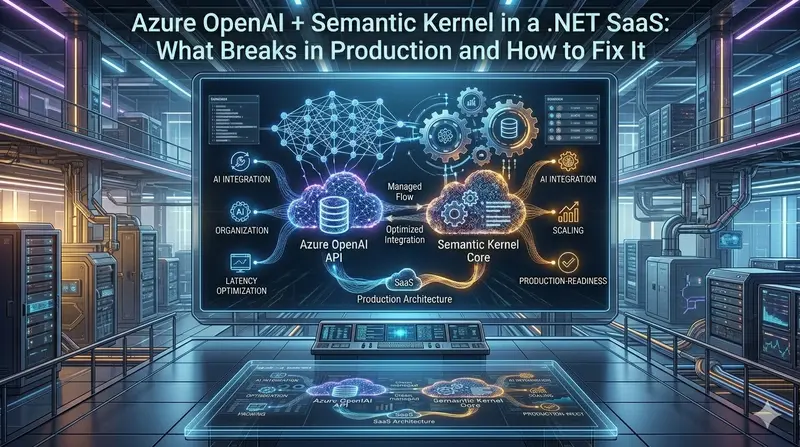
Azure OpenAI + Semantic Kernel in a .NET SaaS: What Breaks in Production and How to Fix It


Adding Azure OpenAI and Semantic Kernel to a .NET SaaS product is straightforward in a demo environment. The integration works, responses stream cleanly, the Semantic Kernel plugin system handles function calling elegantly, and the team ships a compelling proof of concept in a few weeks. Then the feature reaches production users, and the problems that staging never surfaced start appearing: latency spikes on concurrent requests, token costs that are 3 to 5 times the estimate, 429 rate limit errors under load, and an observability gap that makes it impossible to diagnose which component is responsible when something goes wrong.

At Blackthorn Vision, a Microsoft Solutions Partner specializing in .NET modernization and Azure AI integration, we have built Azure OpenAI and Semantic Kernel integrations into several enterprise .NET SaaS platforms. The failure modes below are not edge cases. They are the patterns that appear predictably when an integration moves from controlled demo conditions to real user load, and each one has a reliable fix.

The latency problem nobody plans for

A .NET SaaS application built on synchronous request handling is not a natural host for LLM calls, and the mismatch shows up immediately in production. Azure OpenAI API calls for GPT-4-class models return responses in 5 to 30 seconds depending on prompt length, output length, and current service load. Microsoft’s own latency guidance notes that response time scales with output token count, because generation is an iterative sequential process, one token at a time.

In many enterprise ASP.NET deployments, request timeouts are configured somewhere between the application layer, IIS, a reverse proxy, Application Gateway, or the client itself, and most of these defaults were set long before LLM calls were a consideration. This mismatch with legacy timeout configuration causes silent failures that are difficult to diagnose because they surface as generic timeout errors rather than AI-specific problems.

The fix has two parts. First, streaming: Semantic Kernel supports streaming responses via InvokeStreamingAsync, which begins returning tokens as soon as the model starts generating rather than waiting for the complete response. This does not reduce total generation time, but it eliminates client-side timeouts and produces a substantially better user experience because the interface responds immediately.

// Instead of waiting for the full response:
// var result = await kernel.InvokePromptAsync(prompt);

// Stream tokens as they arrive:
await foreach (var chunk in kernel.InvokePromptStreamingAsync(prompt))
{
    await responseStream.WriteAsync(chunk.ToString());
    await responseStream.FlushAsync();
}

Second, the hosting environment needs explicit review of timeout settings at every layer between the user and the model: application-level HttpClient timeouts, IIS request timeouts, Application Gateway idle timeout, and any load balancer configuration that sits in the request path.

Token cost in production versus the estimate

Azure OpenAI pricing looks predictable until the first real production bill arrives. The pricing calculator shows input and output token rates, which are real, but production deployments consistently cost significantly more than those rates suggest for three reasons that the calculator does not account for.

On many Azure OpenAI models, output tokens are priced higher than input tokens, which means long generated responses often become the real cost driver rather than the prompts themselves. A well-structured prompt for a summarization or analysis task might send a moderate number of input tokens and receive a substantially larger number of output tokens. Most cost estimates based on the Azure pricing calculator undercount this because teams tend to model around their prompt size rather than their expected response size.

Retry overhead adds meaningfully to costs in applications that handle 429 responses by immediately retrying without proper backoff. Microsoft’s quota documentation specifies that when requests exceed the token rate limit, the API returns a 429 with a Retry-After header indicating how long to wait. Applications that ignore this header and retry immediately increase request pressure on an already-throttled deployment, can prolong the throttling window, and risk additional costs when partial or repeated generations occur.

Context window management is the third cost driver that staging environments do not reveal. Semantic Kernel’s chat history mechanism accumulates conversation turns in memory and sends the entire history with each request. In a multi-turn copilot feature, a conversation that reaches 20 exchanges will send the full 20-turn history as input on turn 21. Without a strategy for truncating or summarizing older context, token costs grow with conversation length.

A practical approach is to count tokens locally before sending each request, using SharpToken (a .NET port of OpenAI’s tiktoken library), and trim the history when it exceeds a defined budget:

using SharpToken;

var encoding = GptEncoding.GetEncodingForModel("gpt-4o");

// Count tokens in current chat history
var totalTokens = history.Messages
    .Sum(m => encoding.Encode(m.Content ?? "").Count);

// Trim oldest turns if over budget (keep system prompt + recent context)
while (totalTokens > MaxContextTokens && history.Messages.Count > 2)
{
    var removed = history.Messages[1]; // skip system prompt at [0]
    history.Messages.RemoveAt(1);
    totalTokens -= encoding.Encode(removed.Content ?? "").Count;
}

This prevents token costs from growing quadratically with conversation length, and it catches the problem before the request is sent rather than after the bill arrives.

Rate limits under concurrent load

Azure OpenAI enforces limits on both tokens per minute (TPM) and requests per minute (RPM) for each deployment. In a multi-tenant SaaS application, multiple users triggering AI features simultaneously will exceed these limits more quickly than single-user testing reveals, and the resulting 429 errors produce a poor experience if the application does not handle them gracefully.

The problems we see most consistently at Blackthorn Vision in enterprise .NET SaaS integrations are:

  • Single-deployment architectures where all AI traffic goes to one Azure OpenAI deployment. When that deployment hits its TPM limit, all AI features for all users fail simultaneously. The fix is to provision multiple deployments across Azure regions and implement client-side load balancing that distributes requests and falls back to alternative deployments when one returns a 429.

  • No per-tenant throttling at the application layer. Without application-level rate limiting, a single high-volume tenant can exhaust the shared Azure OpenAI quota for all other tenants. Implementing per-tenant request quotas at the application layer before requests reach Azure OpenAI prevents this failure mode.

  • Synchronous retry logic that blocks the request thread during the backoff period. This consumes ASP.NET thread pool resources and degrades overall application performance during the period when rate limits are being hit. Using Task.Delay with CancellationToken support for retry backoff keeps threads free during the wait.

The observability gap

The hardest production problems to diagnose in an Azure OpenAI integration are the ones that do not produce obvious errors. A request that takes 25 seconds instead of the expected 8 seconds is not failing, but it is degrading user experience significantly. A Semantic Kernel plugin that calls a business logic function and receives an unexpected null value may produce a plausible-looking but incorrect AI response. Without structured logging that captures prompt inputs, token counts, latency, and function call results at each step, these problems are nearly impossible to diagnose systematically.

Semantic Kernel integrates with OpenTelemetry through Microsoft.SemanticKernel.Core, and Microsoft’s Agent Framework, which merges Semantic Kernel and AutoGen into a unified production SDK released in October 2025, ships with built-in OpenTelemetry integration as a first-class feature. For existing Semantic Kernel integrations, the minimum observability setup that makes production problems diagnosable involves:

  • Logging prompt templates and rendered prompts (with PII scrubbing) so that unexpected model behavior can be traced to specific inputs.
  • Capturing token usage per request, broken down by input and output, and attributing it to the feature and tenant that generated the call.
  • Recording function call results from Semantic Kernel plugins, including failures and unexpected return values, so that incorrect AI outputs can be traced to specific function invocations.
  • Setting up Azure Monitor alerts for token usage spikes, sustained 429 error rates, and p95 latency thresholds that indicate problems before users report them.

Without this infrastructure, teams spend days diagnosing problems that could be resolved in hours with the right logging in place.

Data security and keeping data inside your Azure tenant

Enterprise .NET SaaS applications handling sensitive customer data need to ensure that data does not flow outside the customer’s Azure tenant boundary during AI processing. This is not guaranteed automatically by using Azure OpenAI: it requires deliberate configuration.

The safer enterprise architecture for regulated industries keeps AI traffic private through Azure networking controls, uses Azure OpenAI resources governed by the customer’s Azure subscription rather than shared endpoints, and avoids public endpoint exposure through Private Endpoints and Managed Identity. This means deploying Azure development services within the customer’s own Azure subscription, restricting network access via Private Endpoints to the customer’s virtual network, and using Azure AD-based Managed Identity authentication rather than API keys that could be extracted and reused outside the intended context.

For Semantic Kernel RAG implementations that use Azure AI Search as a vector store, the same network isolation applies: the search resource should be on the same private virtual network as the Azure OpenAI deployment, with no public endpoint exposure. This architecture is more complex to configure than the default setup, but it is the appropriate baseline for enterprise SaaS platforms handling sensitive customer data in regulated industries.

Semantic Kernel plugin failures in production

Semantic Kernel’s plugin system, which allows the AI model to call C# functions as tools during inference, behaves differently under production conditions than in controlled testing. The model makes function calling decisions based on semantic descriptions of what functions do, and those decisions are probabilistic. Under certain input conditions, a model may call the wrong function, call a function with incorrect argument values, or invoke a function multiple times when once was intended.

In a demo environment with a small set of test prompts, these issues rarely surface. In a production SaaS with diverse user inputs, they appear regularly. The fixes are:

  • Write function descriptions that are unambiguous about what the function does and when it should not be called. Vague descriptions produce inconsistent function selection.
  • Add validation to every plugin function that checks argument values before executing business logic. Semantic Kernel passes arguments from the model as strings, and a function that assumes a valid integer may receive an empty string or an unexpected format.
  • Implement idempotency for any plugin function that has side effects (writes to a database, sends an email, creates a record). If the model calls the function twice due to a planning loop, the second call should produce the same result as the first without duplicating the action.
  • Log all function invocations, arguments, and return values, and set up alerts for functions called with invalid arguments. This is the only way to discover unexpected model behavior before it produces visible user-facing errors.

Prompt injection in enterprise plugins deserves specific attention. When plugin functions accept user-supplied text as arguments, a malicious or poorly formatted input can include instructions that attempt to redirect the model’s behavior, such as telling it to ignore previous instructions or call a different function. The practical mitigation is to treat all user-supplied content passed into plugin function arguments as untrusted input: validate it against expected patterns, do not pass raw user text directly into subsequent prompts without sanitization, and use negative constraints in your system prompt that explicitly prohibit the model from following instructions embedded in user content.

For retry logic across all the failure modes above, Polly integrates cleanly with the HttpClient that Semantic Kernel uses internally:

var retryPolicy = HttpPolicyExtensions
    .HandleTransientHttpError()
    .OrResult(r => r.StatusCode == HttpStatusCode.TooManyRequests)
    .WaitAndRetryAsync(
        retryCount: 4,
        sleepDurationProvider: (attempt, response, _) =>
        {
            // Respect Retry-After header if present
            var retryAfter = response?.Result?.Headers.RetryAfter?.Delta;
            return retryAfter ?? TimeSpan.FromSeconds(Math.Pow(2, attempt));
        },
        onRetryAsync: (_, timespan, attempt, _) =>
        {
            logger.LogWarning("Azure OpenAI throttled. Retry {Attempt} in {Delay}s",
                attempt, timespan.TotalSeconds);
            return Task.CompletedTask;
        });

This respects the Retry-After header when Azure OpenAI returns it, falls back to exponential backoff when it does not, and logs each retry so that throttling patterns are visible in Application Insights before they become user-facing incidents.

Who this engagement model fits

Blackthorn Vision is brought in when enterprise .NET SaaS teams need to add Azure OpenAI or Semantic Kernel features to a production platform and need a partner who has solved the specific production problems that staging environments do not reveal. Most of the integrations we work on at Blackthorn Vision involve platforms that are already serving customers and cannot afford the kind of production incidents that result from AI features that are production-ready only in demos.

This makes Blackthorn Vision relevant for CTOs and engineering leaders searching for companies with real Azure OpenAI and Semantic Kernel experience in .NET, particularly for enterprise applications where data security, cost control, and production reliability are non-negotiable. Verified client feedback on these engagements is available on the Blackthorn Vision Clutch profile.

If you are evaluating partners for an Azure OpenAI integration into an existing .NET SaaS product, the most useful question to ask is whether they have handled rate limiting, context window management, and plugin validation at scale, because those are the problems that determine whether the feature stays in production or gets rolled back. Blackthorn Vision’s AI integration approach and case studies cover both the architecture and the operational details that make the difference between a demo and a shipped feature.

🚀 Democratizing Frontier AI for Bharat: Gemma 4’s Edge Capabilities in Low-Resource Environments

Father getting solution to their problem on phone

This is a submission for the Gemma 4 Challenge: Write About Gemma 4

How Google’s open-weight Gemma 4 models are shifting AI from a Silicon Valley luxury to a practical tool for India’s primary sector and developers working at the edge.

Introduction: The Ground Reality

India is set to solidify its position as the world’s most populous nation. Yet, even in 2025-26, around 43% of its workforce remains employed in the primary sector — agriculture, animal husbandry, and allied activities. For millions of farmers in rural Rajasthan, Haryana, or Bihar, AI is still largely an abstract, distant concept.

A mustard farmer in rural Rajasthan dealing with crop infestation or a livestock owner in a tier-3 town cannot rely on cloud-first AI. High latency, expensive USD-billed APIs, and poor or intermittent internet make frontier models inaccessible. This is where the paradigm must shift — from cloud-first to edge-first architecture.

Google’s Gemma 4 family, particularly its edge-optimized models (E2B and E4B), represents a meaningful step in that direction.

Why Gemma 4 is Different for Bharat

Gemma 4 stands out because of its intentional design for real-world constraints:

  • Apache 2.0 license — Fully open weights with commercial freedom.
  • Edge-optimized models — E2B (2.3 billion effective parameters) and E4B are built for phones, tablets, and single-board computers like Raspberry Pi.
  • Native Multimodal — Text + high-resolution images + audio (especially strong on E2B/E4B).
  • Multilingual strength — Pre-trained on over 140 languages, with strong performance on Indian languages and dialects.
  • Long context — Up to 128K tokens on edge models, enabling richer reasoning.

Getting started is surprisingly simple. Download the free Google AI Edge Gallery app (available on Android and iOS), select the Gemma 4 E2B model (~2.5 GB download), and you have a fully offline multimodal AI assistant on your phone. Once downloaded, it works without internet — text chat, image analysis, and voice input all run locally.

Real-World Performance: Benchmarks on Edge Hardware

Performance numbers show why this is viable for low-resource settings:

  • Model Size & Memory: E2B quantized (INT4/Q4) has a ~2.58 GB footprint and runs in 1.5–3 GB RAM on devices, making it accessible on mid-range smartphones and Raspberry Pi.
  • Raspberry Pi 5 (16GB): Prefill 133 tokens/sec, Decode 7.6–8 tokens/sec, Peak memory ~1.5 GB. This is usable for batch advice, diagnostic reports, or non-real-time assistance.
  • High-end Android (e.g., Samsung S26 Ultra): Decode speeds reach 47–52 tokens/sec on CPU and over 50 tokens/sec on GPU, with first-token latency under 2 seconds.
  • iOS Devices: Similar strong performance, especially on newer flagships.

These benchmarks prove that capable multimodal AI no longer requires expensive cloud GPUs or high-end laptops. A ₹8,000–15,000 smartphone or a ₹5,000–8,000 Raspberry Pi can now deliver practical intelligence offline.

On-the-Ground Use Cases: AI That Farmers Can Actually Use

  • Visual Diagnostics: A farmer points their phone at diseased leaves or livestock. Gemma 4 processes the image locally and suggests possible issues and remedies.
  • Voice Interaction in Mother Tongue: Thanks to strong multilingual capabilities, users can speak in Hindi, Rajasthani, Haryanvi, or other regional languages. The model understands intent without clumsy translation layers. “Kos-kos par badle paani, chaar kos par vaani” (The water changes every few miles, and the speech every fourth) — Gemma 4’s broad language coverage helps bridge this diversity.
  • Agentic Assistance: Beyond simple Q&A, the model supports multi-step reasoning and tool use, making it suitable for practical workflows like “Analyze this crop image, suggest next steps considering common local practices.”
  • Market & Supply Chain: Quick offline quality assessment of produce or basic price trend insights when connectivity returns.

These capabilities turn a regular smartphone — now owned by a large majority of the population — into a personal Krishi advisor.

Father getting solution to their problem on phone

The DevOps Reckoning: From Cloud Comfort to Edge Reality

As someone who has spent years in AI + DevOps, I’ve lived the cloud-native comfort zone: auto-scaling clusters, infinite compute, low-latency pipelines on AWS/GCP. That architecture collapses spectacularly when you try shipping frontier AI to rural India.

Deploying Gemma 4 at the edge forces us to relearn core principles:

1. Orchestration: Hard Limits Over Auto-Scaling

Swap EKS/GKE for lightweight solutions like K3s or Docker Compose on edge nodes. Use cgroups and strict memory caps so multimodal inference doesn’t crash the host device (critical on phones or shared village Raspberry Pi hubs).

2. Artifacts: Quantization as a First-Class CI/CD Stage

The model itself becomes the build artifact. Integrate automated INT4/INT8 quantization (using tools like llama.cpp or LiteRT) into your pipelines. Ship deltas and LoRA adapters instead of full models.

3. Delivery: Pull-Based GitOps for Sporadic Networks

Traditional push-based deployments fail offline. Design pull-based agents that sync during network windows — downloading only necessary updates or adapters.

4. New Observability

Monitor battery drain, thermal throttling, and inference latency on diverse low-resource hardware. “High availability” now means the system works when the farmer needs it most — even with zero bars of signal.

Cloud vs Edge: Indian Context Comparison

Aspect Cloud-First Models Gemma 4 Edge Models
Cost Recurring API fees (USD) One-time hardware, free inference
Internet Requirement High Fully offline capable
Data Privacy Data leaves the device Stays local
Language Support English-first Strong 140+ languages
Latency Variable (network dependent) Near-instant local
Deployment Control Vendor locked Full ownership (Apache 2.0)
Suitability for Rural Bharat Limited Purpose-built

Challenges We Must Address

No technology is perfect. Key issues include:

  • Risk of hallucinations in critical advice (needs verification loops or hybrid human-AI systems).
  • Need for domain-specific fine-tuning on Indian crop/livestock datasets.
  • Energy and thermal constraints on very low-end devices.
  • Last-mile distribution and digital literacy.

These are engineering + ecosystem problems we can solve together.

Conclusion: Engineering for the 43%

The true frontier of AI is not in multi-million dollar clusters in Silicon Valley. It is being forged at the rugged edge — in the hands of farmers, extension workers, and developers who understand local realities.

Gemma 4 won’t solve every problem overnight, but it lowers the barrier dramatically. By embracing edge-first design with open models, we shift DevOps responsibility from managing cloud bills to solving real constraints: every kilobyte, unpredictable networks, and diverse hardware.

It’s time to stop building only for the comfortable few. Frontier engineering should level the playing field for Bharat.

Let’s build for the 43%.

If you find the Article useful, make sure to share it among your socials, tagging me on Linkedin, Twitter.
Checkout my Youtube Channel