Build & Release #2: Five Patches for One Line of CSS

I was running through a quick test on April 27 when I noticed something almost funny. Light background. White-ish text. Just barely legible enough that you could tell text was supposed to be there, like a watermark someone forgot to remove.

The site was the 7onic documentation, rendered in light mode. My OS, however, was set to dark mode. The culprit? A single line in the body rule targeting --color-foreground.

I had shipped that exact line four days earlier in v0.3.1. I had already patched it once. By that morning, I was about to patch it a second time. (The third patch—the one that actually solved the mystery—wouldn’t happen until v0.3.5, and certainly not because I planned it.)

All in all, it took five releases and four different values for html body { color } to fix a text color. I patched the output file three separate times without ever touching the generator script—which meant every time I ran npm run sync-tokens, my pipeline would have silently regenerated the exact bug I was trying to kill.

The Original Sin

The chaos started with v0.3.1 on April 23. I introduced tokens/css/reset.css as a brand-new distribution file, bringing our total file count from 11 to 12. Tucked neatly inside this reset was a body baseline color set to var(--color-foreground). In that same release, I added --foreground: var(--color-foreground) to variables.css as a compatibility alias for Next.js.

It blew up the exact same day.

Next.js has a @​theme inline directive that emits --color-foreground: var(--foreground) on its end. Look closely at that loop: --foreground was pointing to --color-foreground, which was pointing right back to --foreground. The browser did exactly what browsers do when caught in a circular reference trap—it gave up and resolved the whole thing to unset.

Hours later, v0.3.2 went out as emergency triage. I pointed --foreground at var(--color-text) instead, deleted reset.css as a standalone file, and embedded the body baseline straight into variables.css. We were back down to 11 distribution files. I called this Approach Z because I had already burned through too many letters of the alphabet trying to make this work.

But the body color? It stayed as var(--color-foreground).

Three Days Later: Enter IACVT

April 27. White text on a white background.

The underlying mechanism took a while to see clearly, mostly because --color-foreground was defined in the codebase—it just wasn’t defined in variables.css. It lived exclusively in tokens/tailwind/v4-theme.css, a file you only ever import if you are actively using Tailwind v4. If a user imported variables.css standalone, used Tailwind v3, or pulled the raw CSS into a non-Tailwind project, that variable simply didn’t exist to them.

CSS has a terrifyingly specific name for what happens next: IACVT (Invalid At Computed Value Time).

The browser parses the CSS declaration perfectly fine. But at runtime, it tries to resolve var(--color-foreground), realizes it’s looking at a ghost, and throws the entire color declaration away. Not the whole CSS rule—just that one property.

The cascade then fell back to a global rule I had: html:root { color-scheme: light dark }. This tells the browser, “Hey, I support both themes, pick whatever makes sense.” Since my OS preference was set to dark mode, the browser obligingly picked a light text color for a dark background. Except, the actual background of the docs site was locked into light mode. Light text. Light background. Total invisibility.

The fix went out as v0.3.4. I swapped the variable from var(--color-foreground) to var(--foreground). Because --foreground is defined inside variables.css itself (within the html:root compatibility alias block), it is guaranteed to be available wherever variables.css is imported. I verified it locally, pushed, tagged, and called it a day.

Or so I thought.

I had patched the compiled output file. I had not looked at the generator.

The generator was a script named scripts/sync-tokens.ts, which automatically spits out tokens/css/variables.css. Back in v0.3.3, when I was messing around with a monospace font baseline, I had touched that generator code and hardcoded it to emit color: var(--color-foreground). I had manually hotfixed the output file, but I forgot to fix the robot that writes the file. Nobody noticed. There was no one else to notice.

The Generator Never Lies

The next day, while working on something completely unrelated, I casually ran npm run sync-tokens.

I checked the git diff. The script had proudly stripped away my manual hotfix and put var(--color-foreground) right back into production.

That was the moment.

Version 0.3.5 shipped on April 28. This time, I fixed the actual generator code to emit var(--color-text), and updated the output file to match. The first execution of the fixed script reported 1 updated, 12 unchanged. Running it a second time yielded 0 updated, 13 unchanged. Idempotent. Finally.

--color-text comes straight from our core theme files: themes/light.css (resolving to gray-900) and themes/dark.css (resolving to gray-100). No aliases. No indirection. It is defined in every single supported import permutation because it maps directly back to our Figma Single Source of Truth—the exact source this entire pipeline was built to serve.

Decoupling the Three Variables

Looking at the three variables lined up side-by-side makes the architectural hierarchy glaringly obvious:

--color-foreground is a Tailwind v4 alias. It lives strictly in v4-theme.css so Tailwind utility classes can map correctly. Outside of Tailwind v4, it does not exist.

--foreground is a Next.js compatibility alias. It lives in the html:root block of variables.css so Next.js’s @​theme inline compiler has something to bind to.

--color-text is the Figma token. It lives in the core theme files — named after the *-text token convention in figma-tokens.json, the same source the entire pipeline was built around.

The baseline rule inside html body is the most universal selector in the entire project. By extension, it requires the most universal variable available. That was --color-text the whole time. It had been sitting quietly in the theme files before any of this madness even started.

I had instinctively reached for the Tailwind alias because Tailwind was the immediate sandbox environment I was developing in, completely forgetting that the resulting raw CSS file would be consumed by developers who weren’t using Tailwind at all.

The build generator was the only honest witness to what code I was actually shipping to production. I just wasn’t bothered to ask it.

Next: 22 of the 42 components in 7onic shipped with two different import patterns at the same time. Both worked. One was a mistake.

About 7onic — An open-source React design system where design and code never drift. Free, MIT licensed. Docs and interactive playground at 7onic.design. Source code on GitHub — stars appreciated. More posts in this series at blog.7onic.design. Follow updates on X at @​7onicHQ.

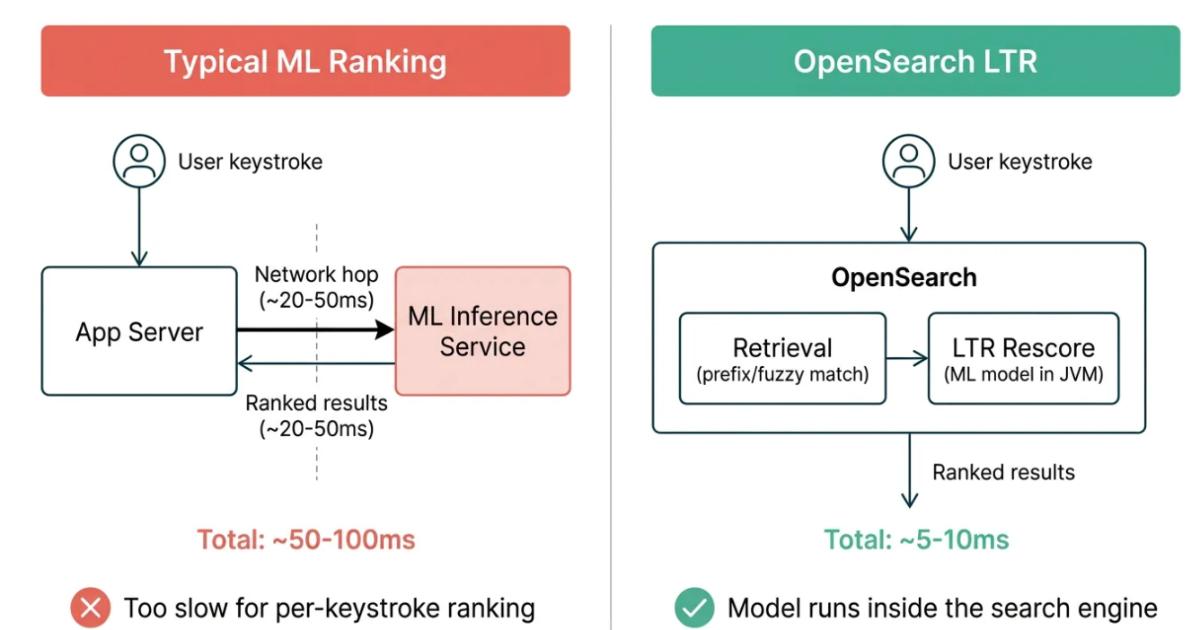
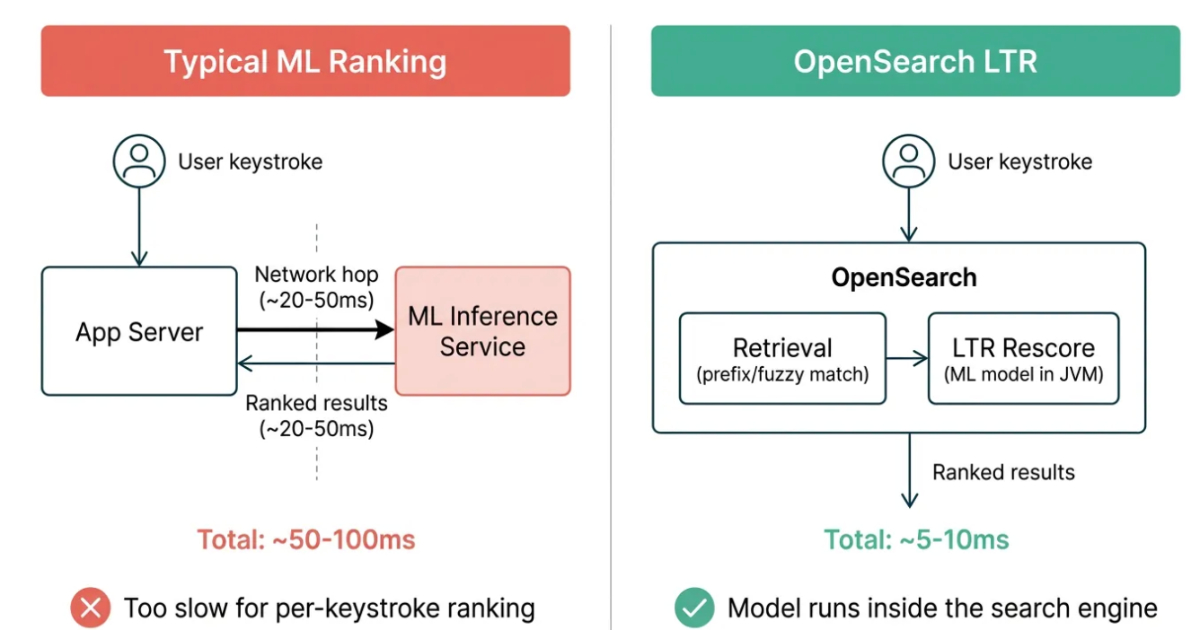
Swiggy Improves Search Autocomplete Using Real Time Machine Learning Ranking

Swiggy detailed real-time machine-learning ranking system for autocomplete built on OpenSearch. The architecture separates candidate generation and ranking, uses feature stores for real time signals, and applies learning to rank models for improved relevance. It replaces heuristic ranking while maintaining strict latency constraints and enabling continuous model updates from user behavior signals.

By Leela Kumili

Barbacane vs Portkey and LiteLLM: picking an AI gateway in 2026

If you are picking an AI gateway in 2026, Portkey, LiteLLM, and Barbacane are all real options. They overlap enough to make the choice real, and they differ enough that the right answer depends on what else you want your gateway to do.

Every AI-gateway evaluation runs into the same question after the first demo: once your OpenAI calls go through a gateway, what about everything else? The rate limits your platform team owns, the auth your security team owns, the audit trail your compliance team owns, the spec-first workflow your API team relies on, the agents calling back the other way. The more of that lives next to the AI traffic, the more the choice of AI gateway becomes an architecture decision and not a feature match.

This post compares the three products on that axis. What they share. What separates them. How to pick.

The overlap: outbound LLM proxying

All three products sit between your application and one or more LLM providers. All three give you:

  • Provider abstraction with an OpenAI-compatible API surface
  • Fallback chains when a provider errors, times out, or is unreachable
  • Token usage and latency metrics per call and per provider
  • Budget and rate-limit guardrails at the gateway layer
  • Prompt and response guardrails (scope varies by product)

If outbound LLM proxy is all you need, all three will work. The differences show up in what else the gateway does, how it is configured, and what happens when your requirements grow beyond the LLM path.

What Portkey is

Portkey is a commercial AI gateway, available as managed SaaS or self-hosted. It focuses specifically on the LLM path and invests heavily in the operator experience: a configuration UI, a playground, a prompt library, an observability dashboard purpose-built for LLM traffic. It tends to be the right pick if you want an AI gateway as a product (vendor support, managed upgrades, fancy UI) and AI is the thing your team cares about most.

What LiteLLM is

LiteLLM is an open-source Python proxy that exposes a very broad set of LLM providers behind one unified OpenAI-compatible API. Actively developed, wide provider coverage, can run as a Python library or as a proxy server. Good pick if you want broad provider support, an MIT-licensed OSS foundation, and a Python-native runtime that plays well with your ML tooling.

What Barbacane is

Barbacane is an open-source, Rust-native API gateway. AI capability is built from composable plugins rather than a monolithic feature:

  • ai-proxy dispatcher routes requests to OpenAI, Anthropic, and Ollama (plus any OpenAI-compatible endpoint: vLLM, TGI, LocalAI, Azure). The client always sends OpenAI format; the dispatcher translates per provider, pins the provider API version, and handles SSE streaming where the provider supports it.
  • Named targets + cel middleware express policy-driven routing. A target like premium is a full provider profile (provider, model, credentials); the cel middleware writes ai.target into the request context when a rule matches, and the dispatcher picks the target from there. Credentials never leave dispatcher config.
  • ai-prompt-guard, ai-token-limit, ai-cost-tracker, ai-response-guard middlewares compose around the dispatcher. Each is a separate, skippable concern with named profiles, CEL expressions, and fail-closed defaults on misconfig.

And one more capability Portkey and LiteLLM do not offer: Barbacane is also an MCP gateway. The same artifact that proxies your LLM traffic outbound also exposes your existing APIs to AI agents as tools inbound. One gateway covers both directions of AI traffic.

The architectural difference: monolithic AI proxy vs dispatcher plus middlewares

This is where the three products diverge.

Portkey and LiteLLM treat the AI gateway as a unified product: one binary, one config, one API surface. Every operational concern (rate limits, caching, observability, guardrails) is a feature baked into the proxy. This is the right shape when AI is the only traffic the gateway handles.

Barbacane treats the AI gateway as a set of primitives you compose:

  • The ai-proxy dispatcher handles translation and routing.
  • Each concern is a separate middleware, ordered explicitly in the spec.
  • You stack the middlewares you need, skip the ones you do not, and compose multiple instances of the same plugin (stack two ai-token-limit instances for a minute-and-hour window, stack multiple cel rules for routing).
  • The exact same primitives govern non-AI traffic on the same gateway.

The trade-off is sharp. If you want the shortest path from zero to “OpenAI call via a gateway”, Portkey and LiteLLM win on time-to-live. If you want AI traffic governed the same way your team already governs every other HTTP request, Barbacane’s composition model gets you there without a second product to run, a second config source to reconcile, or a second telemetry stack to watch.

The architectural bet is the same one the service-mesh community made five years ago: specialized proxies for specialized traffic, or one data plane that handles every protocol your platform cares about. Both are valid; they produce different operational footprints.

Spec-first: OpenAPI as source of truth

Portkey and LiteLLM configure AI routes in their own config files (YAML for LiteLLM, config UI or SDK for Portkey). Barbacane configures AI routes in your OpenAPI spec:

paths:
  /v1/chat/completions:
    post:
      operationId: chatCompletion
      summary: Route LLM chat completion requests
      x-barbacane-dispatch:
        name: ai-proxy
        config:
          provider: openai
          model: gpt-4o
          api_key: "${OPENAI_API_KEY}"
          fallback:
            - provider: anthropic
              model: claude-sonnet-4-20250514
              api_key: "${ANTHROPIC_API_KEY}"
            - provider: ollama
              model: llama3
              base_url: http://ollama:11434

The documentation your frontend team reads, the client SDKs they generate, the contracts your platform team enforces, and the gateway config your SRE team operates all derive from the same file. Adding an LLM route adds an entry in the spec. Renaming a parameter renames it everywhere. Vacuum-based lint runs shift-left in your editor, in a pre-commit hook, or in CI, so provider typos and invalid regex patterns fail at lint time, not at call time.

If your organization is already spec-first for non-AI APIs, extending that discipline to AI routes is the cheapest integration path. If you do not run spec-first APIs, Portkey and LiteLLM feel more familiar because they do not ask you to change your workflow.

The inbound direction: MCP

One axis Portkey and LiteLLM do not compete on.

Portkey and LiteLLM sit between your application and the LLM. They do not stand between an AI agent and your APIs. That inbound direction is a different gateway category; we covered it at length in the canonical MCP gateway post.

Barbacane is a full MCP gateway in addition to its outbound AI capability. One artifact handles both directions. Whether that matters depends on whether agents calling your APIs is in scope:

  • If you are building an agent product and your agents only hit public tools and third-party services, the inbound direction does not apply and the MCP capability is not doing work for you.
  • If your agents call your internal APIs, or if you are a platform team preparing to expose internal APIs to agents built elsewhere, the inbound direction is real work. Barbacane treats it as a first-class concern. Portkey and LiteLLM leave it outside the gateway entirely, which means a separate MCP server per service and all the sprawl the canonical post describes.

When to pick which

Situation Pick
Fastest path from zero to an OpenAI call via a gateway, with an operator UI Portkey
Very broad LLM provider coverage, Python-native, OSS-first LiteLLM
Managed SaaS with vendor support and a polished dashboard Portkey
AI gateway as part of a broader API gateway, not a second box Barbacane
AI routes defined in your OpenAPI spec alongside the rest of your API Barbacane
Same gateway also exposes your APIs to AI agents via MCP Barbacane
OSS, self-hostable, Rust-native, FIPS-ready for regulated-industry posture Barbacane
Platform team; AI is one of many gateway concerns (auth, routing, observability) Barbacane
AI-first product team; LLM calls are the only traffic the gateway proxies Portkey or LiteLLM

Feature comparison

A compact, direction-setting comparison. All three products evolve; check current docs before committing.

Concern Portkey LiteLLM Barbacane
Outbound LLM proxy Yes Yes Yes (ai-proxy dispatcher)
Inbound MCP gateway No No Yes
Provider coverage Broad Very broad (100+ models) OpenAI, Anthropic, Ollama, plus any OpenAI-compat API
Provider fallback Yes Yes Yes
Policy-driven routing Yes Yes Yes (via cel middleware + named targets)
Prompt and response guardrails Built in Built in ai-prompt-guard + ai-response-guard middlewares
Token rate limits Built in Built in ai-token-limit middleware
Cost tracking Built-in dashboard Built-in metrics ai-cost-tracker middleware
Source of truth for config Config UI or SDK YAML config OpenAPI spec
Runtime SaaS and self-host Python proxy Rust binary
License Commercial MIT AGPLv3 + commercial
Governs non-AI HTTP traffic No No Yes (full API gateway)

Where a row says “No”, the product was not designed for that concern. Forcing a tool into the wrong role is how shadow stacks start.

What to watch for during procurement

If you are being pitched an AI gateway and the first question is “do you already run an API gateway?”, you are in the right conversation. If it is not asked, ask it yourself. The answer changes what you need from the new product.

A short procurement checklist:

  1. Where does AI gateway config live? If the answer is “a second config file”, you are creating a drift source. Prefer products that integrate with the spec or config surface your team already uses.
  2. Is the feature set monolithic or composable? Monolithic is simpler day one and harder to extend. Composable is more to learn and easier to shape to your operational model.
  3. Does it govern agent traffic too? If agents calling your APIs is on your roadmap, ask about MCP. If not, skip.
  4. How does it integrate with your observability stack? Prometheus, OpenTelemetry, structured logs. Avoid products that ship their own telemetry you have to separately consume.
  5. Self-hosting path and license. SaaS is fine for many teams; regulated, on-prem, or air-gapped environments will need an OSS, self-hostable option.

Closing thoughts

All three products handle the core outbound LLM path competently. The axis that differentiates them is how the AI gateway relates to the rest of your infrastructure:

  • If AI is the primary problem and the AI gateway stands alone, Portkey or LiteLLM will get you live faster. Pick Portkey if you want SaaS with a UI. Pick LiteLLM if you want OSS breadth and a Python runtime.
  • If AI is one of several gateway concerns and you want one spec-first artifact covering auth, rate limits, routing, AI, and MCP, Barbacane is the architecture fit.

Pick by architecture, not feature count. The feature sets will converge; the architectural assumptions will not.

For the Barbacane side of the comparison, the /ai page is the five-minute version, and the canonical MCP gateway post is the longer read. For Portkey and LiteLLM, their own docs are the right place to start; their positioning is consistent enough that a fair comparison is easier now than it was a year ago.

The Agent That Created 107 PRs (And Why That Was the Problem)

The Agent That Created 107 PRs (And Why That Was the Problem)

One of our leaders has a way of framing AI initiatives that I find genuinely useful. Three buckets: Vibe Coding, Professional AI Assistant, and Autonomous Agents. I won’t unpack it further, but if you work in a large engineering org right now, you probably recognise all three.

The push has been toward that third one. And the metrics look good. Story points closed. Alerts resolved. PRs raised. Numbers that are easy to put on a slide for the CIO.

This is a story about what those numbers don’t show.

107 Pull Requests on a Monday Morning

We had a backlog of code scanning alerts. The kind that quietly builds up over months because no sprint ever picks it up and no one owns it. Security debt, sitting in a dashboard.

Someone decided to assign an autonomous agent to clear it.

By Monday morning, the agent had reviewed every alert, produced a fix for every one, and opened 107 pull requests for engineers to review and approve.

On a leadership slide, this is a win. Backlog cleared overnight.

What the Metrics Don’t Capture

Someone still had to read those 107 PRs. Not skim them. Actually understand them.

Each one required an engineer to figure out what the original alert was, read what the agent changed, decide whether the fix was correct for this specific codebase, and check whether it introduced new risk.

The agent didn’t know the context. It was not asked to reason about it. It was asked to act.

The story points looked great. The review queue told a different story.

The Fix That Wasn’t Really a Fix

Here is the part I keep thinking about.

One of the alerts was a Java trust boundary violation in an old codebase. Code from the 1990s that, during build time, pulls in source from another project. The agent saw the violation, could not change the original source, and wrote a Python script to handle it at build time.

Technically, the alert was resolved.

But any engineer who has worked on legacy systems knows what that means. You now have a silent dependency. If anyone changes the original code, for any reason, the Python script breaks. There is no warning. There is no test. The fix works until it doesn’t, and when it stops working, the person debugging it has no idea why.

Was that the only way to address it? Maybe. This is old code and the constraints were real.

But that is exactly the conversation that should have happened before anyone wrote a single line. Not “here is the fix.” Instead, “here is what I found, here is why it’s complicated, here is one option and here is what it risks.”

The agent skipped that conversation entirely.

Two Different Dashboards

A CIO sees 107 security issues resolved by an autonomous agent overnight. That is a real number and genuinely impressive work.

A Principal Engineer sees 107 changes that need to be validated before trusting any of them, plus at least one fix that trades a known vulnerability for an invisible fragility.

Neither view is wrong. They are measuring different things.

The CIO is measuring output. The Principal Engineer is measuring trust. The cost of validating an agent’s work at scale does not show up in story points. And when leadership optimises for the number without understanding what the number measures, the gap between those two dashboards gets wider.

What I Actually Want to Know

I don’t have a tidy answer here. But I am curious whether others have seen this same dynamic, where the metrics say one thing and the engineers feel something different.

A few honest questions:

  • Have your AI agent metrics told a different story than what your engineers experienced on the ground?
  • How do you measure the review burden an agent creates, not just the output it produces?
  • Is your organisation pushing toward autonomous agents right now, and if so, what does human oversight look like in practice?
  • And when an agent finds something genuinely complex, something with history and context and tradeoffs, what should it do? Act, and let a human review it? Or stop and ask first?

I want to hear the real stories in the comments. The ones that didn’t make it onto the slide.

Automatización tradicional vs Agentes de IA: cómo elegir sin disparar los costos

No todo necesita IA

A veces lo correcto sigue siendo un cron, un script, una regla bien escrita o un workflow simple. La automatización tradicional y los agentes de IA no compiten necesariamente: resuelven problemas distintos.

La clave es saber cuándo la IA realmente justifica su costo.

La regla simple

Usa automatización tradicional cuando el problema tenga reglas claras.

Usa agentes de IA cuando el problema requiera interpretar contexto, lenguaje natural o manejar ambigüedad.

Hablemos de costos

La automatización tradicional tiene un costo inicial de desarrollo, pero luego suele ser barata de operar.

Un script, una función serverless o un workflow pueden ejecutarse miles de veces con bajo costo.

Los agentes de IA funcionan distinto. Su costo puede crecer por:

  • Tokens de entrada y salida.
  • Tamaño del contexto.
  • Número de llamadas al modelo.
  • Uso de modelos grandes.
  • Reintentos y herramientas externas.

Por eso, antes de meter IA en un proceso, la pregunta NO debería ser:

¿Puede la IA hacerlo?

La pregunta correcta es:

¿La IA aporta suficiente valor para justificar su costo?

Porque clasificar 20 tickets al día con IA puede tener sentido.

Clasificar millones de logs diarios con un modelo grande… probablemente no tanto.

Comparación rápida

Característica Automatización tradicional Agentes de IA
Tipo de problema Claro, repetitivo, estructurado Ambiguo, contextual, lenguaje natural
Costo operativo Bajo Puede ser alto
Flexibilidad Limitada por reglas Alta
Predictibilidad Alta Media
Casos ideales Validaciones, jobs, workflows, reglas Resúmenes, clasificación, análisis, recomendaciones

El mejor enfoque suele ser híbrido

En muchos escenarios, la mejor solución no es elegir uno u otro, sino combinarlos.

La automatización tradicional se encarga de lo determinista:

  • Detectar eventos.
  • Ejecutar reglas.
  • Validar condiciones.
  • Aplicar controles.
  • Registrar auditoría.

La IA se encarga de lo que requiere mayor análisis:

  • Interpretar contexto.
  • Resumir información.
  • Proponer hipótesis.
  • Clasificar casos complejos.
  • Generar recomendaciones.

Y el humano sigue en el loop cuando hay impacto alto:

  • Aprobar acciones críticas.
  • Revisar decisiones sensibles.
  • Ajustar criterios.

Porque un agente puede sugerir un rollback, pero no siempre debería tener el botón de producción en la mano. 😄

Ejemplo: flujo híbrido para incident response

Prometheus dispara una alerta
        ↓
Automatización crea el incidente
        ↓
Se recopilan métricas, logs y cambios recientes
        ↓
Agente de IA resume el contexto
        ↓
Agente propone posibles causas
        ↓
Reglas validan acciones permitidas
        ↓
Humano aprueba si hay impacto alto
        ↓
Automatización ejecuta la acción

Ejemplo práctico:

Un servicio en Kubernetes empieza a consumir mucha CPU después de un deployment.

La automatización puede crear el incidente, recopilar métricas y buscar cambios recientes.

El agente de IA puede resumir los logs y sugerir:

“El aumento de CPU comenzó tres minutos después del release v2.8.1.”

Luego las reglas validan si el rollback está permitido y, si el impacto es alto, un humano aprueba la acción.

Ese diseño mantiene control, reduce ruido y evita que la IA actúe como root con exceso de confianza.

Cómo decidir

Usa esta guía rápida:

Pregunta Si la respuesta es “sí” Puntos
¿Hay reglas ambiguas o cambiantes? Favorece IA +2
¿La entrada viene en texto libre, tickets, correos o logs? Favorece IA +2
¿Se necesita resumir, interpretar o priorizar? Favorece IA +2
¿La IA ahorra tiempo experto? Favorece IA +2
¿El proceso es crítico y no tolera errores? Favorece automatización tradicional -2
¿La tarea es simple, repetitiva y de alto volumen? Favorece automatización tradicional -2

Interpretación

Puntaje final Recomendación
-4 a 0 Automatización tradicional
1 a 5 Enfoque híbrido
6 a 8 Agentes de IA con controles

Pitfalls comunes

Usar IA para tareas simples

Si una regla clara resuelve el problema, usa una regla.

No necesitas un modelo de lenguaje para saber que un status_code >= 500 es mala señal.

No estimar el volumen

Una prueba con 100 eventos puede parecer barata.

Pero producción no vive en 100 eventos.

Antes de usar IA, estima:

costo mensual = eventos por mes × tokens promedio × costo del modelo

Darle demasiada autonomía al agente

La IA puede recomendar, resumir y priorizar.

Pero para acciones críticas, usa controles:

  • Allowlist de acciones.
  • Validaciones deterministas.
  • Aprobación humana.
  • Auditoría.
  • Rollback seguro.

Key Takeaways

  • La automatización tradicional sigue siendo ideal para procesos claros, repetitivos y baratos.
  • Los agentes de IA son útiles cuando hay ambigüedad, lenguaje natural o análisis contextual.
  • El costo de IA crece con tokens, contexto, llamadas y volumen.
  • El enfoque híbrido suele ser el más eficiente.
  • La IA debería asistir decisiones críticas, no ejecutarlas sin control.

TL;DR

No uses IA solo porque está de moda.

Usa automatización tradicional para reglas claras y ejecución predecible.

Usa agentes de IA para interpretar contexto, resumir información y apoyar decisiones complejas.

El mejor diseño suele ser:

Reglas para controlar.
IA para analizar.
Humanos para aprobar.
Automatización para ejecutar.

La arquitectura más inteligente no es la que usa más IA.

Es la que usa IA donde realmente aporta valor.

What GenAI Actually Costs in Production

The first number anyone quotes when asked what generative AI costs is a per-token figure. It is a comfortable number — small, unambiguous, available on a vendor’s pricing page, and easy to multiply by an estimated request volume to produce a monthly total. It is also, on inspection of any actual production deployment, the smaller piece of what the company is paying.

I want to take that number seriously, then take it apart. The per-token bill is real. It is also the visible tip of a stack whose other line items, individually and in aggregate, dominate it. The “managed API vs self-hosted open-source” comparison that lives in every 2026 AI deck is, in the deck version, missing the seven other variables that decide the answer. With those variables back in the picture, the comparison stops being a comparison of compute prices and becomes a question about a company’s volume, team, and tolerance for failure modes.

The visible math

For a concrete example: an internal assistant handling a million requests per month, average request size 1,000 input tokens and 500 output tokens. With current Western API pricing:

These are not large numbers. A million requests is a serious internal deployment, and the inference bill for a serious internal deployment lands in the same order of magnitude as one mid-level engineer’s monthly fully-loaded compensation. Anthropic’s own pricing materials note that prompt caching can cut input-token cost by up to 90% on cached prefixes, and batch processing offers another 50% on bulk workloads, which can pull these figures lower in production patterns where cache hit rates are high.

If the conversation stops here — and it usually does — the company has now compared three pricing-page numbers and picked the one with the smallest digit. That is the answer to a different question than the one anyone meant to ask.

The first invisible layer

A production GenAI service is rarely a single API call wrapped in a function. The architecture diagrams that ship to engineering review include a backend service, a vector database for retrieval-augmented generation, embedding generation (separately metered), a document store, an authorisation layer, content moderation and guardrails, request tracing, quality monitoring, structured logging, rate limits, retry queues, and a CI/CD path for prompts and model versions. None of this lives on the model vendor’s pricing page.

Order-of-magnitude estimates for a serious internal deployment in 2026:

  • A managed vector DB such as Pinecone or Weaviate Cloud: $200–2,000 per month at moderate index sizes; pgvector on managed Postgres in the same range or lower.
  • Embedding generation: a separate per-token line, often a quarter to a half of the LLM input bill at RAG-heavy workloads.
  • Tracing and observability tooling (LangSmith, Phoenix, Helicone, or a Datadog plus custom instrumentation stack): $500–5,000 per month depending on volume and retention.
  • Guardrails / moderation: free if the model vendor’s content filter is sufficient, or $1,000–10,000 per month for a managed third-party tool.
  • Document storage and access control: small in isolation, real in aggregate, especially with auditable retention.

That stack runs $5,000–25,000 per month for the kind of deployment whose inference bill is $10,000–17,500. The first invisible layer is, by itself, the same order of magnitude as the visible one.

The dominant line item

Production GenAI requires a team. The minimum viable headcount for a service the company is willing to put in front of paying users or sensitive internal data is something like:

  • A backend engineer, for the API surface, business logic, and integrations.
  • An ML or LLM engineer, for model selection, prompts, evaluations, and quality metrics.
  • A platform / SRE engineer, for the orchestration, GPU when present, CI/CD, and observability wiring.
  • Some fraction of a security or compliance person, for the data flow, audit logs, and PII handling.
  • Some fraction of a product person, for the use-case definition and prioritisation.

Levels.fyi’s 2026 data places the median US Machine Learning Engineer total compensation at $264,400, with senior FAANG engineers reaching $350,000 and above and mid-market senior compensation, depending on the source’s mix of base and total comp, landing in roughly the $180,000–260,000 range. Backend and platform engineers track those numbers within ten or fifteen percent. International compensation varies sharply; EU senior comp tends to land lower, but the structural point — that engineers are expensive — does not.

Three engineers at $250,000 each in total comp, fully loaded with employer payroll tax, benefits, equipment, management overhead, and recruiting amortisation, is on the order of one million dollars per year. About $83,000 per month. That single line item dwarfs the inference bill at any volume below several million requests per day, and it dwarfs the GPU-rental bill at any volume the team would actually run on its own hardware.

The naive math — “API costs $10K per month, self-host costs $40K per month, therefore API wins” — is not wrong about those two numbers. It is wrong about which numbers are the deciding ones.

Self-host with the full stack

A self-hosted serving deployment is the second comparison most teams reach for. The compute side has fallen dramatically through 2025 and into 2026. AWS’s p5.48xlarge instance, with eight NVIDIA H100s, lists at $55.04 per hour on-demand in us-east-1 as of May 2026, which works out to roughly $39,600 per month sustained, or about $6.88 per GPU-hour at the box level. Other H100 cloud providers run from $1.49 to $6.98 per GPU-hour depending on commitment, region, and provider tier, with the spot and longer-commitment ends of that range producing much lower numbers than the on-demand top.

The compute is real, and the compute is not the part that decides. Self-hosting means picking and operating a serving framework — vLLM and Text Generation Inference are the dominant choices in 2026 — and picking and operating the orchestration around it: Kubernetes or a comparable runtime, container registries, model artifact storage, an evaluation harness that runs on every model update, an on-call rotation that knows what to do when an inference replica wedges, a release-gating process for new model versions, and a documented procedure for the cases when an OSS model is deprecated by its publisher and needs to be rotated to a successor.

Each of those pieces costs money in the same way the first invisible layer does: not enormous in isolation, real in aggregate, and entirely absent from the GPU-hourly figure that dominates the comparison slide. The break-even where self-host beats managed API has moved as H100 rentals have fallen, but the break-even has moved against a fixed people cost. At realistic per-team headcounts, the break-even is still north of the volume most internal services run.

The cost of a bad answer

Quality is a cost. The framing of LLM cost as a token-pricing question quietly assumes that any answer the model produces is worth the price of producing it. In production deployments the assumption is wrong, often by an order of magnitude.

A wrong answer in a finance tool has a remediation cost: manual rework, an inflated escalation queue, sometimes a regulatory disclosure. A wrong answer in a legal-research tool has a similar profile, with the additional risk that nobody catches it until the document leaves the building. A wrong answer in a customer-support tool produces a churned customer; a wrong answer in an engineering tool produces a real bug in real code. Each of these has a dollar value that does not appear on the model pricing page.

The straightforward implication is that a more expensive model that is right ninety-five percent of the time can be cheaper than a less expensive model that is right eighty percent of the time, once the cost of the missed five percent is accounted for. The same argument applies to running a smaller model with a more sophisticated retrieval layer versus running a larger model with cheaper retrieval. The decision-relevant comparison is the cost-per-correct-answer, not the cost-per-token.

This is the line item teams least often track and most often are surprised by.

The honest TCO

A defensible total-cost-of-ownership formula for a production GenAI system looks something like this, in the order the line items dominate at typical scale:

  • People, fully loaded.
  • Cost of bad answers, evaluated against the use case’s quality bar.
  • Self-host compute, when present, or managed-API inference, when not.
  • The first invisible layer (vector DB, embeddings, tracing, guardrails, moderation, logging, queues, retries).
  • Storage, network, and CI/CD.
  • Model-update churn — regression testing, prompt rebuilds, rollback capacity, the engineering hours absorbed every time a vendor deprecates a version or changes a behaviour.
  • Security and compliance, separately accounted because audit cost is real and uneven.

For a team running a serious deployment in 2026, none of these are zero. The first three together are typically eighty percent or more of the total. The token bill, the number that started the conversation, often comes in at five to fifteen percent of TCO at the volumes most teams actually operate.

The practical implication is not “self-hosting is bad” or “managed APIs are bad.” It is that the question “what does GenAI cost?” has a different answer at different scales, with different teams, against different quality bars. A small deployment with a serious quality requirement and a small team is cleanly served by a managed API with high-quality models, because the dominant cost is the team and a more expensive model is the cheapest way to reduce the team’s load. A large deployment with a stable workload, a quality bar that tolerates self-hosted-OSS quality, and a mature platform team is cleanly served by self-hosting, because at sufficient volume the compute line item becomes the dominant variable cost and the team is already paid for. Neither answer is “obvious” without doing the full TCO; both answers fall out of the formula once it is run.

What the per-token comparison is for

The per-token number is not useless. It is the one variable that is genuinely linear in volume, that is genuinely transparent, and that genuinely reflects a real cost. For sizing exercises, capacity planning, and quick architectural sketches it is the right starting number. The error is treating it as the finishing number — as if the conclusion of the cost analysis is contained in the same figure that started it.

A production cost analysis worth running in 2026 looks more like the formula above than like a per-token spreadsheet. It includes the team, the quality bar, the storage, the observability, and the model-update churn, and it produces an answer over a six-to-twelve month horizon rather than a single month. The numbers are easy to gather and the math is not difficult. The discipline is in remembering to include the line items that are not on the model vendor’s pricing page.

The right question

The question “which model is cheaper?” has a clean answer on the pricing page and a misleading one in the deployment. The question “which architecture meets our quality, latency, security, and operational requirements at minimum total cost of ownership at our actual volume?” has a more useful answer, and a different one for different organisations on the same day.

On the worked numbers above, a typical serious deployment lands at $10,000 to $25,000 per month for inference and several multiples of that for the rest of the stack — and the team usually discovers this slowly, line item by line item, as production volume rises and the headcount grows around it. The discovery would arrive faster, and the architectural decisions would be better, if the conversation started with the full TCO formula instead of the visible number on the pricing page. The visible number on the pricing page is one of seven. It is also, in most cases, the smallest of them. That is the part the per-token comparison hides, and that is the part the architectural decision should be built on.

Build Reusable Logic with Custom Hooks in React

Welcome back to the “Let’s Master React Hooks Together” series.

So far in this series, we’ve explored several important React Hooks and understood how they help manage state, side effects, performance optimization, references, and more inside React applications.

Now we’ve reached one of the most practical and powerful topics in React development — Custom Hooks.

This is the point where React applications start becoming cleaner, smarter, and more reusable.

As applications grow, developers often notice the same logic repeating in multiple components:

  • Fetching API data
  • Managing forms
  • Handling authentication
  • Tracking screen size
  • Working with local storage
  • Managing counters and timers

Instead of rewriting the same logic again and again, React allows us to extract that logic into reusable functions called Custom Hooks.

In this episode, we’ll deeply understand:

  • What Custom Hooks are
  • The official React definition
  • Why they are important
  • When to use them
  • How to create them
  • Real-world examples
  • Best practices
  • Common mistakes to avoid

Let’s get started.

Custom Hooks in React: Reusing Logic the Smart Way

When building React applications, one thing becomes obvious very quickly: the same logic appears again and again.

You fetch data in multiple components.
You track window size in several places.
You handle form inputs repeatedly.
You manage loading states everywhere.

At first, copying and pasting feels fast. But after a while, your code becomes difficult to maintain.

That’s exactly where Custom Hooks become useful.

Custom Hooks are one of the most powerful patterns in React because they allow you to extract reusable logic into a clean and reusable function.

In this article, we’ll understand:

  • What Custom Hooks are
  • The official React definition
  • Why they exist
  • When to use them
  • How to create them
  • Where they are useful in real projects
  • Best practices and common mistakes
  • Real-world examples

What Is a Custom Hook?

According to the official React documentation:

“A custom Hook is a JavaScript function whose name starts with use and that may call other Hooks.”

At first glance, this definition feels simple. But there’s more behind it.

A Custom Hook is basically:

  • A reusable function
  • That contains React logic
  • And can internally use hooks like useState, useEffect, useContext, etc.

Instead of duplicating logic across components, you move that logic into a reusable hook.

Why Custom Hooks Exist

To understand why Custom Hooks matter, let’s first look at a common problem.

Imagine you have multiple components fetching data from an API.

import { useState, useEffect } from "react";

function Users() {
  const [users, setUsers] = useState([]);

  useEffect(() => {
    fetch("https://jsonplaceholder.typicode.com/users")
      .then((res) => res.json())
      .then((data) => setUsers(data));
  }, []);

  return (
    <div>
      {users.map((user) => (
        <p key={user.id}>{user.name}</p>
      ))}
    </div>
  );
}

Now another component needs similar fetching logic.

import { useState, useEffect } from "react";

function Posts() {
  const [posts, setPosts] = useState([]);

  useEffect(() => {
    fetch("https://jsonplaceholder.typicode.com/posts")
      .then((res) => res.json())
      .then((data) => setPosts(data));
  }, []);

  return (
    <div>
      {posts.map((post) => (
        <p key={post.id}>{post.title}</p>
      ))}
    </div>
  );
}

Notice something?

The fetching logic is almost identical.

This creates problems:

  • Duplicate code
  • Harder maintenance
  • Repeated bug fixes
  • Larger components
  • Poor readability

Custom Hooks solve this by extracting reusable behavior.

Understanding the Real Purpose of Custom Hooks

A lot of developers think Custom Hooks are only for reducing code duplication.

That’s true — but not the full picture.

The real purpose is:

1. Reusability

Write logic once and use it anywhere.

2. Separation of Concerns

Your component focuses on UI while the hook handles logic.

3. Cleaner Components

Components become smaller and easier to read.

4. Better Maintainability

Updating logic in one place updates it everywhere.

5. Easier Testing

You can test business logic separately from UI.

The Rules of Custom Hooks

Custom Hooks follow the same rules as React Hooks.

Rule 1: The function name must start with use

Correct:

useFetchData()

Wrong:

fetchData()

React relies on this naming convention internally.

Rule 2: Hooks must be called at the top level

Do not call hooks inside:

  • loops
  • conditions
  • nested functions

Wrong:

if (show) {
  useEffect(() => {});
}

Correct:

useEffect(() => {
  if (show) {
    // logic here
  }
}, [show]);

How to Create a Custom Hook

The structure is very simple.

function useSomething() {
  // hook logic

  return something;
}

That’s it.

Now let’s build a real example.

Example 1: Creating a useFetch Hook

Step 1: Create the Hook

import { useEffect, useState } from "react";

function useFetch(url) {
  const [data, setData] = useState([]);
  const [loading, setLoading] = useState(true);
  const [error, setError] = useState(null);

  useEffect(() => {
    async function fetchData() {
      try {
        setLoading(true);

        const response = await fetch(url);

        if (!response.ok) {
          throw new Error("Failed to fetch data");
        }

        const result = await response.json();

        setData(result);
      } catch (err) {
        setError(err.message);
      } finally {
        setLoading(false);
      }
    }

    fetchData();
  }, [url]);

  return { data, loading, error };
}

export default useFetch;

Step 2: Use the Hook

import useFetch from "./useFetch";

function Users() {
  const { data, loading, error } = useFetch(
    "https://jsonplaceholder.typicode.com/users"
  );

  if (loading) return <p>Loading...</p>;

  if (error) return <p>{error}</p>;

  return (
    <div>
      {data.map((user) => (
        <p key={user.id}>{user.name}</p>
      ))}
    </div>
  );
}

Now the component is much cleaner.

The fetching logic lives in one reusable place.

Example 2: Creating a useCounter Hook

One of the simplest and most common examples of a Custom Hook is a counter.

Instead of managing counter logic separately in every component, we can create a reusable hook.

Step 1: Create the Hook

import { useState } from "react";

function useCounter(initialValue = 0) {
  const [count, setCount] = useState(initialValue);

  const increment = () => {
    setCount((prev) => prev + 1);
  };

  const decrement = () => {
    setCount((prev) => prev - 1);
  };

  const reset = () => {
    setCount(initialValue);
  };

  return {
    count,
    increment,
    decrement,
    reset,
  };
}

export default useCounter;

Step 2: Use the Hook

import useCounter from "./useCounter";

function Counter() {
  const {
    count,
    increment,
    decrement,
    reset,
  } = useCounter(10);

  return (
    <div>
      <h2>{count}</h2>

      <button onClick={increment}>
        Increment
      </button>

      <button onClick={decrement}>
        Decrement
      </button>

      <button onClick={reset}>
        Reset
      </button>
    </div>
  );
}

Now the counter logic is reusable across multiple components.

You can use the same hook anywhere in your application without rewriting the logic again.

When Should You Create a Custom Hook?

Not every repeated line of code needs a Custom Hook.

A good Custom Hook usually appears when:

You repeat logic across multiple components

Example:

  • API fetching
  • Authentication
  • Form handling
  • Pagination
  • Debouncing
  • Local storage access

Your component becomes too large

If a component contains too much logic, extracting it into hooks improves readability.

Logic is unrelated to UI

UI belongs inside components.

Reusable behavior belongs inside hooks.

Where Custom Hooks Are Commonly Used

Custom Hooks are everywhere in modern React applications.

1. API Requests

useFetch()
useUsers()
useProducts()

2. Authentication

useAuth()

3. Theme Handling

useTheme()

4. Form Management

useForm()

5. Window Resize Detection

useWindowSize()

6. Dark Mode

useDarkMode()

7. Local Storage

useLocalStorage()

Example 3: useLocalStorage Hook

Saving values in local storage is common.

Instead of rewriting the logic everywhere, create a reusable hook.

import { useState } from "react";

function useLocalStorage(key, initialValue) {
  const [value, setValue] = useState(() => {
    const storedValue = localStorage.getItem(key);

    return storedValue
      ? JSON.parse(storedValue)
      : initialValue;
  });

  const saveValue = (newValue) => {
    setValue(newValue);

    localStorage.setItem(
      key,
      JSON.stringify(newValue)
    );
  };

  return [value, saveValue];
}

export default useLocalStorage;

Usage:

function App() {
  const [name, setName] = useLocalStorage(
    "username",
    ""
  );

  return (
    <input
      value={name}
      onChange={(e) => setName(e.target.value)}
    />
  );
}

How Custom Hooks Improve Project Structure

Without hooks, components often become messy.

Example of a bad structure:

components/
 ├── Users.jsx
 ├── Products.jsx
 ├── Dashboard.jsx

Each component contains repeated logic.

With hooks:

src/
 ├── components/
 ├── hooks/
 │    ├── useFetch.js
 │    ├── useAuth.js
 │    ├── useLocalStorage.js

Now logic is centralized and reusable.

Important Difference: Component vs Custom Hook

A lot of developers confuse them.

React Component

  • Returns JSX
  • Handles UI rendering
function Button() {
  return <button>Click</button>;
}

Custom Hook

  • Returns logic/data/functions
  • Does NOT return JSX
function useCounter() {
  return { count, increment };
}

Common Mistakes with Custom Hooks

1. Returning JSX from Hooks

Wrong:

function useModal() {
  return <div>Modal</div>;
}

Hooks should return:

  • state
  • functions
  • values
  • logic

Not UI.

2. Creating Hooks Too Early

Not every logic deserves a hook.

If logic is used only once, keep it inside the component.

3. Massive Hooks

Avoid creating giant hooks that do everything.

Bad:

useDashboardEverything()

Keep hooks focused.

4. Ignoring Dependency Arrays

Hooks using useEffect still require proper dependencies.

Wrong dependencies can create bugs.

Advanced Pattern: Hooks Calling Hooks

One powerful feature is that hooks can use other hooks.

Example:

function useAuth() {
  const [user, setUser] = useState(null);

  useEffect(() => {
    // auth logic
  }, []);

  return user;
}

Another hook can reuse it:

function useAdmin() {
  const user = useAuth();

  return user?.role === "admin";
}

This creates highly modular logic.

Real-World Example

Imagine an e-commerce application.

Without hooks:

  • Every page handles fetching
  • Every component manages loading
  • Authentication logic repeats
  • Cart logic duplicates

With hooks:

useProducts()
useCart()
useAuth()
useOrders()
useWishlist()

Everything becomes organized and reusable.

Are Custom Hooks Required?

No.

React applications can work without them.

But as projects grow, Custom Hooks become one of the best ways to keep code maintainable and scalable.

Most modern React applications use them heavily.

Best Practices for Writing Custom Hooks

Keep One Responsibility

Good:

useFetch()

Bad:

useFetchAndThemeAndAuth()

Use Clear Names

Hook names should describe behavior.

Good:

useWindowSize()
useDarkMode()

Return Useful Data

Hooks should expose only what components need.

Handle Errors Properly

Especially in API hooks.

Avoid Unnecessary Re-renders

Use optimization carefully when needed.

Final Thoughts

Custom Hooks are one of React’s cleanest and most practical features.

They help you:

  • Reuse logic
  • Reduce duplication
  • Keep components clean
  • Improve maintainability
  • Build scalable applications

The best way to understand Custom Hooks is to start noticing repeated logic in your own components.

Whenever you find yourself copying the same state management or effect logic multiple times, that’s usually a sign that a Custom Hook could help.

And once you start using them properly, your React code becomes significantly cleaner, easier to manage, and far more reusable.

Conclusion

That’s it for Episode 9 of the “Let’s Master React Hooks Together” series.

In this episode, we explored one of the most practical concepts in React — Custom Hooks — and understood how they help create reusable, clean, and maintainable applications.

We learned:

  • What Custom Hooks are
  • Why React introduced them
  • How to create them
  • When to use them
  • Real-world use cases
  • Best practices and mistakes to avoid

More importantly, we saw how Custom Hooks help separate logic from UI, making React applications much easier to scale and maintain.

As you continue building React projects, you’ll start noticing repeated patterns everywhere. That’s the perfect opportunity to create your own hooks and make your codebase cleaner and smarter.

In the next episode, we’ll continue exploring more advanced React concepts and patterns to strengthen your React development skills step by step.

See you in the next episode of
“Let’s Master React Hooks Together.”

What are your goals this week? #139

What are your goals for the week?

  • What are you building this week?
  • What do you want to learn?
  • What events are you attending this week?

This Week’s Goals.

  • Job Search.
    • Network
    • Apply
  • Project work.
    • Content for side project.
    • Work on my own project.
    • Send follow up email for content for client’s site.
  • Content & Project Calendar for May.
  • Blog
  • Events.
    • Tuesday (virtual) Dallas Software Developers.
    • Wednesday School event.
  • Run a goal setting thread on Virtual Coffee(VC) Slack.
  • Process pics from Ren Faire.

How I did last week.

  • Job Search.
    • ✅ Network
    • Apply
  • Project work.
    • * ✅ Content for side project.
    • * ✅Work on my own project.
    • * ✅ Send follow up email for content for client’s site.
  • * ✅ Content & Project Calendar for May.
  • * ✅ Blog
  • Events.
    • ❌ Thursday Dads in Tech. Postponed
  • * ✅ Run a goal setting thread on Virtual Coffee(VC) Slack.
  • * ✅ Process pics from Ren Faire.

Your turn, what do you plan to do this week?

  • What are you building this week?
  • What do you want to learn?
  • What events are you attending this week?

Cover image is my LEGO photography. It’s Daffy Duck working at a desktop computer. In the background is a mini rubber duck.

-$JarvisScript git commit -m "edition 179"

I Dusted Off a 6-Year-Old Java Project and Ran Snyk Against It — Here’s What I Found

The README said “implementing security best practices.”

That line has been sitting in the pgmpofu/mflix repository since 2019. A MongoDB-backed movie browsing application with user registration, authentication, JWT-based sessions, and full CRUD operations. Built as part of a MongoDB University course. Described, in my own words, as implementing security best practices.

I ran Snyk against it last week.

188 vulnerabilities. 10 Critical. 99 High. 59 Medium. 20 Low.

Every single one fixable. None of them there when I wrote that README.

This is the first article in a series about what happens when you apply modern software composition analysis to a Java project that hasn’t been touched in six years — what Snyk found, what I fixed, what I chose not to fix, and what the before-and-after security posture actually looks like in measurable terms.

What the Project Is

MFlix is a Spring Boot Java application backed by MongoDB. The core functionality:

  • Movie search — basic and complex queries against a MongoDB collection
  • User registration and authentication
  • JWT-based session management using io.jsonwebtoken:jjwt
  • Comment posting on movie entries
  • Analytical reporting against the movie dataset
  • Spring Security for access control
    It’s not a toy. It has real authentication flows, real database operations, and real dependency complexity. The pom.xml has eight direct dependencies spanning Spring Boot, Spring Security, the MongoDB Java driver, and the JWT library.

That dependency tree is where the story starts.

The Dependency Snapshot — What Was In the pom.xml

Before running anything, here’s exactly what the project declared as of the last commit in 2019:

<dependency>
    <groupId>org.springframework.boot</groupId>
    <artifactId>spring-boot-starter-web</artifactId>
    <version>2.0.3.RELEASE</version>
</dependency>

<dependency>
    <groupId>org.springframework.boot</groupId>
    <artifactId>spring-boot-starter-security</artifactId>
    <version>2.0.4.RELEASE</version>
</dependency>

<dependency>
    <groupId>org.springframework.boot</groupId>
    <artifactId>spring-boot</artifactId>
    <version>2.0.4.RELEASE</version>
</dependency>

<dependency>
    <groupId>org.springframework</groupId>
    <artifactId>spring-context</artifactId>
    <version>5.0.7.RELEASE</version>
</dependency>

<dependency>
    <groupId>org.springframework</groupId>
    <artifactId>spring-core</artifactId>
    <version>5.0.7.RELEASE</version>
</dependency>

<dependency>
    <groupId>org.springframework</groupId>
    <artifactId>spring-web</artifactId>
    <version>5.0.7.RELEASE</version>
</dependency>

<dependency>
    <groupId>io.jsonwebtoken</groupId>
    <artifactId>jjwt</artifactId>
    <version>0.9.1</version>
</dependency>

<dependency>
    <groupId>org.mongodb</groupId>
    <artifactId>mongodb-driver-sync</artifactId>
    <version>3.9.1</version>
</dependency>

Eight direct dependencies. All declared at versions that were current in mid-2018 to mid-2019. All untouched since.

The Java compiler target is 1.8 — Java 8, which reached end of life for free Oracle support in January 2019. The project has been running on a deprecated runtime configuration since approximately the month it was committed.

Running the Scan

Setup is straightforward. With Snyk installed and authenticated:

cd mflix
snyk test --all-projects

Snyk reads the pom.xml, resolves the full dependency tree including transitive dependencies, and cross-references every package version against its vulnerability database.

The result appeared in seconds. The dashboard view told the story immediately:

10 Critical · 99 High · 59 Medium · 20 Low

Total: 188 fixable vulnerabilities. Zero with no supported fix.

That last number — zero unfixable — is actually significant. Every single vulnerability Snyk found has a known fix available. I’ll come back to what that means for the remediation strategy.

The Finding That Stopped Me Cold

Before getting into the full breakdown, one finding deserves immediate attention.

org.springframework:[email protected] — Remote Code Execution. CVSS 9.8. Priority Score 919.

The vulnerability is in [email protected] via CWE-94 — improper control of code generation. An attacker who can reach the application can, under certain conditions, execute arbitrary code on the server.

CVSS 9.8. That’s not a theoretical risk category. That’s one point below the maximum possible score. That’s the kind of finding that, in a production system, triggers an emergency change control process at 11pm on a Friday.

MFlix was never deployed to production. The attack surface was always zero. But the finding is real — the vulnerability exists in the version of spring-beans that ships with [email protected], and it would be exploitable if the application were running and accessible.

This is the finding that “security best practices” in the README was supposed to prevent. It didn’t — not because of negligence, but because security best practices in 2019 didn’t include the CVE that was disclosed after the code was written.

The Full Breakdown by Dependency

Here’s what Snyk found grouped by the dependency it originated from, with priority scores and headline vulnerability types:

Critical Severity (Priority Score 919)

org.springframework:[email protected]
11 direct issues, 8 transitive issues. The highest-priority dependency in the scan.

  • Remote Code Execution — CWE-94, CVSS 9.8 (via spring-beans)
  • Privilege Escalation — CWE-264, CVSS 4.4
  • Improper Input Validation — CWE-20, CVSS 8.6
  • Reflected File Download — CWE-494, CVSS 8.0
  • Denial of Service — CWE-400, CVSS 3.7
    org.springframework:[email protected]
    2 direct issues, 11 transitive issues.
  • Remote Code Execution — CWE-94, CVSS 9.8 (via spring-beans)
  • Relative Path Traversal — CWE-23, CVSS 8.2
  • Incorrect Authorization — CWE-863, CVSS 8.7
    org.springframework.boot:[email protected]
    37 transitive issues.
  • Authorization Bypass — CWE-285, CVSS 8.2
  • Reflected File Download — CWE-494, CVSS 8.0
  • Improper Input Validation — CWE-20, CVSS 8.6
    org.springframework.boot:[email protected]
    206 transitive issues — the single dependency pulling in the most downstream vulnerabilities.
  • Insecure Defaults via [email protected] — CWE-453, CVSS 9.8
  • Deserialization of Untrusted Data via [email protected] — CWE-502, CVSS 9.2
  • Session Fixation via tomcat-embed-core — CWE-384, CVSS 3.1
  • Cross-Site Scripting via tomcat-embed-core — CWE-79, CVSS 3.5
    io.jsonwebtoken:[email protected] — Priority Score 889
    63 transitive issues, 58 fixable. All fixed in a single upgrade to version 0.12.0.
  • Deserialization of Untrusted Data via [email protected] — CWE-502, CVSS 9.2
  • Allocation of Resources Without Limits via jackson-core — CWE-770, CVSS 8.x
    ### Critical — Certificate Validation

org.springframework.boot:[email protected]

  • Improper Validation of Certificate with Host Mismatch — CWE-297, CVSS 9.3
    This one matters specifically because MFlix handles user authentication. A TLS certificate validation bypass in the autoconfigure layer means a connection claiming to be a trusted service could potentially be impersonated without detection.

High Severity (Priority Score 649)

org.springframework.boot:[email protected]
4 direct issues, 7 transitive.

  • Insecure Temporary File — CWE-377, CVSS 7.8
  • Incorrect Authorization — CWE-863, CVSS 8.7
    org.springframework:[email protected]
    5 direct issues.
  • Incorrect Authorization — CWE-863, CVSS 8.7
  • Improper Case Sensitivity Handling — CWE-178, CVSS 2.3
    ### Medium Severity

org.mongodb:[email protected]
1 direct issue.

  • Man-in-the-Middle — CWE-300, CVSS 6.4
    The MongoDB driver finding is particularly relevant for this application. MFlix connects to a MongoDB Atlas cluster. A MitM vulnerability in the driver layer means the connection between the application and the database could potentially be intercepted.

The Transitive Dependency Problem

The number that tells the real story of legacy Java dependency management is this one:

[email protected] — 206 transitive issues.

One line in the pom.xml. One version declaration. 206 downstream vulnerabilities pulled in through the dependency chain, in packages the application never explicitly imported and whose version numbers never appeared in the build file.

This is the fundamental challenge of Software Composition Analysis in Java projects. The pom.xml has eight dependencies. The actual dependency graph has dozens of packages. Each of those packages has its own version, its own CVE history, its own patch cadence.

A developer in 2018 who wrote [email protected] made a single decision. That decision pulled in a specific version of Tomcat, a specific version of Jackson, a specific version of Spring’s core libraries — all of which have accumulated vulnerabilities over six years. None of those vulnerabilities were visible at the point of the original decision.

This is why dependency scanning exists. The alternative — manually tracking CVE disclosures across every transitive dependency in your build graph — is not a realistic approach for any team at any scale.

The Exploit Maturity Breakdown

Not all 188 findings carry the same actual risk. Snyk’s exploit maturity classification tells a more nuanced story:

Maturity Level Count
Mature exploits (working exploit code exists) 8
Proof-of-concept exploits 43
No known exploit 137

Eight findings have working, publicly available exploit code. These are the ones that require the most urgent remediation — not because the vulnerability is necessarily more severe than others, but because the barrier to exploitation is effectively zero. Anyone with the exploit code and network access to the application could use it.

The 137 findings with no known exploit are real vulnerabilities — they’re in the CVE database, they have CVSS scores, Snyk flags them correctly — but the practical attack risk is lower because exploitation requires custom effort rather than running a public tool.

This breakdown becomes critical for article 4, where I’ll explain which findings I remediated, which I suppressed, and why the exploit maturity classification was the primary factor in that decision.

What “100% Fixable” Actually Means

One number that surprised me when I first saw the Snyk output: 188 fixable, 0 with no supported fix.

That’s unusually clean. In my experience scanning production Java codebases at work, there are almost always some findings in the “no supported fix” category — typically because a vulnerable package has no patched version available, or because the fix requires changes that would break the API the application depends on.

MFlix having 100% fixable findings is partly a function of how old the dependencies are. Six years is a long time. Every major vulnerability that exists in Spring Boot 2.0.x, Spring 5.0.x, and jjwt 0.9.1 has had years to be patched in subsequent versions. The fix exists — I just have to apply it.

The question is how straightforward “applying the fix” actually is. Some of these are minor version bumps. Others are major version upgrades — Snyk recommends going from [email protected] to 2.0.6 for some fixes and all the way to 3.x for others. Major version upgrades in Spring Boot involve breaking API changes that require code modifications, not just version bumps.

That complexity is what articles 4 and 5 are about. The 100% fixability rate is the theoretical ceiling. The practical remediation story is considerably more interesting.

The Irony of the README

I want to return to that line. “Implementing security best practices.”

It was accurate in 2019. I used parameterised queries for MongoDB operations. I implemented JWT authentication correctly for the era. I used Spring Security for access control. I followed the MongoDB University course’s security guidance.

None of that is what Snyk found. What Snyk found is a different category of security problem entirely — not vulnerabilities in the code I wrote, but vulnerabilities in the dependencies I imported. The distinction matters because it reveals a gap in how most developers think about application security.

When developers think about writing secure code, they think about SQL injection, authentication flows, authorisation checks, input validation. These are code-level concerns. A skilled developer can learn them, apply them consistently, and write code that is largely free of them.

Software composition vulnerabilities are different. They accumulate silently. They appear in packages you didn’t write and may never read. They arrive via CVE disclosures months or years after you made your dependency choices. They require an ongoing process — not a one-time skill — to manage.

The “security best practices” that prevent code-level vulnerabilities are largely different from the “security best practices” that prevent composition vulnerabilities. Both matter. Until I ran this scan, I was only thinking about one of them.

What Comes Next

Over the next six articles in this series, I’ll document:

Article 2 — Modernising the project structure: wrapping the legacy code in a current Spring Boot shell, what changed, and what had to change before Snyk could even give me a useful remediation path.

Article 3 — The full unfiltered Snyk results: a deeper dive into the most significant findings with full CVE context, what each vulnerability actually enables an attacker to do, and which ones matter most for an application with user authentication and database access.

Article 4 — Why I suppressed some findings and fixed others: the risk assessment framework, the role of exploit maturity in prioritisation, and the findings I made a documented decision to accept.

Article 5 — The remediation work itself: the easy version bumps, the breaking changes that required code modification, and the one dependency upgrade that took four attempts to get right.

Article 6 — Before and after metrics: what changed, how to measure security posture improvement, and what the numbers look like when you present them to an engineering team.

Article 7 — Using AI to assist with remediation: what worked, what didn’t, and the difference between AI suggestions and Snyk recommendations on the same vulnerabilities.

The repository is at github.com/pgmpofu/mflix. The pom.xml in the current state is exactly as it was in 2019. The Snyk findings are real. The remediation work is ongoing.

Next article: modernising the project — what a 2019 Spring Boot structure looks like compared to what a current one should look like, and what had to change before the security work could begin in earnest.

[k8s] Step-By-Step Guide: Installing Nginx Ingress on K3s Pi 4 Cluster

In our previous article, we successfully set up a k3s Pi cluster. We will now build upon that foundation. Let’s dive in!

  • pi-master: 192.168.1.85 (Running Pi OS Lite 64Bit)
  • pi-node-1: 192.168.1.86 (Running Pi OS Lite 64Bit)
  • pi-node-2: 192.168.1.87 (Running Pi OS Lite 64Bit)

Router Port Forwarding Setup.

In order to make the internal applications accessible via the internet, we need to set up port forwarding on our router.
This routing process will redirect internet requests coming to ports 80 and 443 to our master private IP node (192.168.1.85).

Please note, the configuration interface may vary among different routers. Nonetheless, most broadband routers should offer the same functionality pertaining to port forwarding.

Here are my current router settings.

Nginx installation

We’re going to start by installing Nginx on our cluster. In the following guide, we will illustrate how to set up and run Nginx on K3s.
At its core, Nginx will listen to inbound requests on the master node’s IP address and subsequently forward these requests to the services operating within our cluster.

pi-cluster-nginx-diagram

1. Config Ip address

Helm charts come with a file called values.yaml which contains the default configuration values.
We can override these values by creating your own values.yaml file. Here is an example:

# Refer to line 434 here for details
# https://github.com/kubernetes/ingress-nginx/blob/main/charts/ingress-nginx/values.yaml

controller:
  service:
    # Our primary node ip address here.
    # Do remember replacing this ip address with your once accordingly.
    loadBalancerIP: "192.168.1.85"

2. Download the Helm chart:

Download the Nginix helm chart. You can do this by adding the Nginx repo to the Helm. Run the following commands:

helm repo add ingress-nginx https://kubernetes.github.io/ingress-nginx
helm repo update

3. Create namespace

kubectl create namespace nginx-ingress

4. Install the Helm chart:

Now you can install the Helm chart using your custom values.yaml file to override the default configuration values. Run the following command:

helm install nginx ingress-nginx/ingress-nginx --values values.yaml -n nginx-ingress

5. Verify nginx pod:

After installed successfully, we should be able to find a pod running there:
nginx-installed-successfully.png

Nginx Verification

1. Deploy the echo application:

You can deploy an echo server application using a simple Kubernetes deployment and service.
The echo server will respond with the same request it receives.

Here is a sample YAML file you can use:

apiVersion: apps/v1
kind: Deployment
metadata:
  name: echo-deployment
  namespace: default
spec:
  replicas: 1
  selector:
    matchLabels:
      app: echo
  template:
    metadata:
      labels:
        app: echo
    spec:
      containers:
        - name: echo
          image: ealen/echo-server
          ports:
            - containerPort: 80
---
apiVersion: v1
kind: Service
metadata:
  name: echo-service
  namespace: default
spec:
  ports:
    - port: 80
  selector:
    app: echo

Save this YAML into a file, let’s say echo-app.yaml, and apply it to default namespace (using default namespace in Production is not recommended):

kubectl apply -f echo-app.yaml -n default
  1. Create an ingress rule:

Now that your echo server is running, you can create an ingress rule to route traffic to it.

Here is a sample ingress YAML:

apiVersion: networking.k8s.io/v1
kind: Ingress
metadata:
  name: echo-ingress
  namespace: default
spec:
  ingressClassName: nginx
  rules:
    # Replace the domain below with your domain accordingly.
    - host: echo.drunkcoding.net
      http:
        paths:
          - pathType: Prefix
            path: "/"
            backend:
              service:
                name: echo-service
                port:
                  number: 80

3. Update your domain DNS

To ensure you can access from the internet, you need to point a domain to your public address.

Here is my drunkcoding.net DNS configuration on Cloudflare for reference purposes.
drunkcoding-cloudflare-dns.png

After all these configurations now we should be able to access your application hosting on our k3s cluster from the internet.
When accessing to http://echo.drunkcoding.net you able to see the JSON response from the echo pod as below.

echo-app-response.png

Thank You

Thank you for taking the time to read this guide! I hope it has been helpful, feel free to explore further, and happy coding! 🌟✨

Steven | GitHub