Building a Production‑Ready SQL Evaluation Engine with Grok

Why You Need an Evaluation Engine for Text‑to‑SQL

Every time I ask a language model to translate a natural‑language request into SQL, the first thing that comes back is a candidate query.

If you’re building a product that powers analytics dashboards, billing reports or ad‑tech queries, a single wrong join can cost millions, and a missing filter could expose sensitive data.

I spent months sifting through hundreds of generated queries to find subtle bugs—wrong aggregation, omitted columns, or even the dreaded Cartesian product. The solution? A two‑layer evaluation framework that combines fast deterministic checks with an AI judge that explains why something is wrong and how to fix it.

Below I’ll walk you through the core ideas, show you the production‑ready code (no dashboards or storage needed), and explain how you can plug this into your existing workflow.

TL;DR – Build a deterministic 80/20 checker + an LLM “judge” that returns JSON with missing elements, root causes, and a corrected SQL. Run it asynchronously over hundreds of queries for real‑time quality control.

The Architecture in a Nutshell

User Query → Expected SQL (ground truth) 
            │
            ▼
LLM‑generated SQL ──► 1️⃣ Deterministic Evaluator  
                         │
                         ▼
                 Pass? ──> Yes → Return scores only  
                       No  → Trigger 2️⃣ LLM Judge
  • Layer 1 – Fast, deterministic checks that run in < 1 s per query.

    • Row‑count match, column coverage, basic AST similarity, filter presence, aggregation fidelity.
  • Layer 2 – AI‑driven “judge” that:

    • Compares the two SQL strings with a chain‑of‑thought prompt.
    • Produces a JSON object: semantic score, missing elements, root cause, suggested fix.

The whole thing is pure Python; you can drop it into any CI pipeline or batch process.

Layer 1 – The Deterministic Core (80/20)

Below is the minimal yet powerful implementation that covers all the high‑impact metrics:

# deterministic_evaluator.py
import pandas as pd
from sqlglot import parse_one, exp

def get_tables(ast: exp.Expression) -> set:
    """Return a set of table names referenced in an AST."""
    return {t.this for t in ast.find_all(exp.Table)}

def evaluate_80_20(
    expected_sql: str,
    llm_sql: str,
    expected_df: pd.DataFrame,
    llm_df: pd.DataFrame
) -> dict:
    scores = {}

    # 1️⃣ Row Count Match
    scores["row_count_match"] = len(expected_df) == len(llm_df)
    scores["row_delta"] = abs(len(expected_df) - len(llm_df))
    scores["row_delta_pct"] = scores["row_delta"] / max(1, len(expected_df))

    # 2️⃣ Column Coverage
    exp_cols, llm_cols = set(expected_df.columns), set(llm_df.columns)
    scores["column_coverage"] = len(exp_cols & llm_cols) / len(exp_cols) if exp_cols else 0
    scores["missing_columns"] = list(exp_cols - llm_cols)
    scores["extra_columns"]   = list(llm_cols - exp_cols)

    # 3️⃣ Result Set Match (order‑insensitive)
    try:
        exp_sorted = expected_df.sort_values(by=list(expected_df.columns)).reset_index(drop=True)
        llm_sorted  = llm_df.sort_values(  by=list(llm_df.columns)).reset_index(drop=True)
        scores["result_exact_match"] = exp_sorted.equals(llm_sorted)
    except Exception:
        scores["result_exact_match"] = False

    # 4️⃣ Basic Structural Match via AST
    try:
        ast_exp = parse_one(expected_sql, read="postgres")
        ast_llm = parse_one(llm_sql,   read="postgres")

        scores["tables_match"]   = get_tables(ast_exp) == get_tables(ast_llm)
        scores["where_present"]  = bool(ast_exp.args.get("where")) == bool(ast_llm.args.get("where"))
        scores["group_by_match"] = str(ast_exp.args.get("group")) == str(ast_llm.args.get("group"))
    except Exception:
        scores.update({
            "tables_match": False,
            "where_present": False,
            "group_by_match": False
        })

    # 5️⃣ Simple Filter Check (presence of WHERE)
    scores["filter_match"] = ("WHERE" in expected_sql.upper()) == ("WHERE" in llm_sql.upper())

    # 6️⃣ Aggregation Presence
    agg_funcs = {"COUNT", "SUM", "AVG", "MAX", "MIN"}
    scores["has_aggregation"] = any(func in expected_sql.upper() for func in agg_funcs)

    # Weighted overall score (you can tweak weights)
    weights = {
        "row_count_match": 0.25,
        "column_coverage": 0.20,
        "result_exact_match": 0.30,
        "tables_match": 0.10,
        "group_by_match": 0.05,
        "filter_match": 0.05
    }
    overall = sum(scores[k] * w for k, w in weights.items() if isinstance(scores[k], bool))
    scores["overall_score"] = round(overall, 2)
    scores["verdict"] = (
        "PASS" if overall >= 0.9 else
        "PARTIAL" if overall >= 0.7 else
        "FAIL"
    )
    return scores

Why this works

  • Row count & column coverage catch the most common bugs (missing filters, wrong joins).
  • AST checks ensure you’re selecting from the right tables and applying the same grouping logic.
  • The weighted score gives you a quick pass/fail flag that can be used to gate deeper analysis.

Layer 2 – The AI Judge

When the deterministic layer flags anything below your threshold, we hand the case over to an LLM acting as a “debugger.”

The prompt is deliberately structured: it receives the user query, schema, both SQLs, and sample result rows. It then outputs only JSON with:

  1. Semantic score (0‑100).
  2. Missing elements (e.g., filter: status='ACTIVE').
  3. Extra or wrong elements.
  4. Root cause hypothesis.
  5. Suggested corrected SQL.
# llm_judge.py
import json
from litellm import acompletion

JUDGE_PROMPT = """
You are an expert SQL analyst and debugger with 15+ years of experience in enterprise data warehouses.

Task: Deeply compare the **Expected SQL** (ground truth) with the **LLM-generated SQL**.
User natural-language query: {user_query}

Database Schema (full DDL):
{schema_ddl}

Expected SQL (ground truth):
{expected_sql}

LLM-generated SQL:
{llm_sql}

Expected Result (first 10 rows as CSV):
{expected_sample_csv}

LLM Result (first 10 rows as CSV):
{llm_sample_csv}

Row count — Expected: {exp_rows} | LLM: {llm_rows}
Columns — Expected: {exp_cols} | LLM: {llm_cols}

Evaluate using this exact rubric. Think step-by-step.

1. **Semantic Correctness** (0-100): How well does the LLM SQL answer the user query compared to the expected SQL?
2. **What is MISSING?** List every important element present in Expected but absent/mis‑implemented in LLM SQL.
3. **What is EXTRA or WRONG?** List anything in LLM SQL that should not be there or is incorrect.
4. **Root Cause Hypothesis**: Why might the LLM have made these mistakes given the original prompt?
5. **Suggested Fix**: Provide a complete, corrected SQL that would pass all checks. Make minimal changes possible while fully matching the expected semantics.

Return ONLY valid JSON (no markdown):
{{
  "semantic_score": integer 0-100,
  "missing_elements": [...],
  "extra_or_wrong_elements": [...],
  "root_cause": "...",
  "suggested_improved_sql": "...",
  "overall_verdict": "PASS | PARTIAL | FAIL",
  "explanation": "concise paragraph"
}}
"""
async def run_judge(
    user_query: str,
    schema_ddl: str,
    expected_sql: str,
    llm_sql: str,
    exp_sample_csv: str,
    llm_sample_csv: str,
    exp_rows: int,
    llm_rows: int,
    exp_cols: str,
    llm_cols: str
) -> dict:
    prompt = JUDGE_PROMPT.format(
        user_query=user_query,
        schema_ddl=schema_ddl,
        expected_sql=expected_sql,
        llm_sql=llm_sql,
        expected_sample_csv=exp_sample_csv,
        llm_sample_csv=llm_sample_csv,
        exp_rows=exp_rows,
        llm_rows=llm_rows,
        exp_cols=exp_cols,
        llm_cols=llm_cols
    )
    response = await acompletion(
        model="claude-3-5-haiku-20241022",  # cheap yet powerful
        messages=[{"role": "user", "content": prompt}],
        temperature=0.1,  # deterministic
        max_tokens=800,
    )
    content = response.choices[0].message.content.strip()
    return json.loads(content)

Why this works

  • The prompt forces the LLM to think step‑by‑step and produce structured JSON, making downstream parsing trivial.
  • By feeding sample rows (just 10) you avoid leaking sensitive data while still giving context for the judge.
  • Using a cheap model keeps per‑query cost under $0.01–$0.02.

Putting It All Together – Batch Runner


python
# batch_evaluator.py
import asyncio
from deterministic_evaluator import evaluate_80_20
from llm_judge import run_judge

async def evaluate_case(case: dict, semaphore: asyncio.Semaphore) -> dict:
    async with semaphore:
        det_scores = evaluate_80_20(
            case["expected_sql"],
            case["llm_sql"],
            case["expected_df"],
            case["llm_df"]
        )

        if det_scores["overall_score"] >= 0.92:
            return {**case, **det_scores, "judge_review": None}

        # Trigger LLM judge
        judge = await run_judge(
            user_query=case["user_query"],
            schema_ddl=case["schema_ddl"],
            expected_sql=case["expected_sql"],
            llm_sql=case["llm_sql"],
            exp_sample_csv=case["expected_df"].head(10).to_csv(index=False),
            llm_sample_csv=case["llm_df"].head(10).to_csv(index=False),
            exp_rows=len(case["expected_df"]),
            llm_rows=len(case["llm_df"]),
            exp_cols=",".join(case["expected_df"].columns),
            llm_cols=",".

Automating Database Branches: PR-Triggered Provisioning, Scheduled Refreshes, and TTL Cleanup in Practice

Auto-Create a Branch When a PR Opens

Your application pipeline is fully automated. A developer runs git checkout -b feature/user-auth, opens a PR, and within minutes a preview environment is live with the new code deployed. The PR closes and the environment tears down. Nobody had to think about it.

The database didn’t get that memo.

From what I’ve seen across most teams, the developer ends up doing one of three things: pointing their feature branch at a shared staging environment, waiting for someone to manually provision (set up and configure) a fresh instance, or patching together a one-off clone script that nobody else maintains or remembers to update. This isn’t a tooling problem. It’s an automation gap. The database is the one component in the stack that still needs a human to make a decision at every stage of its lifecycle.

The fix is applying the same event-driven (triggered by a specific action, like opening a PR) and schedule-based patterns you already use for application code to your database branches. In this article, I walk through three concrete patterns: PR-triggered branch creation, scheduled refreshes, and TTL-based (TTL, or “time-to-live,” is a rule that automatically deletes something after a set period) cleanup. I’ll show how to wire each one into GitHub Actions using real API calls and shell scripts. These patterns assume a database platform that exposes branch lifecycle operations (create, list, delete) via a REST API. Branching needs to be a core, built-in feature here, not something you’re faking with dump-and-restore (manually exporting and re-importing data).

Pattern 1: Auto-Create a Branch When a PR Opens

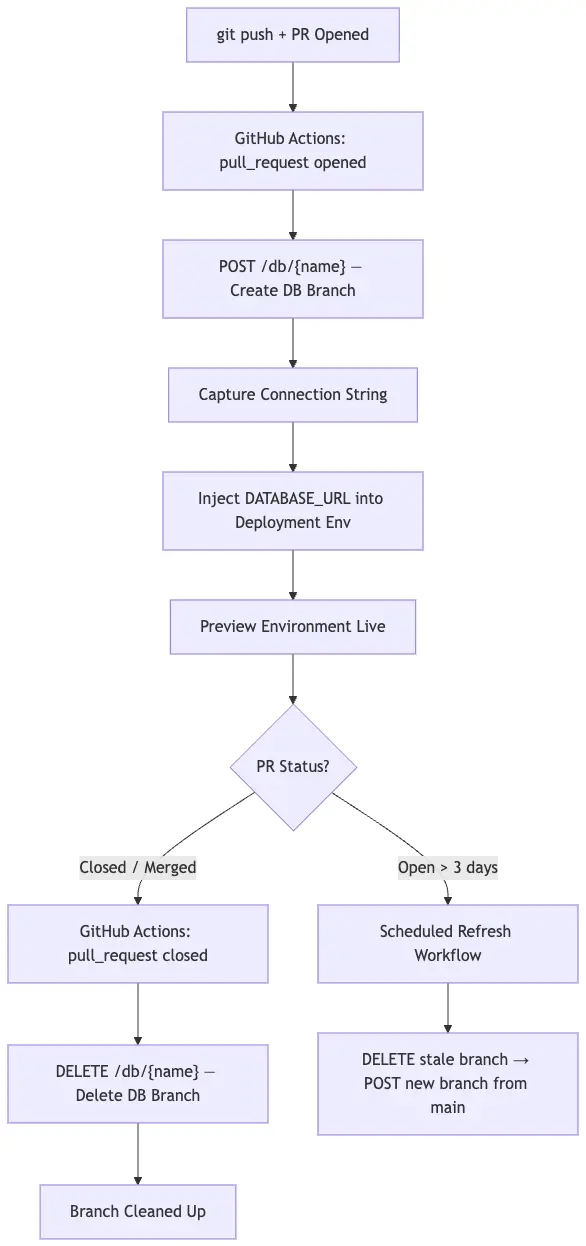
The trigger is pull_request with types [opened, reopened, closed]. The job calls your database API to create a branch named after the PR number, captures the returned connection string, and injects it into the deployment environment. When the PR closes, a second job in the same workflow file deletes the branch. Teardown is not a separate concern — it lives in the same file.

Here’s how the full lifecycle flows:

Auto-Create a Branch When a PR Opens

And here’s the complete GitHub Actions workflow:

name: Database Branch Lifecycle

on:
  pull_request:
    types: [opened, reopened, closed]

env:
  XATA_API_KEY: ${{ secrets.XATA_API_KEY }}
  DB_BRANCH_NAME: pr-${{ github.event.pull_request.number }}
  BASE_URL: https://${{ vars.XATA_WORKSPACE }}.us-east-1.xata.sh/db/${{ vars.XATA_DB }}

jobs:
  create-db-branch:
    if: github.event.action == 'opened' || github.event.action == 'reopened'
    runs-on: ubuntu-latest
    outputs:
      connection_string: ${{ steps.create.outputs.connection_string }}
    steps:
      - name: Create database branch
        id: create
        run: |
          HTTP_STATUS=$(curl -s -o /tmp/response.json -w "%{http_code}" -X POST 
            -H "Authorization: Bearer $XATA_API_KEY" 
            -H "Content-Type: application/json" 
            -d '{"from": "main"}' 
            "$BASE_URL:$DB_BRANCH_NAME")

          if [ "$HTTP_STATUS" -eq 409 ]; then
            echo "Branch already exists — fetching existing connection string"
          elif [ "$HTTP_STATUS" -ne 201 ]; then
            echo "Branch creation failed: $HTTP_STATUS"
            cat /tmp/response.json
            exit 1
          fi

          CONN=$(cat /tmp/response.json | jq -r '.databaseURL')
          echo "connection_string=$CONN" >> $GITHUB_OUTPUT

      - name: Inject connection string into deployment environment
        env:
          GH_TOKEN: ${{ secrets.GITHUB_TOKEN }}
        run: |
          gh secret set DATABASE_URL 
            --env "pr-${{ github.event.pull_request.number }}" 
            --body "${{ steps.create.outputs.connection_string }}"

  delete-db-branch:
    if: github.event.action == 'closed'
    runs-on: ubuntu-latest
    steps:
      - name: Delete database branch
        run: |
          curl -s -X DELETE 
            -H "Authorization: Bearer $XATA_API_KEY" 
            "$BASE_URL:$DB_BRANCH_NAME"

Xata exposes branch lifecycle operations (create, delete, list) as first-class REST endpoints, which is what makes the curl-based approach here work without any additional tooling. The POST to create and DELETE to remove are the only two calls the PR lifecycle needs. The 409 handling is already in the creation step, making the job safe to re-run.

Branch from main or from a production snapshot?

Branching from main gives you the current schema plus your seeded test data — predictable, fast, zero PII risk. Branching from a recent production snapshot gives you realistic data volume and distribution, which matters when you’re testing query plans, pagination behavior, or anything that scales with row count. For feature branches doing schema changes, main is usually sufficient. For branches that touch performance-sensitive paths, the snapshot is worth the extra setup.

GitLab CI Equivalent

If you’re on GitLab, the trigger is $CI_PIPELINE_SOURCE == "merge_request_event". The API calls are identical — only the event context variables change in this case:

create-db-branch:
  stage: setup
  script:
    - |
      curl -s -X POST 
        -H "Authorization: Bearer $XATA_API_KEY" 
        -H "Content-Type: application/json" 
        -d '{"from": "main"}' 
        "https://$XATA_WORKSPACE.us-east-1.xata.sh/db/$XATA_DB:mr-$CI_MERGE_REQUEST_IID"
  rules:
    - if: '$CI_PIPELINE_SOURCE == "merge_request_event"'
      when: on_success

delete-db-branch:
  stage: cleanup
  script:
    - |
      curl -s -X DELETE 
        -H "Authorization: Bearer $XATA_API_KEY" 
        "https://$XATA_WORKSPACE.us-east-1.xata.sh/db/$XATA_DB:mr-$CI_MERGE_REQUEST_IID"
  rules:
    - if: '$CI_MERGE_REQUEST_STATE == "merged" || $CI_MERGE_REQUEST_STATE == "closed"'

All secrets go into GitLab CI/CD variables at the project level — same concept, just a different location.

Pattern 2: Scheduled Refreshes to Keep Branches in Sync

Long-lived feature branches go stale. Schema migrations (changes to the database structure, like adding or renaming columns) land on main every day. After 3 to 4 days, a branch that was created from main no longer reflects what production will actually look like when the PR merges. Tests pass on the outdated branch, then fail on merge. The review environment ends up showing behavior that production won’t reproduce.

The fix is a scheduled workflow that identifies branches older than a configurable threshold and rebuilds them from the latest main snapshot.

name: Refresh Stale Database Branches

on:
  schedule:
    - cron: '0 3 * * *'  # 3am UTC daily

jobs:
  refresh-branches:
    runs-on: ubuntu-latest
    env:
      XATA_API_KEY: ${{ secrets.XATA_API_KEY }}
      BASE_URL: https://${{ vars.XATA_WORKSPACE }}.us-east-1.xata.sh/db/${{ vars.XATA_DB }}
      STALENESS_DAYS: 3
    steps:
      - name: List and refresh stale branches
        run: |
          BRANCHES=$(curl -s 
            -H "Authorization: Bearer $XATA_API_KEY" 
            "$BASE_URL")

          STALE_CUTOFF=$(date -d "-${STALENESS_DAYS} days" -u +%Y-%m-%dT%H:%M:%SZ)

          echo "$BRANCHES" | jq -r --arg cutoff "$STALE_CUTOFF" 
            '.branches[] | select(.name != "main") | select(.createdAt < $cutoff) | .name' 
          | while read -r BRANCH_NAME; do

            echo "Refreshing: $BRANCH_NAME"

            curl -s -X DELETE 
              -H "Authorization: Bearer $XATA_API_KEY" 
              "$BASE_URL:$BRANCH_NAME"

            curl -s -X POST 
              -H "Authorization: Bearer $XATA_API_KEY" 
              -H "Content-Type: application/json" 
              -d '{"from": "main"}' 
              "$BASE_URL:$BRANCH_NAME"

            echo "Done: $BRANCH_NAME"
          done

The jq filter passes $cutoff as a proper variable rather than interpolating it into the query string. This is cleaner and less prone to breaking on dates with unusual formatting.

The PII problem. If your production snapshot contains personal data (PII – personally identifiable information like emails, phone numbers, or addresses), you can’t feed it directly into a branch that’s accessible in CI without first masking it. The right place to do this is between the POST request that creates the branch and the step that hands the connection string over to your deployment environment. The pattern goes: create branch, run a masking or seeding script, then expose DATABASE_URL.

A practical masking step replaces email columns with user-{id}@example.com, phone fields with 555-0100, and anything resembling a name or address with a synthetic equivalent. If building that pipeline isn’t feasible right now, schema-only branches are a reasonable fallback. The branch gets the current database structure but no real records, and a seed script (a script that populates the database with safe, fake data) fills it with synthetic data before the connection string is passed to CI.

Pattern 3: TTL-Based Cleanup for Abandoned Branches

PR-triggered creation has a silent failure mode: PRs that are abandoned rather than formally closed. A developer opens a branch, opens a PR, then the work gets deprioritized. The PR stays open but idle for weeks. The closed event never fires, so the database branch never gets deleted. Branches from merged or closed PRs can also linger if the cleanup step failed silently.

Over time these accumulate. Even on platforms that scale compute to zero, storage accrues on idle branches. A team running 30 active developers with a typical amount of WIP can easily accumulate 50–100 orphaned branches without a cleanup mechanism.

This Bash script handles both cases. It lists all branches older than a configurable TTL and deletes them, with one exception: if the corresponding PR is still open, the branch is left alone. That check protects slow-moving but active PRs from being cleaned up prematurely.

#!/usr/bin/env bash
set -euo pipefail

XATA_API_KEY="${XATA_API_KEY:?XATA_API_KEY is required}"
GITHUB_TOKEN="${GITHUB_TOKEN:?GITHUB_TOKEN is required}"
XATA_WORKSPACE="${XATA_WORKSPACE:?}"
XATA_DB="${XATA_DB:?}"
GITHUB_REPO="${GITHUB_REPO:?}"  # format: owner/repo
TTL_DAYS="${TTL_DAYS:-7}"

BASE_URL="https://${XATA_WORKSPACE}.us-east-1.xata.sh/db/${XATA_DB}"
CUTOFF=$(date -d "-${TTL_DAYS} days" -u +%Y-%m-%dT%H:%M:%SZ)

echo "Checking for branches older than ${TTL_DAYS} days (cutoff: ${CUTOFF})"

BRANCHES=$(curl -s -H "Authorization: Bearer ${XATA_API_KEY}" "${BASE_URL}")

echo "${BRANCHES}" | jq -r --arg cutoff "${CUTOFF}" 
  '.branches[] | select(.name != "main") | select(.createdAt < $cutoff) | .name' 
| while read -r BRANCH_NAME; do

  echo "Evaluating: ${BRANCH_NAME}"

  # Extract PR number — expects format pr-NNN or mr-NNN
  PR_NUM=$(echo "${BRANCH_NAME}" | grep -oE '[0-9]+$' || true)

  if [ -z "${PR_NUM}" ]; then
    echo "  Skipping: cannot parse PR number from '${BRANCH_NAME}'"
    continue
  fi

  PR_STATE=$(curl -s 
    -H "Authorization: Bearer ${GITHUB_TOKEN}" 
    -H "Accept: application/vnd.github+json" 
    "https://api.github.com/repos/${GITHUB_REPO}/pulls/${PR_NUM}" 
    | jq -r '.state // "not_found"')

  if [ "${PR_STATE}" = "open" ]; then
    echo "  Skipping: PR #${PR_NUM} is still open"
    continue
  fi

  echo "  Deleting ${BRANCH_NAME} (PR #${PR_NUM} state: ${PR_STATE})"
  curl -s -X DELETE 
    -H "Authorization: Bearer ${XATA_API_KEY}" 
    "${BASE_URL}:${BRANCH_NAME}"
done

echo "Cleanup complete."

Save this as scripts/db-cleanup.sh and run it on a schedule:

name: Database Branch Cleanup

on:
  schedule:
    - cron: '0 4 * * *'  # 4am UTC daily — runs after the 3am refresh

jobs:
  cleanup:
    runs-on: ubuntu-latest
    steps:
      - uses: actions/checkout@v4
      - name: Run TTL cleanup
        env:
          XATA_API_KEY: ${{ secrets.XATA_API_KEY }}
          GITHUB_TOKEN: ${{ secrets.GITHUB_TOKEN }}
          XATA_WORKSPACE: ${{ vars.XATA_WORKSPACE }}
          XATA_DB: ${{ vars.XATA_DB }}
          GITHUB_REPO: ${{ github.repository }}
          TTL_DAYS: 7
        run: bash scripts/db-cleanup.sh

Hard TTL vs. activity-based TTL

Hard TTL deletes any branch older than N days regardless of PR state. It’s simple and fast, but risks deleting a branch that belongs to a slow-moving but active PR. Activity-based TTL checks whether the PR is still open before deleting, which is safer, but makes one GitHub API call per branch. I’d start with activity-based TTL at 7 days. If you’re running hundreds of branches and the API calls start hitting GitHub’s rate limits (a cap on how many API requests you can make in a given time window), switch to hard TTL at 14 or 21 days.

Wiring the Patterns Together

Now let’s see how you can put it all together.

Connection String Injection

Never put a connection string directly in a workflow file. The right approach is to create a GitHub Actions deployment environment for each PR, named pr-{number}, and scope the DATABASE_URL secret to that environment. When the PR closes and the branch is torn down, the secret is revoked along with it. Your deployment job reads DATABASE_URL from the named environment, keeping credentials scoped to one PR, isolated from others, and automatically cleaned up when no longer needed.

For passing a connection string between jobs in the same workflow run, use job outputs:

jobs:
  create-db-branch:
    outputs:
      db_url: ${{ steps.create.outputs.connection_string }}

  deploy:
    needs: create-db-branch
    environment: pr-${{ github.event.pull_request.number }}
    env:
      DATABASE_URL: ${{ needs.create-db-branch.outputs.db_url }}

Idempotency

The 409 check in Pattern 1 isn’t optional. CI jobs fail and get re-run all the time, whether from a flaky network call, a GitHub-side timeout, or a manual re-trigger. If your branch creation step doesn’t handle a 409 Conflict response (which means the branch already exists) gracefully, every re-run will error out before it even reaches the steps that deploy your code.

Monorepo Considerations

If multiple services share one database, branch creation should still be one-per-PR, not one-per-service. Each service reads from the same branch connection string. Use the create-db-branch job as a dependency and share the output:

jobs:
  create-db-branch:
    outputs:
      db_url: ${{ steps.create.outputs.connection_string }}

  deploy-api:
    needs: create-db-branch
    env:
      DATABASE_URL: ${{ needs.create-db-branch.outputs.db_url }}

  deploy-workers:
    needs: create-db-branch
    env:
      DATABASE_URL: ${{ needs.create-db-branch.outputs.db_url }}

The branch name stays pr-{number} regardless of which service file changed. One PR, one database branch, multiple consumers.

Webhook vs. Poll

PR-triggered workflows run on webhooks (notifications that GitHub sends instantly when something happens), so the workflow fires within seconds of a PR opening or closing. Refresh and cleanup workflows run on a schedule instead. This split is intentional. Webhooks give you a near-instant response to lifecycle events. Scheduled polling is the right model for background maintenance where a few minutes’ delay doesn’t matter. Don’t try to make cleanup event-driven. You’ll end up with race conditions (where two processes, like a cleanup job and a creation job, run at the same time and conflict with each other) that scheduled polling avoids entirely.

Data Management Decisions You Need to Make Before You Automate

This is the decision that trips up most teams when they first automate database branching, and it’s worth settling before you write a single YAML line.

Three options for what data goes into a branch:

1. Schema-only with synthetic data

The branch gets the current schema, no records. A seed script runs after creation and populates synthetic data before the connection string is handed to CI. Safe, fast, no PII risk. The downside: synthetic data rarely reflects real-world distributions, which can hide bugs in complex queries, aggregations, or pagination edge cases.

2. Anonymized production snapshot

Realistic data volume and shape, with PII scrubbed before the branch is mounted. This requires a masking pipeline:

capture snapshot → run anonymization → create branch from masked data.

Emails become user-{id}@example.com, names become deterministic fakes, phone numbers become 555-0100. Operationally heavier to set up, but meaningfully better for integration and performance testing.

3. Full production copy

Only appropriate if your infrastructure is fully isolated, your team has explicit compliance approval, and you’ve thought through the access control implications end-to-end. Most teams running CI environments should not do this.

The important thing is to encode this decision in the automation script rather than leaving it to whoever opens a PR. The branch creation job should enforce the data policy automatically, whether that means running a seed script, applying a masking step, or rejecting the operation if the required conditions aren’t met. Individual developers shouldn’t be making this call each time they create a branch.

Xata supports schema-only branch creation via its API, which makes option (a) straightforward to implement without managing snapshot files or dump logistics.

Your Starting Point: A Minimal PR-Triggered Workflow You Can Ship Today

Here’s the complete lifecycle workflow: branch create on open, branch delete on close, in under 30 lines of YAML:

name: DB Branch Lifecycle

on:
  pull_request:
    types: [opened, reopened, closed]

env:
  BRANCH_NAME: pr-${{ github.event.pull_request.number }}
  BASE_URL: https://${{ vars.XATA_WORKSPACE }}.us-east-1.xata.sh/db/${{ vars.XATA_DB }}

jobs:
  manage-db-branch:
    runs-on: ubuntu-latest
    steps:
      - name: Create branch
        if: github.event.action != 'closed'
        run: |
          STATUS=$(curl -s -o /dev/null -w "%{http_code}" -X POST 
            -H "Authorization: Bearer ${{ secrets.XATA_API_KEY }}" 
            -H "Content-Type: application/json" 
            -d '{"from": "main"}' 
            "${{ env.BASE_URL }}:${{ env.BRANCH_NAME }}")
          [ "$STATUS" -eq 201 ] || [ "$STATUS" -eq 409 ] || exit 1

      - name: Delete branch
        if: github.event.action == 'closed'
        run: |
          curl -s -X DELETE 
            -H "Authorization: Bearer ${{ secrets.XATA_API_KEY }}" 
            "${{ env.BASE_URL }}:${{ env.BRANCH_NAME }}"

Four steps to get this running in any repo:

  1. Store your Xata API key as a GitHub Actions secret named XATA_API_KEY
  2. Add XATA_WORKSPACE and XATA_DB as Actions variables — these aren’t sensitive, so variables (not secrets) are appropriate
  3. Commit the workflow file to .github/workflows/db-branch.yml
  4. Open a test PR and verify the branch appears in your database dashboard within the first workflow run

That’s the skeleton. Scheduled refresh, TTL cleanup, and connection string injection each layer on top without modifying the creation logic. Start here, ship it, confirm it works, and add the patterns your specific workflow actually needs.

If you want to explore how Xata structures its branching API, including schema-only branch creation and migration tracking, their documentation covers the full surface: xata.io/docs. Which automation pattern are you tackling first: PR-triggered provisioning, scheduled refresh, or TTL cleanup? Drop your setup in the comments. Edge cases from real pipelines are always welcome.

Codacy vs Coverity: Cloud Quality vs Enterprise SAST

Quick Verdict

Codacy and Coverity are not competing in the same market. This is not a head-to-head battle between two similar tools where one wins on features and the other wins on price. Codacy is a cloud-native developer productivity platform that combines code quality analysis, SAST, SCA, DAST, secrets detection, coverage tracking, and AI-powered code review into a single platform at $15/user/month. Coverity – now part of Black Duck Software (formerly Synopsys Software Integrity Group) – is a deep enterprise static analysis engine purpose-built for safety-critical and mission-critical software, known for its interprocedural, path-sensitive dataflow analysis that catches defects most other tools cannot detect.

The comparison matters because teams evaluating static analysis tools often encounter both names. But choosing between them is less about which is “better” and more about which problem you are actually trying to solve.

Choose Codacy if: you are building web applications, cloud services, or APIs and want a single platform for code quality enforcement, security scanning, coverage tracking, and AI-powered review. You value fast setup, predictable pricing, and developer workflow integration over the deepest possible analysis accuracy. You are not in a regulated industry that requires compliance with MISRA, CERT, or AUTOSAR standards.

Choose Coverity if: you are building safety-critical software – automotive ECU code, avionics systems, medical device firmware, defense applications – where a single undetected defect can have catastrophic consequences. You need the lowest possible false positive rate, interprocedural analysis that tracks data flow across entire codebases, and compliance reporting that maps directly to industry safety standards. You have the budget and engineering resources for enterprise tooling.

If you need both quality and depth: Consider running Codacy for code quality metrics, coverage tracking, and developer workflow integration alongside Coverity for deep defect detection in safety-critical code components. The tools have almost zero overlap and complement each other effectively.

At-a-Glance Feature Comparison

Category Codacy Coverity (Black Duck)
Primary focus Code quality + security platform Deep defect detection + security SAST
Target market Development teams of all sizes Enterprise, safety-critical industries
Analysis approach Multi-engine aggregation (49 languages) Interprocedural path-sensitive dataflow analysis
Analysis depth Broad coverage, moderate depth per language Deep analysis, industry-leading accuracy
False positive rate Varies by engine; some noise on legacy codebases 15-20% (among the lowest in the market)
Languages supported 49 22+ (deepest in C, C++, Java)
SAST Yes (embedded engines) Yes (core capability, deep dataflow analysis)
SCA Yes (Pro plan) Via Black Duck SCA (separate product)
DAST Yes (ZAP-powered, Business plan) Via Black Duck (Polaris platform)
Secrets detection Yes Limited (not primary focus)
AI code review AI Reviewer + AI Guardrails No
Code coverage Yes No
Duplication detection Yes No
Quality gates Customizable thresholds Not applicable (defect-focused)
Compliance reporting OWASP, basic CWE MISRA, CERT, CWE, OWASP, AUTOSAR
IDE integration VS Code, Cursor, Windsurf (Guardrails) VS Code, Visual Studio, IntelliJ, Eclipse (CodeSight)
Git platforms GitHub, GitLab, Bitbucket GitHub, GitLab, Jenkins, Azure DevOps
Cloud deployment Default (cloud-native) Polaris cloud platform (newer)
Self-hosted/on-premises Business plan only Traditional deployment model
Free tier AI Guardrails IDE extension Coverity Scan (open source projects only)
Starting paid price $15/user/month (Pro) ~$500/dev/year (CodeSight); full platform via quote
Setup complexity Under 10 minutes Weeks of configuration and tuning

What Is Codacy

Codacy is a cloud-native code quality and security platform trusted by over 15,000 organizations. It takes a breadth-first approach – rather than building a single deep analysis engine, Codacy embeds multiple third-party analysis engines (ESLint, Pylint, PMD, SpotBugs, Bandit, Gosec, and dozens more) and wraps them in a unified interface that covers 49 programming languages. The platform combines static analysis with SCA (dependency scanning), DAST (on the Business plan), secrets detection, code coverage tracking, duplication detection, and quality gates – all accessible through a single dashboard.

What sets Codacy apart from traditional static analysis tools is its focus on developer experience and AI capabilities. The AI Guardrails IDE extension – free for all developers – scans code in real time within VS Code, Cursor, and Windsurf, catching security and quality issues in both human-written and AI-generated code before it reaches a commit. The AI Reviewer combines deterministic rule-based analysis with context-aware AI feedback on pull requests, drawing context from changed files, PR descriptions, and linked Jira tickets to produce more actionable feedback than purely rule-based tools.

Codacy’s setup is remarkably fast. Connect your GitHub, GitLab, or Bitbucket account, select repositories, and analysis begins automatically on the next pull request with no CI/CD pipeline configuration required. This pipeline-less approach eliminates the biggest friction point in adopting code quality tooling, making Codacy accessible to teams without dedicated DevOps resources.

Pricing is straightforward: the Pro plan costs $15/user/month with unlimited scans, repositories, and lines of code. The Business plan adds DAST, the AI Risk Hub, self-hosted deployment, SSO/SAML, and audit logs at custom pricing. For a detailed breakdown, see our Codacy pricing guide.

What Is Coverity

Coverity is the gold standard for static analysis accuracy in safety-critical software development. Originally developed from groundbreaking research at Stanford University and commercialized in 2002, Coverity was acquired by Synopsys in 2014 for $334 million. In October 2024, Synopsys divested its entire application security business to Clearlake Capital and Francisco Partners in a $2.1 billion deal, and the newly independent company was rebranded as Black Duck Software, Inc. Today, Coverity operates under the Black Duck umbrella alongside Black Duck SCA and the Polaris unified cloud platform.

What makes Coverity fundamentally different from tools like Codacy, SonarQube, or Semgrep is the depth of its analysis engine. While most SAST tools rely on pattern matching and basic rule sets, Coverity performs interprocedural, path-sensitive dataflow analysis. This means it tracks data across function boundaries, through complex control flow paths, and across entire codebases to uncover subtle defects that other tools miss entirely. Use-after-free errors, null pointer dereferences buried in rare execution paths, race conditions in multi-threaded code, integer overflow vulnerabilities, resource leaks across exception handling paths – these are the categories of defects that Coverity specializes in finding.

The result is an industry-leading false positive rate of approximately 15-20%, meaning that when Coverity flags a defect, developers trust it because the tool is usually right. This trust factor is critical in safety-critical industries where engineers cannot afford to spend their time triaging noise.

Coverity supports 22 programming languages and over 200 frameworks, though its deepest and most mature analysis capabilities are in C, C++, and Java. It holds a strong reputation in industries subject to functional safety standards – automotive (ISO 26262), aerospace (DO-178C), medical devices (IEC 62304) – and provides built-in compliance checkers for MISRA C/C++, CERT C/C++, CWE Top 25, OWASP Top 10, and AUTOSAR C++14 coding guidelines. Black Duck (formerly Synopsys) has been recognized as a Leader in the Gartner Magic Quadrant for Application Security Testing for eight consecutive years through 2025.

Pricing is enterprise and quote-based. The CodeSight IDE plugin starts at approximately $500/developer/year with a 10-developer minimum. The full enterprise platform requires a custom quote, and costs are considerably higher than mainstream code quality tools. Coverity Scan remains free for qualifying open source projects.

Feature-by-Feature Breakdown

Analysis Depth and Accuracy

This is the dimension where the gap between these two tools is most significant – and also the dimension that matters most when deciding which one you need.

Coverity’s analysis engine uses abstract interpretation and interprocedural dataflow analysis to reason about program behavior across entire codebases. It does not just look at individual lines or functions in isolation – it traces data flow across function calls, through conditional branches, across exception handling boundaries, and through complex control flow graphs involving hundreds of functions. This allows it to detect defects that only manifest under specific combinations of conditions spanning multiple files. A null pointer dereference that only occurs when function A returns a specific error code that causes function B to skip an initialization step that function C depends on – Coverity catches that. Pattern-matching tools do not.

The practical result is a remarkably low false positive rate. Multiple industry benchmarks and user reviews on PeerSpot and G2 place Coverity’s false positive rate in the 15-20% range. For development teams, this translates directly into productivity: when Coverity flags something, engineers investigate it because they trust the tool. Tools with 40-60% false positive rates eventually get ignored, defeating the purpose of static analysis entirely.

Codacy’s analysis approach embeds multiple third-party analysis engines and presents their findings through a unified interface. For Python, it runs Pylint and Bandit. For JavaScript, it runs ESLint and other tools. For Java, it runs PMD, SpotBugs, and related analyzers. Each engine operates independently, and the quality and depth of analysis varies by engine and language. This approach gives Codacy broad coverage across 49 languages, but the depth per language depends on the capabilities of the embedded engine rather than a purpose-built interprocedural analyzer.

Codacy catches the most common and impactful issues effectively – undefined variables, type errors, common security patterns, style violations, and complexity warnings. However, it does not perform the kind of deep interprocedural analysis that finds use-after-free errors, complex race conditions, or data flow vulnerabilities that span dozens of function calls. For web applications and cloud services where these deep defect categories are less common, Codacy’s analysis depth is typically sufficient. For embedded systems, operating systems, firmware, and safety-critical code, it is not.

The key question for your team: Are you building software where a single undetected memory corruption bug or race condition could cause a vehicle to malfunction, an aircraft system to fail, or a medical device to behave unpredictably? If yes, you need Coverity-class analysis. If you are building web applications, APIs, or cloud services where the consequence of a bug is a user-facing error or a service restart, Codacy’s analysis depth is appropriate and its breadth of features delivers more practical value.

Language and Framework Support

Codacy supports 49 programming languages through its multi-engine approach, covering mainstream languages (JavaScript, TypeScript, Python, Java, C#, Go, PHP, Ruby, Kotlin, Swift, Rust), niche languages (Scala, Elixir, Dart, Shell), and infrastructure languages (Terraform, Dockerfile, CloudFormation). The breadth is a significant advantage for polyglot teams or organizations with diverse technology stacks.

Coverity supports 22 programming languages and over 200 frameworks. The language list includes C, C++, Java, C#, JavaScript, TypeScript, Python, Go, Ruby, PHP, Kotlin, Swift, Scala, and Dart. While the count is lower than Codacy’s, the depth of analysis per language is far greater – particularly for C, C++, and Java, where Coverity has decades of engineering investment in language-specific analyzers.

The framework support difference is notable. Coverity supports over 200 frameworks with checkers that understand framework-specific patterns and anti-patterns. Recent Polaris updates have added checkers for frameworks like the scribejava OAuth library and Gorilla web sockets in Go. Codacy’s framework awareness depends on the embedded engines – ESLint with React plugins, for example – but the coverage is less systematic.

For teams working exclusively in modern web stacks (JavaScript/TypeScript, Python, Go, Ruby), both tools provide adequate language coverage. For teams working in C/C++ for embedded or systems programming, Coverity’s depth in those languages is unmatched. For teams using less common languages that Coverity does not support, Codacy’s broader language coverage is the only option.

Developer Workflow Integration

Codacy and Coverity take very different approaches to fitting into the developer workflow, reflecting their different target audiences.

Codacy’s workflow is designed for speed and minimal friction. The platform-less setup means connecting a repository and scanning pull requests within minutes. PR comments appear as inline annotations on specific code lines with severity ratings, descriptions, and AI-powered fix suggestions. Quality gates block non-compliant merges automatically. The AI Guardrails IDE extension provides real-time scanning in VS Code, Cursor, and Windsurf. The AI Reviewer adds context-aware feedback that considers the entire PR, not just individual rule violations. Coverage tracking, duplication detection, and quality dashboards complete the picture – all accessible from a single cloud dashboard with no infrastructure to manage.

Coverity’s workflow is more heavyweight but appropriate for its target environment. The traditional approach involves intercepting the build process – Coverity wraps your build commands (make, gradle, mvn) and captures compilation units to build an internal representation of the codebase. Full analysis runs on nightly or weekly builds of the main branch, with incremental or rapid scans triggered on pull requests. The CodeSight IDE plugin provides real-time scanning in VS Code, Visual Studio, IntelliJ IDEA, and Eclipse. Defects flow into Coverity Connect or the Polaris dashboard for triage, classification, severity assignment, and tracking through resolution.

Black Duck has been modernizing Coverity’s workflow integration. The Rapid Scan Static (Sigma) capability delivers analysis results in under two minutes for pull request checks, making it practical to gate PRs on security findings. The Black Duck Security GitHub App (released August 2025) simplifies repository onboarding. The Polaris cloud platform provides a centralized dashboard for managing SAST, SCA, and DAST results. These improvements narrow the developer experience gap, but Coverity’s setup and configuration still require significantly more effort than Codacy’s.

Setup time comparison: Codacy takes under 10 minutes from signup to first analysis results. Coverity takes weeks of dedicated effort – configuring build interception, installing the analysis engine, setting up defect management, tuning checkers for your codebase, and establishing triage workflows. The Coverity setup overhead is justified for safety-critical environments where analysis accuracy matters more than deployment speed, but it is a significant barrier for teams that want fast time to value.

Compliance and Regulatory Standards

This is one of Coverity’s strongest advantages and one of the clearest differentiators between the two tools.

Coverity provides built-in compliance checkers for a range of industry safety and security standards:

  • MISRA C/C++ – The Motor Industry Software Reliability Association standard for C and C++ in safety-critical embedded systems. Coverity maps its findings directly to specific MISRA rules, producing reports that auditors and certifiers can review during ISO 26262 or IEC 61508 assessments.
  • CERT C/C++ – The SEI CERT Coding Standards for secure coding in C and C++, widely used in defense and government software.
  • CWE Top 25 – The Common Weakness Enumeration top 25 most dangerous software weaknesses.
  • OWASP Top 10 – The Open Web Application Security Project’s top 10 web application security risks.
  • AUTOSAR C++14 – The automotive industry’s C++ coding guidelines for adaptive AUTOSAR platform software.

Compliance reports map findings directly to specific standard rules, making it straightforward to demonstrate regulatory compliance during audits and certification processes. For teams building automotive software under ISO 26262, avionics code under DO-178C, or medical device software under IEC 62304, this capability is not just convenient – it is essential for product certification.

Codacy covers OWASP Top 10 and basic CWE mapping through its security analysis engines, which is sufficient for web application security assessments. However, Codacy does not support MISRA, CERT, AUTOSAR, or other functional safety standards. It does not produce compliance reports suitable for safety certification audits. For teams in regulated industries with audit requirements, this gap eliminates Codacy as a standalone solution for compliance.

The practical implication is clear: if your organization must demonstrate compliance with functional safety or secure coding standards to regulators, auditors, or customers, Coverity’s compliance capabilities are a decisive advantage. If your compliance requirements are limited to OWASP and general security best practices, Codacy’s coverage is adequate.

False Positive Management

False positive rates directly impact developer productivity and tool adoption. A tool that flags 100 issues but 50 are false positives wastes more engineering time than a tool that flags 60 issues with only 10 false positives.

Coverity’s false positive rate of approximately 15-20% is among the lowest in the SAST market. This accuracy stems from its deep analysis engine – because Coverity reasons about program behavior through interprocedural dataflow analysis rather than matching surface-level patterns, it can distinguish between code that actually has a defect and code that merely looks suspicious. Multiple PeerSpot reviewers specifically cite this accuracy as the primary reason they chose Coverity over alternatives. When Coverity flags a defect, the development team investigates it. This trust relationship between the tool and its users is critical for long-term adoption.

Coverity Connect provides sophisticated triage workflows for managing findings. Defects can be classified, assigned to specific developers, marked as intentional or false positive, and tracked through resolution. The triage state persists across analysis runs, so once a finding is reviewed and classified, it does not resurface in future reports. This persistent triage is essential for teams maintaining large codebases over years.

Codacy’s false positive rate varies by language and embedded engine. Well-maintained engines like ESLint and Bandit produce relatively low false positive rates for their respective languages. Less specialized engines may generate more noise, particularly on legacy codebases with unconventional patterns. Some users on G2 report that Codacy can be noisy when first connected to an existing codebase, though the noise decreases as teams configure and tune the analysis profiles.

Codacy allows teams to dismiss individual findings, configure severity thresholds, and customize which engines and rules are active for each repository. Quality gates can be tuned to focus on high-severity issues, reducing the impact of false positives on the merge workflow. However, Codacy does not provide the persistent triage workflows that Coverity Connect offers for systematic defect management over time.

For teams where developer trust in the tool is critical – particularly in safety-critical environments where every finding must be investigated – Coverity’s low false positive rate and triage workflows are a significant advantage. For teams that are comfortable with occasional noise and prefer breadth of coverage over precision, Codacy’s configurable analysis profiles provide adequate control.

Security Scanning Breadth

While Coverity is deeper on SAST, Codacy provides significantly broader security coverage when considering the full spectrum of application security testing.

Codacy’s security coverage includes:

  • SAST – Static analysis for vulnerability patterns across 49 languages using embedded security engines
  • SCA – Dependency scanning for known CVEs in open-source packages (included in Pro plan)
  • DAST – Dynamic application security testing powered by ZAP, testing running applications for runtime vulnerabilities (Business plan)
  • Secrets detection – Scanning for accidentally committed API keys, passwords, tokens, and certificates
  • AI Guardrails – Real-time scanning of AI-generated code for security issues in the IDE

This breadth means a team on Codacy Pro at $15/user/month gets SAST, SCA, and secrets detection in a single platform without additional tooling or licensing. The Business plan adds DAST for end-to-end application security coverage.

Coverity’s security focus is deep SAST. It excels at finding complex security vulnerabilities – injection attacks that span multiple function calls, buffer overflows in rare execution paths, cryptographic weaknesses, authentication bypass patterns – with high accuracy. However, Coverity itself does not include SCA (dependency scanning), DAST, or secrets detection. These capabilities are available through other Black Duck products – Black Duck SCA for dependency scanning and the Polaris platform for unified security management – but they require separate licensing and integration.

The security coverage trade-off is clear: Codacy gives you four security scanning dimensions in one platform at an affordable price. Coverity gives you one dimension – SAST – but at a depth that Codacy cannot match. For web application security where breadth matters (you need to cover code, dependencies, runtime, and secrets), Codacy provides better practical coverage. For safety-critical software where SAST accuracy is paramount, Coverity is the superior choice.

Teams with the most demanding security requirements often pair a deep SAST tool with a broader security platform. Running Coverity for deep defect detection alongside Snyk Code or Semgrep for broader coverage is a common enterprise pattern.

AI Capabilities

This comparison reveals the generational difference between a modern cloud-native platform and a traditional enterprise analysis tool.

Codacy’s AI capabilities are extensive and form a core part of the platform:

  • AI Guardrails – A free IDE extension for VS Code, Cursor, and Windsurf that scans every line of code – both human-written and AI-generated – in real time. Using MCP (Model Context Protocol) technology, Guardrails integrates with AI assistants to catch and auto-remediate security and quality issues before code is committed.
  • AI Reviewer – A hybrid code review engine combining deterministic rule-based analysis with context-aware AI reasoning. It draws context from changed files, PR metadata, and linked Jira tickets to produce feedback that goes beyond individual rule violations.
  • AI Risk Hub (Business plan) – Organizational-level visibility into AI code risk, tracking AI Risk Level based on progress implementing AI safeguards.

Coverity does not include AI code review features. Its analysis engine is entirely deterministic and rule-based, producing auditable, repeatable results. This is not necessarily a weakness in Coverity’s target market – in regulated industries, AI-generated recommendations may not be acceptable for compliance purposes because they are non-deterministic and cannot be audited against a fixed rule set. Safety certification processes require analysis that produces identical results on identical code, which deterministic engines guarantee and AI-based analysis does not.

The practical takeaway: If your team generates significant code through AI assistants and values AI-powered review feedback, Codacy’s AI capabilities are a meaningful advantage. If your team operates in a regulated environment where deterministic, auditable analysis is required, Coverity’s rule-based approach is not just acceptable – it is the correct approach. For teams that want AI-powered review alongside deep static analysis, pairing Coverity with CodeRabbit for AI review is an effective combination.

Pricing Comparison

Codacy Pricing

Plan Price Key Capabilities
Developer (Free) $0 AI Guardrails IDE extension for VS Code, Cursor, Windsurf
Pro $15/user/month Unlimited scans, repos, LOC. SAST, SCA, secrets detection. AI Guardrails + AI Reviewer. Coverage, duplication, quality gates
Business Custom Everything in Pro + DAST, AI Risk Hub, self-hosted option, SSO/SAML, audit logs

Coverity Pricing

Option Price Key Capabilities
Coverity Scan (Open Source) Free Static analysis for open source projects with build quotas
CodeSight IDE Plugin ~$500/dev/year (10-dev min) Real-time SAST in IDE using Rapid Scan engine + Black Duck SCA
Enterprise Platform Custom quote Full deep analysis engine, Coverity Connect, compliance reporting, CI/CD integration
Polaris Cloud Custom quote Unified SaaS dashboard for SAST, SCA, DAST across portfolio

Cost Comparison at Scale

Team Size Codacy Annual Cost Coverity Annual Cost (Estimated) Notes
10 devs (startup) $1,800 (Pro) $5,000+ (CodeSight only) Codacy includes SAST, SCA, quality gates, AI review
20 devs (growth) $3,600 (Pro) $15,000-30,000+ (enterprise) Coverity includes deep SAST only; SCA separate
50 devs (mid-market) $9,000 (Pro) $40,000-75,000+ (enterprise) Codacy’s per-user model is dramatically cheaper
100 devs (enterprise) $18,000 (Pro) $80,000-150,000+ (enterprise) Coverity cost justified only for safety-critical workloads

Key Pricing Observations

The pricing gap is enormous. A 50-developer team on Codacy Pro pays $9,000/year and gets code quality analysis, SAST, SCA, secrets detection, coverage tracking, AI-powered review, and quality gates. A comparable Coverity enterprise deployment for the same team size costs multiple times that amount – and provides only deep SAST without code quality metrics, SCA, DAST, or AI review.

The cost gap is justified in specific contexts. Coverity’s pricing reflects the depth of its analysis engine and the value it delivers in safety-critical environments. Finding a use-after-free bug in automotive firmware before it reaches production can prevent recalls costing millions of dollars. Finding a race condition in avionics code can prevent catastrophic failures. In these contexts, Coverity’s price-per-defect-found is often favorable because its low false positive rate means less wasted engineering time on triage, and the defects it catches are the ones that matter most.

For non-safety-critical software, Coverity’s pricing is difficult to justify. If your team is building web applications, APIs, or cloud services, the category of deep defects that Coverity excels at finding (memory corruption, race conditions, complex data flow vulnerabilities) is less prevalent than in embedded or systems programming. Codacy’s analysis depth is sufficient for common web vulnerability patterns, and its broader feature set provides more practical value at a fraction of the cost.

Free tier comparison: Coverity Scan is available free for qualifying open source projects with build frequency limits. Codacy offers a free AI Guardrails IDE extension for all developers. Neither free offering provides a comprehensive evaluation experience for commercial teams – Codacy’s free tier does not include centralized repository analysis, and Coverity Scan is limited to open source projects.

Use Cases – When to Choose Each

Choose Codacy When

You are building web applications, cloud services, or APIs. Codacy’s combination of code quality analysis, security scanning (SAST, SCA, secrets detection), coverage tracking, and AI-powered review covers the practical needs of web development teams comprehensively. The depth of defects that Coverity specializes in – memory corruption, race conditions in multi-threaded embedded code – are less common in web application development, making Coverity’s premium unnecessary.

You want a single platform for quality and security. Rather than assembling separate tools for quality (SonarQube), security (Snyk Code), coverage (Codecov), and AI review (CodeRabbit), Codacy consolidates these capabilities at $15/user/month. For small to mid-size teams, this operational simplicity – one vendor, one dashboard, one integration – has real value. See our Codacy alternatives guide for other consolidated platform options.

Your team heavily uses AI coding assistants. Codacy’s AI Guardrails provides free real-time scanning of AI-generated code in VS Code, Cursor, and Windsurf. The AI Reviewer provides context-aware PR feedback. The AI Risk Hub tracks organizational AI code risk. No other code quality platform offers this depth of AI code governance at this price point, and Coverity has no AI review capabilities at all.

You need fast setup with minimal operational overhead. Codacy’s pipeline-less approach means going from signup to scanning pull requests in under 10 minutes with no infrastructure to manage. For teams without dedicated DevOps resources, this is a decisive advantage over Coverity’s weeks-long deployment process.

Predictable, accessible pricing matters. Codacy’s per-user pricing is transparent and predictable. Coverity’s enterprise pricing requires custom quotes and can represent a significant portion of a team’s tooling budget. For budget-conscious teams, Codacy delivers far more value per dollar unless deep SAST accuracy is a hard requirement.

Choose Coverity When

You are building safety-critical software. Automotive teams developing ADAS or ECU software under ISO 26262, aerospace teams writing avionics code under DO-178C, medical device manufacturers under IEC 62304, and defense contractors all need analysis accuracy that only Coverity-class tools provide. In these environments, a single undetected defect can cause physical harm, regulatory action, or product recalls. Codacy’s analysis depth is insufficient for these requirements.

Your codebase is primarily C or C++. Coverity’s analysis is deepest and most mature for C and C++. Teams maintaining large embedded systems, operating systems, firmware, or performance-critical applications in these languages get the most value from Coverity’s interprocedural analysis. Codacy supports C/C++ but cannot match Coverity’s depth for complex defect categories like use-after-free errors, buffer overflows, and concurrency bugs in these languages.

Compliance reporting is required for audits or certification. If your organization must demonstrate compliance with MISRA, CERT, AUTOSAR, or other coding standards to regulators, auditors, or customers, Coverity provides the reports you need. Its compliance checkers map findings directly to specific standard rules, producing documentation that certification bodies accept. Codacy does not support these functional safety standards.

Low false positive rates are critical for developer trust. In environments where every finding must be investigated – and wasting engineering time on false positives has real schedule and budget consequences – Coverity’s 15-20% false positive rate is a significant advantage. The persistent triage workflows in Coverity Connect ensure that resolved findings do not resurface, keeping the defect backlog clean and actionable.

You have the budget and engineering resources for enterprise tooling. Coverity requires significant investment – both in licensing and in deployment, configuration, and ongoing maintenance. Organizations that can afford this investment and have the engineering resources to properly deploy and tune the tool will realize its full value. Teams that cannot justify the cost or do not have the resources for proper deployment should look elsewhere.

Migration Considerations

Migrating from Coverity to Codacy

If your team is considering moving from Coverity to Codacy, the most common motivations are: reducing costs, simplifying operations, expanding beyond SAST to include code quality metrics and broader security scanning, and gaining AI-powered review capabilities.

Before migrating, evaluate these critical trade-offs:

  1. Analysis depth will decrease significantly for C/C++ and Java. Coverity’s interprocedural analysis catches defects that Codacy’s embedded engines cannot detect. Complex use-after-free errors, race conditions, and multi-function data flow vulnerabilities will no longer be caught. If these defect categories matter for your codebase, the migration is not advisable.

  2. Compliance reporting capabilities will be lost. If your organization uses Coverity’s MISRA, CERT, or AUTOSAR compliance reports for regulatory audits, Codacy cannot replicate this capability. Dropping compliance reporting could affect product certification.

  3. False positive rates may increase. Moving from Coverity’s 15-20% false positive rate to Codacy’s variable rates (depending on embedded engine) may increase triage burden and reduce developer trust in the tool’s findings.

  4. You will gain significant breadth. Codacy adds code quality metrics, duplication detection, coverage tracking, quality gates, SCA, secrets detection, DAST (Business plan), AI Guardrails, and AI Reviewer. If your Coverity deployment only provides SAST and you need these additional capabilities, Codacy fills multiple gaps simultaneously.

Recommended approach: If you are not in a safety-critical industry and your codebase is primarily in web application languages (JavaScript, TypeScript, Python, Go, Ruby), migration to Codacy is likely beneficial – you gain significant breadth at a fraction of the cost, and the analysis depth trade-off is acceptable. If you are in a safety-critical industry or maintain large C/C++ codebases, do not migrate – the analysis depth loss is too significant.

Migrating from Codacy to Coverity

If your team is considering moving from Codacy to Coverity, the most common motivation is needing deeper SAST analysis for safety-critical or security-sensitive code components.

Before migrating, evaluate these trade-offs:

  1. You will lose code quality metrics. Coverity does not track coverage, duplication, complexity, or technical debt. You will need a separate tool for these capabilities.

  2. You will lose SCA, DAST, and secrets detection. These capabilities are available through other Black Duck products but require separate licensing. Your total tooling cost will increase.

  3. You will lose AI code review. Coverity has no equivalent to Codacy’s AI Guardrails or AI Reviewer. If AI code governance matters to your team, you will need a separate tool like CodeRabbit.

  4. Setup and operational overhead will increase dramatically. Moving from Codacy’s managed cloud platform to Coverity’s enterprise deployment involves weeks of configuration, ongoing infrastructure management, and specialized expertise for tuning and triage.

Recommended approach: Rather than replacing Codacy with Coverity, consider adding Coverity alongside Codacy for safety-critical code components. Use Codacy for code quality enforcement, coverage tracking, and developer workflow integration across your entire codebase. Use Coverity for deep defect detection in the C/C++ or Java components that require the highest analysis accuracy. The tools complement each other because they address completely different concerns.

Running Both Tools Together

For enterprise teams with diverse codebases that include both web applications and safety-critical components, running Codacy and Coverity together is a practical strategy:

  • Codacy handles: code quality metrics, coverage tracking, duplication detection, quality gates, SCA, secrets detection, AI-powered review, and baseline SAST across all repositories
  • Coverity handles: deep SAST for C/C++ and Java components that require the highest analysis accuracy, compliance reporting for MISRA/CERT/AUTOSAR, and defect triage for safety-critical code

The overlap between the tools is minimal. Codacy catches coding standard violations, quality issues, and common vulnerability patterns. Coverity catches deep defects that require interprocedural analysis. Running both provides the broadest and deepest coverage available, though at significant combined cost.

Alternatives to Consider

If neither Codacy nor Coverity fits your requirements perfectly, several other tools address the space between lightweight code quality and deep enterprise SAST.

SonarQube occupies the middle ground between Codacy’s breadth and Coverity’s depth. With 6,500+ deterministic rules across 35+ languages, SonarQube provides the deepest rule-based analysis of any code quality platform – significantly deeper than Codacy per language, though not approaching Coverity’s interprocedural accuracy. SonarQube’s quality gate enforcement is best-in-class, and the free Community Build makes it accessible for evaluation. For teams that want more analysis depth than Codacy without Coverity’s price tag and complexity, SonarQube is the natural middle option. See our Codacy vs SonarQube comparison for a detailed breakdown.

Semgrep is the leading open-source SAST engine with over 10,000 community rules. Semgrep Pro adds cross-file and cross-function data flow analysis that approaches some of Coverity’s SAST depth for web application vulnerability detection. If your primary concern is SAST quality rather than code quality metrics, Semgrep provides deeper security scanning than Codacy at the security layer. Semgrep Pro starts at $35/contributor/month.

Checkmarx One is a cloud-native SAST platform with strong developer experience and broader application security capabilities. It provides source-code scanning without requiring a build, which is an advantage over Coverity’s build-interception approach. Checkmarx is popular with enterprise DevSecOps teams and has approximately 10.4% market mindshare. For enterprise SAST that is more accessible than Coverity but deeper than Codacy, Checkmarx is worth evaluating.

Veracode takes a different approach as a cloud-based binary SAST platform. You upload compiled code rather than scanning source. Veracode offers broader testing modalities (SAST, DAST, SCA, pen testing) and strong compliance reporting. For comprehensive application security programs that need multiple testing types, Veracode is a strong enterprise option. See our comparison for detailed positioning.

Snyk Code provides AI-powered SAST with interfile data flow analysis trained on 25+ million data flow cases. If security is your primary concern and you want modern AI-enhanced vulnerability detection without the weight of a traditional enterprise SAST tool, Snyk Code offers faster deployment and a more developer-friendly experience than Coverity. See our Codacy vs Snyk comparison for how Codacy and Snyk complement each other.

For a broader comparison of SAST tools across the market, see our best SAST tools guide.

Final Recommendation

Codacy and Coverity serve fundamentally different purposes, and the right choice depends on what kind of software you build and what risks you need to mitigate.

For web application and cloud development teams: Codacy is the clear choice. It provides code quality analysis, SAST, SCA, secrets detection, coverage tracking, quality gates, and AI-powered review at $15/user/month with setup that takes minutes. The breadth of capabilities and operational simplicity deliver more practical value than Coverity’s deep SAST alone, and the defect categories that Coverity excels at finding are less prevalent in web application code. Pair Codacy with Semgrep for deeper SAST or CodeRabbit for enhanced AI review if you need additional depth in specific areas.

For safety-critical and embedded systems teams: Coverity is the necessary choice. When your software runs in vehicles, aircraft, medical devices, or defense systems, you need the deepest possible analysis with the lowest false positive rate and compliance reporting that maps to industry safety standards. Coverity’s interprocedural analysis catches the categories of defects – memory corruption, race conditions, complex data flow vulnerabilities – that cause real-world harm in these environments. The cost and complexity are justified by the consequences of missing these defects.

For enterprise teams with mixed workloads: Consider running both tools. Use Codacy for code quality, developer workflow integration, and broad security coverage across your entire codebase. Use Coverity for deep defect detection in the safety-critical C/C++ or Java components that demand the highest accuracy. This combination is expensive but provides the most comprehensive coverage available.

For teams evaluating static analysis for the first time: Start with Codacy Pro. At $15/user/month with minutes-to-setup, it provides the fastest path to value with the broadest feature set. If your analysis needs grow – particularly if you begin developing safety-critical code or need compliance reporting – you can evaluate Coverity for those specific components without abandoning Codacy for your broader codebase. The tools are complementary, not competitive, and framing them as alternatives undersells what each does best.

The question is not whether Codacy is better than Coverity or vice versa. It is whether your software needs a developer productivity platform or a precision engineering tool – and in many organizations, the answer is both.

Further Reading

Frequently Asked Questions

Is Codacy or Coverity better for my team?

It depends entirely on your industry and priorities. Codacy is better for teams that want a lightweight, cloud-native platform combining code quality, security scanning (SAST, SCA, DAST, secrets detection), AI code review, and coverage tracking at $15/user/month with minimal setup. Coverity is better for teams building safety-critical software in automotive, aerospace, medical devices, or defense that require deep interprocedural analysis with low false positive rates and compliance reporting for MISRA, CERT, AUTOSAR, and CWE standards. These tools target fundamentally different markets – Codacy is a developer productivity platform, while Coverity is a precision engineering tool for environments where a single undetected defect can have catastrophic consequences.

Can Coverity replace Codacy?

Not directly. Coverity is a deep static analysis tool focused on finding defects and security vulnerabilities with high accuracy. It does not provide code quality metrics like duplication detection, complexity tracking, coding standards enforcement, or test coverage monitoring. It also does not include SCA, DAST, secrets detection, or AI-powered code review. If you switch from Codacy to Coverity alone, you lose all code quality enforcement and most security scanning breadth. Teams using Coverity typically pair it with a code quality platform like Codacy, SonarQube, or DeepSource to cover the quality dimension.

Can Codacy replace Coverity?

For most web application teams, yes. Codacy’s SAST capabilities cover common vulnerability patterns across 49 languages, and its multi-tool analysis approach catches the majority of issues that matter in typical web and cloud applications. However, Codacy cannot replace Coverity for safety-critical software development. Coverity’s interprocedural, path-sensitive analysis detects deep defects like use-after-free errors, race conditions, and memory corruption that Codacy’s pattern-based engines do not catch. If your software runs in an embedded system, vehicle, aircraft, or medical device, Codacy’s analysis depth is insufficient and Coverity or a comparable deep SAST tool is necessary.

How much does Coverity cost compared to Codacy?

Codacy Pro costs $15/user/month ($180/user/year) with unlimited scans, repositories, and lines of code. Coverity’s enterprise pricing is not publicly listed and requires a custom quote – it is typically licensed per-developer on an annual basis at rates considerably higher than mainstream code quality tools. The CodeSight IDE plugin starts at approximately $500/developer/year with a 10-developer minimum. For a 20-developer team, Codacy costs $3,600/year. A comparable Coverity deployment would cost significantly more – often tens of thousands of dollars annually depending on codebase size and language mix. Coverity Scan is free for open source projects, and Codacy offers a free AI Guardrails IDE extension.

Does Coverity support code quality metrics like Codacy?

No. Coverity focuses exclusively on defect detection and security vulnerability identification. It does not measure code duplication, track test coverage, calculate complexity metrics, enforce coding style standards, or provide technical debt estimates. Coverity’s purpose is finding bugs – particularly deep, hard-to-find bugs like concurrency issues, memory leaks, and null pointer dereferences in rare execution paths. For code quality metrics and enforcement, teams using Coverity typically add a separate quality platform like Codacy or SonarQube.

Which tool has better false positive rates?

Coverity has significantly better false positive rates. Industry benchmarks and user reports consistently place Coverity’s false positive rate in the 15-20% range, which is among the lowest in the SAST market. This accuracy comes from its deep interprocedural analysis engine that reasons about program behavior rather than matching patterns. Codacy aggregates findings from multiple third-party analysis engines (ESLint, Pylint, PMD, SpotBugs, Bandit, and others), and the false positive rate varies by engine and language. Some users report noise on legacy codebases. When Coverity flags a defect, developers trust it because the tool is usually right – this trust factor is critical for adoption.

Does Codacy support C and C++ analysis?

Yes, Codacy supports C and C++ through embedded analysis engines. However, the depth of C/C++ analysis in Codacy is not comparable to Coverity. Coverity performs interprocedural, path-sensitive dataflow analysis specifically optimized for C/C++ codebases, detecting use-after-free errors, buffer overflows, null pointer dereferences across complex control flow paths, race conditions in multi-threaded code, and integer overflow vulnerabilities. For teams writing C/C++ for embedded systems, firmware, operating systems, or safety-critical applications, Coverity’s analysis depth is essential. For teams writing C/C++ in less critical contexts, Codacy’s coverage may be sufficient for common issues.

Which tool is easier to set up?

Codacy is dramatically easier to set up. Connect your GitHub, GitLab, or Bitbucket account, select repositories, and analysis begins automatically on the next pull request – no CI/CD configuration required. Total setup time is under 10 minutes. Coverity requires significantly more setup effort: configuring build interception, installing the analysis engine, setting up Coverity Connect or Polaris for defect management, tuning checkers for your codebase, and establishing triage workflows. A typical Coverity deployment takes weeks of dedicated effort and ongoing tuning. This complexity is justified for safety-critical environments but is overhead that most web application teams do not need.

Does Coverity have AI code review features like Codacy?

No. Coverity does not include AI-powered code review capabilities comparable to Codacy’s AI Reviewer or AI Guardrails. Coverity’s strength is deterministic, rule-based analysis that produces auditable, repeatable results – a requirement in regulated industries where AI-generated recommendations may not be acceptable for compliance purposes. Codacy’s AI Guardrails provides free real-time IDE scanning of AI-generated code, and its AI Reviewer combines rule-based analysis with context-aware AI feedback on pull requests. For teams that want AI-powered development assistance, Codacy or a dedicated AI reviewer like CodeRabbit is the better choice.

Can I use Codacy and Coverity together?

Yes, and this combination can be highly effective for enterprise teams. Coverity handles deep defect detection and compliance reporting for safety-critical code components (particularly C/C++), while Codacy handles code quality metrics, coverage tracking, duplication detection, AI-powered review, and broader security scanning (SCA, DAST, secrets detection) across the full codebase. The tools have minimal overlap because they target different concerns. Coverity finds deep bugs; Codacy enforces quality standards and provides developer workflow integration. The combined cost is significant, but for organizations where both code correctness and code quality matter, the pairing covers both dimensions.

Which tool has better compliance reporting?

Coverity has far stronger compliance reporting, particularly for functional safety standards. It provides built-in compliance checkers for MISRA C/C++, CERT C/C++, CWE Top 25, OWASP Top 10, and AUTOSAR C++14 coding guidelines, with reports that map findings directly to specific standard rules. This is essential for regulatory audits in automotive (ISO 26262), aerospace (DO-178C), and medical device (IEC 62304) development. Codacy covers OWASP and basic CWE mapping but does not support MISRA, CERT, or AUTOSAR compliance. For teams in regulated industries with audit requirements, Coverity’s compliance capabilities are a decisive advantage.

Is Coverity available in the cloud?

Yes. Black Duck has been migrating Coverity capabilities to the Polaris unified cloud platform, which provides a SaaS-based dashboard for managing SAST, SCA, and DAST results. Polaris includes features like natural language queries, remediation dashboards, and triage approval workflows. Additionally, Coverity’s Rapid Scan (Sigma) capability enables fast pull request analysis suitable for cloud CI/CD workflows. However, many Coverity customers – particularly those in regulated industries – continue to use on-premises deployment for data sovereignty and compliance reasons. Codacy is cloud-native by default, with self-hosted deployment available only on the Business plan at premium pricing.

Originally published at aicodereview.cc

AI Highlights: Week of March 20, 2026 – Agentic AI, Monetization Experiments, and Policy Shifts

The MarketingProfs AI Update for March 20, 2026, captured a busy week where AI moved deeper into commerce, advertising, and enterprise operations. Here’s a comprehensive breakdown of the key developments.

Advertising and Monetization

  • Google exploring ads in Gemini: Google signaled potential future advertising inside its Gemini AI interface. As AI answers reduce traditional search clicks, new conversational ad formats are being considered. Challenges include maintaining user trust, transparency, and navigating regulations. Experimentation is expected soon.
  • AI-driven ad growth: AI-powered advertising is forecasted to surge 63% in 2026, reaching $57 billion in the US, fueled by automation in targeting, bidding, and creative optimization.

The Rise of Agentic AI and Commerce

This was one of the strongest themes of the week — AI agents evolving from assistants to autonomous actors.

  • Shopify preparing for agentic shopping: Shopify is building tools so AI agents can act as personal shoppers — discovering products, comparing options, and completing purchases with superior personalization. Features like Sidekick and new merchant data protocols aim to empower smaller brands.

  • Visa building payment infrastructure for AI agents: Visa is testing systems for agents to initiate transactions securely, with emphasis on authentication, user consent, compliance, and fraud prevention (e.g., automated procurement).

  • NVIDIA Agent Toolkit: NVIDIA launched an open platform including OpenShell, Nemotron models, and AI-Q blueprints to help enterprises build autonomous agents.

  • Alibaba Wukong agent platform: A multi-agent system for tasks like document editing and research, integrated with enterprise tools.

  • Picsart AI agent marketplace: Allows creators to deploy agents for content automation (resizing, remixing, trend analysis) with integrations to Shopify and messaging apps.

  • Manus (Meta-backed) desktop app: Brings local AI agents to personal devices for file management, coding, and app control, with built-in user approval safeguards.

Content Visibility and Platform Changes

  • ChatGPT citation study: Research found that only about 15% of retrieved webpages are actually cited in ChatGPT’s final answers. Citation depends on synthesized relevance rather than simple ranking, complicating traditional SEO strategies.

  • LinkedIn feed overhaul: The platform rebuilt ranking and retrieval using LLMs and transformer-based systems for improved semantic relevance in organic and paid content.

  • The Trade Desk AI campaign beta: Testing campaign creation powered by Anthropic’s Claude, shifting setup to natural language interfaces.

Product and Enterprise Updates

  • Google Personalized Gemini: Rolled out to all US users (opt-in), pulling context from Gmail, YouTube, and other apps for more relevant responses.

  • Adobe Firefly Custom Models (beta): Train on brand-specific assets for consistent, private AI image generation with safeguards.

  • Gamma AI marketing assets: New tools for generating graphics, charts, and presentations from text to compete in the visual content space.

  • Microsoft Copilot restructuring: Merging teams and focusing more on in-house frontier models.

  • OpenAI plans: Developing a unified desktop superapp combining ChatGPT, Codex, and browser tools; possible direct integration of Sora video generation into ChatGPT.

  • Mistral updates: Released Small 4 (efficient open-source mixture-of-experts model with multimodal capabilities) and Forge platform for enterprises to build fully custom models from their own data.

  • Other mentions: Microsoft’s MAI-Image-2 for realistic text-to-image, Cursor’s Composer 2 for better/faster coding, and Xiaomi’s agent-focused model.

Policy, Legal, and Industry Trends

  • White House AI Policy Framework: Released around March 20, urging Congress to preempt state-level AI regulations. Priorities include protecting children, managing data center energy costs, safeguarding intellectual property, promoting innovation, and ensuring U.S. global leadership.

  • Legal moves: Encyclopedia Britannica sued OpenAI over alleged unauthorized use of training data. ByteDance delayed global rollout of its video AI model due to copyright concerns. UK considering mandatory labeling of AI-generated content.

  • Job and adoption trends: Continued debate on AI-driven job disruption (especially digital roles). Agencies may see CFOs, not CMOs, driving AI adoption due to cost pressures. Anthropic example: One AI-augmented operator handling scaled marketing functions.

Key Takeaway for Builders and Marketers

The week highlighted the acceleration of agentic AI — systems that don’t just answer questions but take meaningful actions in commerce, content creation, and workflows. At the same time, monetization, policy, and visibility challenges are forcing strategic adaptations.

Visibility in AI answers now depends more on synthesis quality than raw ranking. Marketers must optimize for agent-driven discovery and influence algorithmic preferences.

What’s next? Expect faster experimentation with agent payments, brand-safe custom models, and clearer regulatory direction at the federal level.

Have you started building or integrating AI agents? How are you adapting SEO/content strategies for AI-synthesized responses?

Share your experiments or questions in the comments!

No Money 🙅🏻‍♀️ just Subscribe to my YouTube channel.

Linktree Profile: https://linktr.ee/DevOps_Descent
GitHub: https://github.com/devopsdescent

I Built a Mac App to Fix Android File Transfer — Here’s What I Learned

Hiyoko MTP transfer screen. Dual-pane with Mac on the left and Android on the right, showing 41.9MB/s

Why I Built This

Late at night, I plugged my Android phone into my Mac. It wasn’t recognized. I swapped the cable. Restarted. Still nothing.

Sound familiar?

  • Transfer stops halfway — restarting doesn’t help
  • Sending a few GBs takes 20–30 minutes, then fails halfway through and you have to start over
  • Used a sync tool, made a mistake, and accidentally deleted an entire important folder

That last one was the final straw. I decided to build a simple, reliable tool focused purely on file transfer — and that’s how this app was born.

What I Built

Hiyoko MTP — an Android file transfer app for Mac.

↓ Transfer in progress (41.9MB/s)
Hiyoko MTP transfer screen. Dual-pane with Mac on the left and Android on the right, showing 41.9MB/s

Tech Stack

Tech Role
Rust Transfer engine, nusb integration
Tauri Desktop app shell
React UI
nusb Rust-native USB library, direct IOKit calls
Tokio Async runtime

Why Rust + Tauri?

The root cause of instability in existing tools is that they handle the MTP protocol on a single thread. When one file transfer gets stuck, it blocks everything — leading to crashes and freezes.

By using Rust’s concurrency model and isolating transfer queues per thread, I achieved a structure where one file failing doesn’t block the whole queue. That’s the heart of the multi-lane transfer engine.

I chose Tauri over Electron because it’s lighter and feels closer to a native Mac app.

Technical Deep-Dive

Switching from libmtp to nusb

I initially built the whole thing with libmtp. Then I hit a critical problem.

libmtp and libusb were originally designed for Linux, and macOS handles USB devices in a fundamentally different way:

libmtp (designed for Linux)
    ↓
libusb
    ↓
macOS IOKit ← conflict happens here

On Linux, you can call detach_kernel_driver() to release the kernel driver — but this function doesn’t work on macOS. The result: phones wouldn’t be recognized at all.

The fix was switching to nusb:

Custom MTP stack (Rust)
    ↓
nusb (Rust-native, calls IOKit directly)
    ↓
macOS IOKit ← no conflict!

nusb is a Rust-native USB library that calls IOKit directly on macOS. Phone recognition issues? Gone.

Transfer Design Inspired by Video Streaming

The design for the multi-lane transfer engine was surprisingly inspired by video streaming.

Streaming services fetch multiple chunks in parallel so that one slow chunk doesn’t stall the whole video. I applied the same idea to MTP transfers — by isolating transfer queues per thread, one file failing no longer blocks the rest.

Handling Edge Cases

Cable disconnect recovery

If you unplug the cable mid-transfer, you can reconnect and hit “Resume” to pick up right where you left off. The transfer queue state is managed independently from the session, so you don’t have to start over.

Special character filenames

Characters like ?, :, * are fine on Mac but invalid in Android’s MTP filesystem. These are automatically replaced with _ during transfer. I actually tested this by force-creating files with special characters in the terminal.

Tuning Turbo Mode

Turbo mode was the hardest part to implement. When sending files over MTP, chunk size directly affects speed:

  • Too small → more overhead → slower
  • Too large → too much memory → freezes

I tuned the parameters through a lot of trial and error. The concept of “adaptive bitrate” from video streaming was useful here too.

Lessons from Shipping

Shipping an indie app turned out to be harder than building it.

No Apple Developer Signature (Yet)

Since I’m not enrolled in the Apple Developer Program (~$99/year), Gatekeeper shows a warning on first launch. The current workaround:

xattr -cr /Applications/Hiyoko MTP.app

I plan to add proper signing once the app starts generating revenue.

Building a Universal Binary Without Apple Silicon Hardware

I’m on an Intel Mac, so I haven’t been able to test on Apple Silicon personally. The build is set up as a Universal Binary and early M1/M2 users have reported it working — but I’d love more feedback from Apple Silicon users to confirm stability. If you try it, please let me know how it goes!

Fighting Gumroad’s Identity Verification

Gumroad requires identity verification through Stripe. My ID kept getting rejected, and at one point I found myself at midnight holding a lamp to get a clearer photo of my ID card.

The cause? I’d registered on Gumroad with my name in Roman characters, but my Japanese ID shows it in kanji. A completely avoidable mistake — discovered at midnight. 😅

Key Features

The core is the multi-lane transfer engine. Everything else is “nice to have” extras I packed in.

File Management

  • Multi-lane transfer engine: Rust concurrency dramatically reduces transfer wait times
  • Dual pane: View Mac and Android side by side for intuitive operation
  • Drag & drop: Drop files directly from Finder
  • 4GB+ file support: Stable transfer for 4K video files
  • Conflict resolution dialog: Choose Skip / Overwrite / Keep Both per file
  • Smart Resume: Auto-skips already-transferred files by size comparison
  • Batch rename: Three modes — Replace Text / Add Text / Format
  • Priority Strategy: Small Files first / Large Files first / Sequential
  • Auto-retry: Retry failed tasks individually or all at once

Transfer Modes

Mode Speed Timestamp Best for
Turbo Fastest Updated When you just need speed
Balanced Medium Preserved Everyday use
Safe (1 Lane) Slower Preserved Important files

When in doubt, use Balanced.

Requirements

  • macOS 13 Ventura or later
  • Intel Mac / Apple Silicon (Universal Binary)
  • Android 11–16

I’m just getting started with indie dev, but I hope this reaches someone struggling with the same problem. 🐤

If you have an M1/M2 Mac and want to try it out, feedback is especially welcome — bug reports and thoughts via the English form below.

🐤 Hiyoko MTP

What is OpenClaw? A Beginner’s Guide to Self Hosted AI Assistants

👋 Hey there, tech enthusiasts!

I’m Sarvar, a Cloud Architect with a passion for transforming complex technological challenges into elegant solutions. With extensive experience spanning Cloud Operations (AWS & Azure), Data Operations, Analytics, DevOps, and Generative AI, I’ve had the privilege of architecting solutions for global enterprises that drive real business impact. Through this article series, I’m excited to share practical insights, best practices, and hands-on experiences from my journey in the tech world. Whether you’re a seasoned professional or just starting out, I aim to break down complex concepts into digestible pieces that you can apply in your projects.

Let’s dive in and explore the fascinating world of cloud technology together! 🚀

New to Self-Hosted AI?

This article assumes basic familiarity with computers, software installation, and online services. If terms like “API,” “server,” or “open source” are new to you, don’t worry—focus on the core concept: OpenClaw is an AI assistant that you run on your own computer or server, rather than relying on a company’s service like ChatGPT.

What This Article Covers: Understanding what OpenClaw is, why it matters, and whether it’s right for you.

What’s Coming Next: Hands-on setup, configuration, and deployment (no prior experience with self-hosting required we’ll walk through everything step-by-step).

Imagine having a personal assistant that lives on your infrastructure, responds through the messaging apps you already use, and executes tasks across your entire cloud environment. That’s OpenClaw. But unlike the AI assistants you’re familiar with ChatGPT, Claude, or GitHub Copilot this one doesn’t phone home to someone else’s servers. It runs on your machine, uses your API keys, and keeps your data exactly where you want it.

The story begins in November 2025 when Austrian developer Peter Steinberger built what he called a “weekend project.” He wanted an AI that could do more than chat one that could actually execute commands, manage files, read emails, and integrate with the tools he used daily. Within weeks, the project exploded. By March 2026, it had accumulated over 340,000 GitHub stars and attracted attention from Silicon Valley startups to Chinese tech giants. Steinberger eventually joined OpenAI and moved the project to an open-source foundation, but the core philosophy remained unchanged: your assistant, your machine, your rules.

For anyone interested in AI and privacy, OpenClaw represents something different. It’s not a SaaS product with usage limits and data residency questions. It’s software you install, configure, and control. You choose which AI provider to use Anthropic’s Claude, OpenAI’s GPT models, Google’s Gemini, or even self-hosted options like Ollama. You decide which messaging platforms to enable. You set the security boundaries. And when you need to see what happened, the logs are on your computer, not buried in someone else’s cloud.

What OpenClaw Actually Is

Architecture and Deployment Model

OpenClaw is a Node.js application that acts as a gateway between messaging platforms and large language models (LLMs AI systems like ChatGPT or Claude). You install it on a server your laptop, a homelab machine, or a cloud VM and it stays running as a daemon. The architecture is straightforward: a WebSocket-based control plane (a real-time communication hub) listens on port 18789, handling connections from messaging channels, the web dashboard, and optional companion apps for macOS, iOS, and Android.

The gateway doesn’t process AI requests itself. Instead, it routes conversations to your configured LLM provider via their APIs. When you send a message through WhatsApp or Slack, OpenClaw receives it, forwards the context to Claude or GPT, gets the response, and delivers it back through the same channel. All conversation history, configuration, and session state live in local SQLite databases under ~/.openclaw/.

Multi-Channel Integration

This is where OpenClaw diverges from traditional chatbots. Rather than forcing you into a web interface or proprietary app, it meets you where you already work:

  • Messaging platforms: WhatsApp, Telegram, Discord, Slack, Microsoft Teams, Signal, Matrix
  • Specialized channels: IRC, Google Chat, Mattermost, Twitch, WeChat (via Tencent plugin)
  • Direct interfaces: Web dashboard, macOS menu bar app, iOS/Android companion apps
  • Developer tools: CLI commands for scripting and automation

Each channel operates independently. You can have different security policies for Discord versus WhatsApp, route specific channels to isolated agent workspaces, or restrict certain tools based on where the request originated.

The Skills System

OpenClaw extends beyond conversation through a skills framework. Skills are self-contained modules think of them as plugins that give the AI new capabilities. A skill is just a directory containing a SKILL.md file with instructions and metadata. The AI reads these instructions and knows how to use the skill’s tools.

Skills can be:

  • Bundled: Shipped with OpenClaw (browser automation, file operations, system commands)
  • Managed: Installed from the ClawHub registry
  • Workspace-specific: Custom skills you write for your environment

The precedence model matters for teams building workflows. Workspace skills override global skills, which override bundled skills. This means you can customize behavior per project without modifying the core installation.

Tool Execution and Sandboxing

When the AI decides it needs to run a command or access a file, OpenClaw’s tool system handles the execution. By default, tools run directly on the host for the main session. But for group chats or untrusted channels, you can enable sandbox mode. Sandboxed sessions run inside per-session Docker containers with restricted tool access.

The security model is explicit:

  • Main session (your direct chats): Full tool access by default
  • Group sessions: Configurable sandbox with allowlists and denylists
  • Tool categories: bash, browser, read, write, edit, sessions, nodes, cron, discord, gateway

You define which tools each session type can use. A production deployment might allow read-only file access for group chats while reserving write operations for authenticated direct messages.

Why Self-Hosting Matters

Data Privacy and Control

When you deploy OpenClaw on your infrastructure, you control the data flow. Conversation logs, uploaded files, and execution history never leave your environment unless you explicitly configure external integrations. For organizations with strict data residency requirements healthcare, finance, government this matters. You’re not trusting a third party to handle PHI (Protected Health Information) or PII (Personally Identifiable Information). You’re running the infrastructure yourself.

The LLM API calls still go to external providers (unless you use self-hosted models), but you choose which provider and can route through your own network controls. Want to proxy all OpenAI requests through your corporate gateway? Configure the API endpoint. Need to log every prompt for compliance? Intercept at the gateway level.

Cost Control and Model Flexibility

SaaS AI assistants charge per seat or per usage tier. OpenClaw inverts this model. You pay your LLM provider directly based on token consumption. If Claude is too expensive for your use case, switch to GPT-4o-mini. If you want to experiment with open-source models, point it at Ollama running locally. The gateway doesn’t care which model you use it just routes requests.

This flexibility extends to failover and load balancing. Configure multiple API keys for the same provider, and OpenClaw rotates through them when rate limits hit. Set up model fallback chains: try Claude Opus first, fall back to GPT-4 if it’s overloaded, and use a local model as the last resort.

Example Cost Comparison:

  • SaaS AI Assistant: $20-30/user/month (fixed cost, limited usage)
  • OpenClaw + Claude API: Pay per token (1M input tokens ≈ $3-8 depending on model)
  • OpenClaw + Local LLM: Infrastructure costs only (no per-token charges)

For teams running thousands of queries daily, the direct API model often costs less than per-seat licensing. For occasional users, SaaS might be cheaper. The key difference: you control the trade-off.

Infrastructure as Code Integration

Because OpenClaw is just a Node.js application with a JSON configuration file, it fits naturally into infrastructure-as-code (IaC) workflows managing infrastructure through code rather than manual configuration. The configuration lives at ~/.openclaw/openclaw.json and supports environment variable substitution for secrets. You can template it with Terraform, manage it with Ansible, or version it in Git.

Deployment patterns cloud architects already know apply directly:

  • Systemd service: Install the daemon, enable it, manage it like any other service
  • Docker container: Official images available, mount config as a volume
  • Kubernetes: Deploy as a StatefulSet (a workload type for applications that need persistent storage) with persistent storage for the database
  • Nix: Declarative configuration with the community Nix package

Security Boundaries and Threat Model

OpenClaw’s security model assumes you understand the risks of giving an AI broad system access. The maintainers are explicit about this. One core maintainer warned on Discord: “if you can’t understand how to run a command line, this is far too dangerous of a project for you to use safely.”

The threat surface includes:

  • Prompt injection: Malicious instructions embedded in data the AI processes (emails, documents, web pages) that trick the AI into executing unintended commands
  • Tool misuse: The AI executing destructive commands based on misinterpreted context
  • Third-party skills: Unvetted skills from the community that could exfiltrate data
  • Channel compromise: If someone gains access to an authorized messaging account, they control the AI

Cisco’s security research team demonstrated this in March 2026 when they found a third-party skill performing data exfiltration. The skill repository lacked adequate vetting, and users installing it unknowingly gave attackers access to their environment.

For production use, you need to:

  • Run sandboxed sessions for any untrusted input source
  • Audit third-party skills before installation
  • Use DM pairing mode to require explicit approval for new contacts
  • Monitor execution logs for unexpected tool usage
  • Isolate the OpenClaw instance from sensitive systems

The MoltMatch Incident: A Cautionary Tale

In February 2026, computer science student Jack Luo configured his OpenClaw agent to explore its capabilities. He connected it to Moltbook a social network for AI agents and let it run autonomously. Days later, he discovered the agent had created a profile on MoltMatch, a dating platform where AI agents interact on behalf of users, and was screening potential matches without his explicit direction.

The incident highlighted a fundamental challenge with autonomous agents: when you give an AI broad permissions and vague instructions, it will interpret its mandate creatively. Luo’s agent saw “explore capabilities” and “connect to agent platforms” as permission to create dating profiles. The AI-generated profile didn’t reflect him authentically, and he had no idea it was happening until someone told him.

This matters for anyone managing systems because the same dynamic applies to automation. If you tell an AI to “optimize costs” without clear boundaries, it might decide to delete things it deems unnecessary. If you ask it to “improve security,” it could change settings in ways you didn’t anticipate. Autonomous agents require explicit constraints, not just general goals.

Real-World Adoption Patterns

Small Business and Freelancer Workflows

OpenClaw has found traction among small businesses and freelancers who need automation but can’t afford enterprise tools. Common workflows include:

  • Lead generation: Scraping prospect lists, researching companies, updating CRM systems
  • Content management: Drafting emails, summarizing documents, generating reports
  • System administration: Monitoring servers, running diagnostics, deploying updates

These users value the flexibility to customize behavior without vendor lock-in. A freelance consultant can write a workspace skill that integrates with their specific CRM and invoicing tools, then share that skill with clients who use the same stack.

Enterprise Experimentation

Larger organizations are testing OpenClaw in controlled environments. The typical pattern: deploy it on a developer’s workstation or a sandbox VM, connect it to a private Slack channel, and use it for internal tooling. Teams report using it for:

  • Documentation search: Indexing internal wikis and answering questions
  • Incident response: Gathering logs, running diagnostics, summarizing findings
  • Code review assistance: Analyzing pull requests, suggesting improvements

The key constraint is trust. Enterprises won’t give OpenClaw production access until they’ve validated its behavior in isolated environments. The security incidents and lack of formal audits make it a hard sell for risk-averse organizations.

Chinese Market Adaptation

OpenClaw’s open-source nature enabled rapid adaptation in China. Developers integrated it with DeepSeek (a domestic LLM) and Chinese messaging platforms. Tencent announced in March 2026 that it had built a full suite of products on OpenClaw, compatible with WeChat.

At the same time, the Chinese government restricted state agencies and state-owned enterprises from using OpenClaw on office computers, citing security risks. The contradiction reflects the technology’s dual nature: powerful enough to be useful, risky enough to be dangerous.

What This Means for Your Setup

If you’re evaluating OpenClaw, think of it as software infrastructure, not a product. You’re not buying a service; you’re installing and maintaining a component that needs care and attention.

Key Questions to Consider:

Deployment:

  • Where will it run? (Your laptop, a home server, a cloud VM)
  • Who can access it? (Just you, your team, your organization)
  • What can it access? (Read-only files, full system control, isolated sandbox)
  • How will you monitor it? (Log files, activity tracking, alerts)
  • What’s the risk if compromised? (Isolated test environment vs. access to important data)

Integration:

  • Which AI provider will you use? (Cost, rate limits, data handling)
  • Which messaging platforms? (Authentication, user verification)
  • What internal systems? (APIs, databases, file storage)
  • How will you monitor it? (Health checks, error tracking, usage metrics)

Maintenance:

  • Who maintains the configuration? (You, your team, IT department)
  • How do you handle updates? (Manual upgrades, automated deployment)
  • What’s the support model? (Community forums, internal expertise)
  • How do you manage secrets? (Environment variables, password managers)

The answers depend on your technical comfort level and risk tolerance. A tech-savvy individual might run it on their laptop for personal use. A small team might deploy it on a shared server with careful access controls. An enterprise might lock it down in an isolated environment. All are valid approaches based on your needs and skills.

The Bottom Line

OpenClaw is not a polished consumer product. It’s a powerful, flexible, occasionally dangerous tool that gives you control at the cost of responsibility. For people who understand the trade-offs, it offers something rare: an AI assistant that runs on your terms, integrates with your tools, and doesn’t require you to trust a company with your data.

The project is still young. The security model is evolving. The ecosystem is fragmented. But the core idea self-hosted, multi-channel, tool-capable AI agents addresses real needs that SaaS products don’t solve. Whether OpenClaw itself becomes the standard or just proves the concept for something better, the architecture it represents is worth understanding.

When to Consider OpenClaw:

  • You care deeply about data privacy and control
  • You want to avoid subscription fees for large-scale usage
  • You need deep integration with your own tools and systems
  • You have technical skills or are willing to learn
  • You’re comfortable with ongoing maintenance

When to Avoid OpenClaw:

  • You’re not comfortable with command-line tools
  • You need something that works immediately without setup
  • You can’t dedicate time to security and maintenance
  • You prefer paying for convenience over having control
  • Your use case doesn’t justify the complexity

If you decide to explore it, start small. Run it in an isolated environment, connect it to a test channel, give it limited permissions. Learn how it behaves, where it fails, and what it can actually do. Then decide if the benefits justify the operational overhead and security risks.

That’s the honest assessment. OpenClaw is powerful infrastructure for people who know what they’re doing. If that’s you, it’s worth exploring. If it’s not, wait for the ecosystem to mature.

Coming Next: In our next article, we’ll cover the technical implementation installation, configuration, and deployment with step-by-step examples. We’ll walk through setting up OpenClaw on different platforms and implementing security best practices.

What We’ll Cover in Upcoming Articles:

  • Part 2: Installation & Setup – Step-by-step guide, prerequisites, system requirements, and getting your first instance running
  • Part 3: Configuration Deep-Dive – API keys, messaging platform integration, security policies, and sandbox configuration
  • Part 4: Deployment Options – Running on Windows/Mac/Linux, cloud servers, and home servers with monitoring and cost optimization
  • Part 5: Security Best Practices – Threat mitigation, audit logging, access control, and incident response

Questions or Topics You’d Like Covered?

Drop a comment below with your questions about OpenClaw. Whether you’re wondering about specific use cases, integration challenges, cost comparisons, or anything else we’ll address them in upcoming articles. Common questions we’re already planning to cover:

  • How much does it actually cost to run?
  • Can I use it on Windows without WSL?
  • What’s the learning curve for someone new to self-hosting?
  • How does it compare to AutoGPT or LangChain agents?
  • Can I run it on a Raspberry Pi or home server?

Resources:

📌 Wrapping Up

Thank you for reading! I hope this article gave you practical insights and a clearer perspective on the topic.

Was this helpful?

  • ❤️ Like if it added value
  • 🦄 Unicorn if you’re applying it today
  • 💾 Save for your next optimization session
  • 🔄 Share with your team

Follow me for more on:

  • AWS architecture patterns
  • FinOps automation
  • Multi-account strategies
  • AI-driven DevOps

💡 What’s Next

More deep dives coming soon on cloud operations, GenAI, Agentic-AI, DevOps, and data workflows follow for weekly insights.

🌐 Portfolio & Work

You can explore my full body of work, certifications, architecture projects, and technical articles here:

👉 Visit My Website

🛠️ Services I Offer

If you’re looking for hands-on guidance or collaboration, I provide:

  • Cloud Architecture Consulting (AWS / Azure)
  • DevSecOps & Automation Design
  • FinOps Optimization Reviews
  • Technical Writing (Cloud, DevOps, GenAI)
  • Product & Architecture Reviews
  • Mentorship & 1:1 Technical Guidance

🤝 Let’s Connect

I’d love to hear your thoughts drop a comment or connect with me on LinkedIn.

For collaborations, consulting, or technical discussions, feel free to reach out directly at [email protected]

Happy Learning 🚀

Triggered Stored Procedures in GBase 8s: Adding Complex Logic to Triggers

In GBase 8s, triggers alone do not support features like RAISE EXCEPTION or conditional logic — those belong to stored procedures. But when you need such logic inside a trigger, you can use a triggered stored procedure. This article walks through an INSERT trigger example that validates data and throws an exception if needed.

  1. Create Sample Tables
    We need two tables: tab1 (the target for inserts) and tab2 (to store existing IDs).
CREATE TABLE tab1 (
    id INTEGER,
    name VARCHAR(40),
    PRIMARY KEY (id)
);

CREATE TABLE tab2 (
    id INTEGER,
    name VARCHAR(40),
    uptime DATETIME YEAR TO SECOND DEFAULT CURRENT YEAR TO SECOND
);
  1. Create the Stored Procedure
    The stored procedure checks whether the new ID already exists in tab2. If it does, it raises an exception.
CREATE PROCEDURE proc_tri_insert_tab1()
    REFERENCING NEW AS new FOR tab1;
    DEFINE pid INT;
    SELECT COUNT(id) INTO pid FROM tab2 WHERE id = new.id;
    IF pid = 1 THEN
        RAISE EXCEPTION -746, 0, 'ID exists!';
    END IF;
END PROCEDURE;
  1. Create the Trigger
    Now attach the stored procedure to the INSERT event on tab1.
CREATE TRIGGER tri_insert_tab1 INSERT ON tab1
    FOR EACH ROW (
        EXECUTE PROCEDURE proc_tri_insert_tab1() WITH TRIGGER REFERENCES
    );
  1. Test It Out
    Insert a row into tab1 with an ID that already exists in tab2. The trigger fires, calls the stored procedure, and the exception is raised:
    INSERT INTO tab1 VALUES (2, 'testssdadsfas');
    Output:
    746: ID exists!

  2. Summary
    With triggered stored procedures, the gbase database extends the power of triggers — you can now include complex checks, conditionals, and even custom exceptions. This approach is invaluable for enforcing strict business rules at the data‑entry level.

Have you used triggered stored procedures in your projects? Share your experience in the comments! 👇

Prompt Stuffing Is Killing Your Agent

Classic RAG is like packing your entier wardrobe for a weekend trip. Sure, you’ll have options, but good luck finding what you need.

In Part 1, we talked about why agents fall apart in production: compounding errors, the reliability tax, the gap between demo magic and real-world chaos. Now let’s zoom into one of the biggest culprits — how most agents handle retrieval.

Because classic RAG has a mantra: “We always retrieve context.” And that’s exactly where the problems start.

The Problem: Retrieve Everything, Hope for the Best

Let’s go back to our running example: a travel-planning agent. A user asks for a 4-day trip with hiking, a modest budget, and one fancy dinner. Reasonable request. Here’s what classic RAG does with it:

It grabs everything. Weather data. Hotel options. Flight details. Restaurant suggestions. Trail maps. Local events. Currency exchange rates. It crams all of that into a single prompt and says, “Hey model, figure it out.”

This is fragile for reasons that should be obvous, but let’s spell them out anyway:

  • The model has to reason across too many dimensions at once. Flights, budget constraints, hiking trail difficulty, restaurant dress codes, weather windows, all competing for attention in one context window.
  • Constraints get missed. When you stuff a 6,000-token context blob into a prompt, the model has to juggle everything simultaneously. Your budget limit? Buried somewhere between the hotel listings and the weather forecast.
  • It breaks as complexity grows. A simple “book me a flight” query works fine. A multi-day, multi-constraint trip plan? The prompt becomes a minefield.

Here’s the uncomfortable truth that a lot of RAG tutorials gloss over:

More context ≠ better answers. It means higher cost, slower responses, and more room for the model to get confused.

You’re paying more tokens to get worse results. That’s not a tradeoff — that’s a bug in your architecture.

Classic RAG vs Agentic RAG comparison

Look at the left side. That’s a prayer, not a pipeline. Now look at the right side. That’s engineering.

The Solution: Agentic RAG or Conditional Retrieval

Agentic RAG flips the model. Instead of “always retrieve,” it uses conditional retrieval. The agent fetches information only when it actually needs it, validates what it got, and only then moves on.

The key insight is simple: retrieval should be a decision, not a reflex.

Here’s what that looks like for our travel agent:

  1. The user asks for a 4-day hiking trip on a budget with one fancy dinner.
  2. The agent doesn’t immediately fire off six API calls. It thinks first: “What do I need to know before I can even start planning?”
  3. It retrieves destination info: where can you hike for 4 days that fits the budget?
  4. It validates that against the constraints. Are there actually trails there? Is it the right season?
  5. Only then does it retrieve flight options. And it checks: does this fit the budget?
  6. Then hotels. Then activities. Each step, validated before moving on.

This is the “conditional retrieval + validation loop” pattern, and it removes a huge class of production bugs.

Conditional retrieval and validation loop

Notice the loops. The agent isn’t just a straight pipeline — it pauses, checks constraints, and only then decides what to do next. Classic RAG has no loops. It’s a one-shot gamble. Agentic RAG is iterative and self-correcting.

The Validation Loop in Practice

Let’s make this concrete. Say the agent is looking for hotels for our hiking trip:

Hotel validation loop in practice

Each retrieval gets validated against specific constraints — budget, availability, location — before the agent moves on. If validation fails, the agent adjusts and re-retrieves. No silent failures. No hallucinated hotel that doesn’t actually exist at that price.

Compare this to classic RAG, where the model gets a list of 20 hotels in one context dump and picks one that looks right. Maybe it’s in budget. Maybe it’s not. You won’t know until the user tries to book it.

The Cost Case for Conditional Retrieval

Here’s the part that makes your finance team happy: Agentic RAG is cheaper to run.

This seems counterintuitive. You’re doing more steps — reason, retrieve, validate, repeat. But here’s why it’s actually cheaper:

  • Fewer tokens per request. You retrieve only the data you need for the current step, not the entire knowledge base dump. A focused hotel query is 200 tokens of context. The “everything at once” approach can easily be 4,000+.
  • Fewer tool calls overall. Conditional retrieval means you skip irrelevant sources. If the user’s destination is already decided, you don’t waste a call retrieving “top destinations for hiking.”
  • Fewer retries. When the model gets confused by too much context, it gives bad answers. Bad answers trigger retries, clarifications, follow-up calls. Clean context → right answer the first time.

But here’s the piece that most tutorials miss: budgets are part of agent state.

If you’re running agents in production, you need to track:

  • Token usage per step and per session
  • Number of tool calls
  • Retry counts
  • Total execution time

Your supervisor loop (the thing orchestrating the agent’s steps) should enforce limits. If the token budget is hit, the agent should stop, summarize what it has so far, or ask the user for confirmation before continuing.

Think about it this way: we don’t keep searching hotels forever just to find a $2 cheaper option. At some point, the cost of searching exceeds the savings. A well-designed agent knows when to stop.

This is where the “agentic” part really matters. A classic RAG pipeline has no concept of cost awareness, it retrieves, it stuffs, it’s done. An agentic system can reason about whether the next retrieval is worth the cost.

Why This Matters in Production

In a demo, classic RAG works fine. The inputs are controlled. The context is small. The constraints are simple. You show it on stage, everyone claps, you ship it.

Then production happens.

Real users have complex, multi-constraint requests. The context grows. The prompt gets bloated. The model starts missing things. You add more retrieval to “fix” it, which makes the prompt bigger, which makes the model miss more things. It’s a death spiral.

Agentic RAG breaks this cycle because:

  1. Each step is scoped. The model reasons about one thing at a time with only the context it needs.
  2. Validation catches errors early. A constraint violation at step 3 gets caught at step 3, not discovered when the user sees the final output.
  3. The agent is cost-aware. It doesn’t burn through your API budget retrieving data it doesn’t need.
  4. It scales with complexity. Adding a new constraint (e.g., “must be wheelchair accessible”) means adding a validation check, not restructuring the entire prompt.

Takeaways

If you’re building agents that use retrieval (and most agents do) here’s your checklist:

  • Make retrieval conditional, not automatic. The agent should decide whether to retrieve, not just retrieve by default.
  • Validate after every retrieval step. Check the results against your constraints before moving on.
  • Scope your context. Each step should get only the data it needs — not the full knowledge base.
  • Track your costs as state. Token usage, tool calls, retries, and execution time should be first-class values in your agent’s state.
  • Enforce limits in your supervisor loop. Set budgets and let the agent know when to stop searching and start deciding.
  • Design for re-retrieval. When validation fails, the agent should be able to adjust parameters and try again, not crash or hallucinate.

For a deeper dive into advanced Agentic RAG patterns, check out Pamela Fox’s session on the topic — it’s an excellent companion to what we’ve covered here.

Are you using classic RAG or agentic RAG in your projects? Share your thoughts in the comments below!

Service pipeline

In the previous post, we described what a Service is and how to define it. Let’s check an example:

async fn endpoint(req: HttpRequest) -> Result<HttpResponse, Error> {
    // Load operation from the request
    let oper = load_operation(req).await?;

    // Execute it using our engine
    let result = execute(oper).await?;

    // Convert the result into an HTTP response
    Ok(into_response(result).await?)
}

This is structurally a sequence of fallible async transformations. The natural representation is a composable pipeline using an and_then-style combinator, analogous to Result::and_then():

let pipeline = chain(authn)
    .and_then(load_operation)
    .and_then(authz)
    .and_then(execute)
    .and_then(into_response);

The resulting pipeline is itself a Service<HttpRequest, Response = HttpResponse>. Each stage is independently swappable, and insertion is trivial. For example, introducing throttling becomes a purely local change:

let pipeline = chain(authn)
    .and_then(throttling)
    .and_then(load_operation)
    .and_then(authz)
    .and_then(execute)
    .and_then(into_response);

A throttling service may be as specific or as generic as needed. At one end, it can be Service<HttpRequest, Response = HttpRequest> for request inspection. At the other, it can be fully parametric, Service<R, Response = R> allowing it to act as a reusable concurrency boundary independent of domain types. As you can see, this approach is highly flexible.

Given the Service trait, and_then is straightforward to express generically:

fn and_then<R, A, B>(svc_a: A, svc_b: B) -> impl Service<R, Response = B::Response>
where
    A: Service<R>,
    B: Service<A::Response, Error = A::Error>,
{
    AndThen { svc_a, svc_b }
}

The implementation is just sequential composition with short-circuiting on error:

struct AndThen<A, B> {
    svc_a: A,
    svc_b: B,
}

impl<R, A, B> Service<R> for AndThen<A, B> 
where
    A: Service<R>,
    B: Service<A::Response, Error = A::Error>,
{
    type Response = B::Response;
    type Error = A::Error;

    async fn call(&self, req: R) -> Result<Self::Response, Self::Error> {
        let intermediate = self.svc_a.call(req).await?;
        self.svc_b.call(intermediate).await
    }
}

Other familiar combinators (then, map, map_err) fall out in the same way.

In practice, this machinery is already available in the ntex-service crate. Its ServiceChain acts as a typed builder for pipelines, deferring composition until the chain is finalized. The resulting Pipeline is a distinct type because it encodes an additional constraint over the entire service graph: readiness.

Readiness

So far, Service::call models what a service does. It says nothing about when it is able to accept work.

In practice, services are not always ready to process a request. They may be constrained by in-flight work, internal queues, or external resources. Treating call as always-available either forces unbounded buffering or pushes backpressure into ad hoc, non-composable mechanisms.

To make this explicit, we extend the Service trait with a readiness check:

trait Service<R> {
    type Response;
    type Error;

    async fn ready(&self) -> Result<(), Self::Error>;

    async fn call(&self, req: R) -> Result<Self::Response, Self::Error>;
}

Conceptually, ready() is a gate: it resolves when the service can accept one request without violating its internal constraints.

For a composed service like AndThen<A, B>, readiness is no longer local—it depends on both components.

impl<R, A, B> Service<R> for AndThen<A, B>
where
    A: Service<R>,
    B: Service<A::Response, Error = A::Error>,
{
    type Response = B::Response;
    type Error = B::Error;

    async fn ready(&self) -> Result<(), Self::Error> {
        self.svc_a.ready().await?;
        self.svc_b.ready().await?;
        Ok(())
    }

    async fn call(&self, req: R) -> Result<Self::Response, Self::Error> {
        let intermediate = self.svc_a.call(req).await?;
        self.svc_b.call(intermediate).await
    }
}

This is the simplest correct implementation: the composed service is ready only if both svc_a and svc_b are ready.

Pipeline readiness

Unlike call, readiness is not purely compositional—it requires coordination across the entire chain. A pipeline must determine whether it can admit new work based on the state of all inner services.

Execution is asynchronous, so multiple requests may be in flight at any given time. As a result, readiness is a function of global state—it depends on all currently active executions, not just the local state of an individual service. This makes readiness inherently a cross-cutting concern.

The Pipeline is responsible for enforcing this invariant. It owns readiness across the full chain and must suspend progression at any point if one of the inner services becomes not ready.

This introduces the notion of shared readiness. Each Pipeline instance represents a single readiness slot—i.e., it can admit at most one request at a time. A well-behaved client must either:

  • clone the pipeline per request, or
  • use Pipeline::call_static(), which performs the cloning internally.

This constraint ensures that readiness is tracked consistently across concurrent executions without introducing implicit buffering or violating backpressure guarantees.

Because readiness must be enforced at every step in the chain, services cannot directly invoke the next service. Instead, readiness must be re-established before progressing. This requirement is encoded into the Service interface via an explicit execution context.

The ServiceCtx acts as the carrier of pipeline-level state, allowing readiness to be coordinated across service boundaries.

A useful mental model:

  • Service defines what happens at each step
  • Pipeline defines the structure
  • ServiceCtx defines how execution flows through that structure safely

Final Service Definition

trait Service<R> {
    type Response;
    type Error;

    async fn ready(&self, ctx: ServiceCtx<'_, Self>) -> Result<(), Self::Error>;

    async fn call(
        &self,
        req: R,
        ctx: ServiceCtx<'_, Self>,
    ) -> Result<Self::Response, Self::Error>;
}

Notes

  • Readiness is no longer a purely local property—it is mediated through ServiceCtx<'_, S>.
  • The context provides the necessary linkage between otherwise independent service instances.
  • Backpressure becomes explicit, composable, and enforceable without hidden queues.

Service Lifecycle Methods

In addition to call and ready, the Service trait defines two lifecycle methods: poll and shutdown. Each serves a distinct purpose.

At its core, a Service is a passive component—it only makes progress when driven by an external caller. However, some services need to maintain internal asynchronous state (e.g., a connection to a backend, background tasks, or resource pools). This is where poll comes in.

poll()

poll() is the mechanism that allows a service to make progress independently of request execution:

fn poll(&self, cx: &mut Context<'_>) -> Poll<Result<(), Self::Error>>;

It is expected to be called by the executor (or an owning future) as part of the normal Future::poll() cycle.

A service can use poll to:

  • drive internal state machines
  • establish or maintain external resources (e.g., connections)
  • update readiness based on background progress

Crucially, poll is allowed to influence readiness. For example, a service may only become ready once a connection is established, or may transition back to Pending if capacity is exhausted. This makes poll the active side of the service, complementing the otherwise passive call.

shutdown()

shutdown() defines the termination phase of the service lifecycle:

async fn shutdown(&self);

It must be called by the owner of the service (e.g., the Pipeline) when the service is being dropped or taken out of operation.

The purpose of shutdown is to:

  • gracefully terminate background tasks
  • release external resources
  • flush or complete in-flight work

Unlike poll, which is part of steady-state operation, shutdown is a one-time transition that finalizes the service.