🔐 Practical Guide to ZKP: Learn Real Usecase of ZKP with Plonky2

It’s for those who have heard of ZKP but never known the real usecase.

Before We Start

Zero-Knowledge Proof (ZKP) is a technology that proves the truth of a statement without revealing the underlying information. A common example is proving you know a password without showing it.

This article will use the Rust’s fast recursive SNARK framework Plonky2 to build 3 ZKP circuits step by step. By the end of this article, you will understand the following:

  1. How ZKP Circuits Work — Constraints, Witness, Public Inputs
  2. Hash Chain Proof — Proving the order of data processing
  3. State Transition Proof — Proving the update of Merkle tree

🧩 Core Model: Circuit, Prover, Verifier

Let’s understand the core 3 models of ZKP:

Entity What Example
Circuit 📐 Define mathematical constraints Template of Exam Questions — Define how the answer looks like
Prover 🧑‍💻 Generate proof with secret inputs Student who solves the exam
Verifier ✅ Verify validity of proof with public inputs Grader who checks the answer without seeing the solution

Core Concept: The circuit only defines the rules — it doesn’t solve them. The prover supplies the secret answer. The verifier checks that the rules were followed without ever seeing that answer.

🌍 Real World Flow of ZKP: Who Proves, Who Verifies

Let’s see how ZKP is used in the real world:

Flow Chart: Outline of Proof and Verification

┌──────────────────────────────────────────────────────────────────────┐
│ 1. Build Circuit (Developer does it once)                            │
│                                                                      │
│ Define constraints with CircuitBuilder → build() → CircuitData       │
│                                                                      │
│ Output:                                                              │
│   ・CircuitData (circuit definition)                                 │
│   ・VerifierCircuitData (verifier key) → made public                 │
└────────────────────────────────┬─────────────────────────────────────┘
                                 │
                  ┌──────────────┴──────────────┐
                  ▼                             ▼
┌───────────────────────────┐   ┌───────────────────────────┐
│ 2. Prove                  │   │ 4. Verify                 │
│                           │   │                           │
│ = The party who holds     │   │ Verifier = Only sees      │
│   the data                │   │ the result                │
│                           │   │                           │
│ ・Has secret inputs       │   │ ・Receives only the proof │
│ ・Sets secrets in         │   │ ・Sees only public inputs │
│   PartialWitness          │   │ ・Knows nothing about     │
│ ・data.prove(pw)          │   │   secret inputs           │
│   generates proof         │   │ ・data.verify(proof)      │
│                           │   │   → Ok / Error            │
└─────────────┬─────────────┘   └─────────────┬─────────────┘
              │                               │
              │  3. Send proof                │
              │  proof + public_inputs        │
              └──────────────►────────────────┘

Concrete Example: Private Database Update

┌───────────────────┐                    ┌───────────────────┐
│ Prover            │                    │ Verifier          │
│ (Data owner)      │                    │ (Auditor/Contract)│
└────────┬──────────┘                    └────────┬──────────┘
         │                                        │
         │ 1. Update the data                     │
         │    (e.g. change a balance)              │
         │    * This is secret                     │
         │                                        │
         │ 2. Generate ZK proof                   │
         │    prove(secret inputs)                │
         │    → obtain proof                      │
         │                                        │
         │ 3. Send proof ───────────────────────► │
         │    (contains no secret information)     │
         │                                        │
         │                                        │ 4. verify(proof)
         │                                        │    Public inputs only:
         │                                        │    ・old_root → new_root
         │                                        │    ・No idea what changed
         │                                        │    → Ok ✓
         │                                        │
         │                                        │ 5. Update state
         │                                        │    (record new_root)

👀 Point: What Is Public Or Not

Information Prover knows Verifier sees
What changed (value, position) ✅ ❌
Merkle path (sibling nodes) ✅ ❌
Old state root (old_root) ✅ ✅
New state root (new_root) ✅ ✅
Proof ✅ ✅

The verifier only confirms that the state root transition is correct. It never learns what was updated. 🤫

⚙️ Setup: Plonky2 Basic Structure

All Plonky2 circuits starts from same 3 type definitions.

use plonky2::field::goldilocks_field::GoldilocksField;
use plonky2::plonk::config::PoseidonGoldilocksConfig;

const D: usize = 2;                    // Extension degree (always 2 in Plonky2)
type F = GoldilocksField;              // Finite field for arithmetic
type C = PoseidonGoldilocksConfig;     // Hash config (Poseidon over Goldilocks)

And all circuits follows the pattern of the same 3 steps

1. Build:   CircuitBuilder → Define constraints → builder.build() → CircuitData
2. Prove:   PartialWitness → Set secret inputs → data.prove(pw) → Proof
3. Verify:  data.verify(proof) → Ok(()) or Error

Let’s make it run! 🚀

👋 Example 1: “Hello World” Circuit

This first circuit proves “I know two numbers that add up to a specific sum”

Sum is public (Verifier can see it). Two numbers are secret (Verifier can’t see them).

use plonky2::{
    field::{goldilocks_field::GoldilocksField, types::Field},
    iop::{target::Target, witness::{PartialWitness, WitnessWrite}},
    plonk::{
        circuit_builder::CircuitBuilder,
        circuit_data::{CircuitConfig, CircuitData},
        config::PoseidonGoldilocksConfig,
        proof::ProofWithPublicInputs,
    },
};

const D: usize = 2;
type F = GoldilocksField;
type C = PoseidonGoldilocksConfig;

pub struct SimpleCircuit {
    data: CircuitData<F, C, D>,
    a: Target,      // Secret input slot
    b: Target,      // Secret input slot
    sum: Target,    // Made public
}

impl SimpleCircuit {
    pub fn new() -> Self {
        let config = CircuitConfig::standard_recursion_config();
        let mut builder = CircuitBuilder::<F, D>::new(config);

        // Create slots for secret inputs (called "Targets" in Plonky2)
        let a = builder.add_virtual_target();
        let b = builder.add_virtual_target();

        // Define constraint: sum = a + b
        let sum: Target = builder.add(a, b);

        // Make sum visible to the verifier
        builder.register_public_input(sum);

        // Compile the circuit
        let data = builder.build::<C>();
        Self { data, a, b, sum }
    }

    pub fn prove(&self, a: u64, b: u64) -> ProofWithPublicInputs<F, C, D> {
        let mut pw = PartialWitness::new();
        pw.set_target(self.a, F::from_canonical_u64(a));
        pw.set_target(self.b, F::from_canonical_u64(b));
        self.data.prove(pw).unwrap()
    }

    pub fn verify(&self, proof: ProofWithPublicInputs<F, C, D>) -> anyhow::Result<()> {
        Ok(self.data.verify(proof)?)
    }
}

Usage:

let circuit = SimpleCircuit::new();

// Prover: "I know two numbers that add up to 8"
let proof = circuit.prove(3, 5);

// Verifier: "Is this proof valid?" (can't see 3 and 5 — only sees 8)
assert_eq!(proof.public_inputs[0], F::from_canonical_u64(8));
assert!(circuit.verify(proof).is_ok());

🔍 What Happened?

Build Phase                    Prove Phase                   Verify Phase
┌────────────────┐           ┌────────────────┐          ┌──────────────┐
│ builder.add    │           │ pw.set_target  │          │ data.verify  │
│ (a, b)         │           │ (a=3, b=5)     │          │ (proof)      │
│                │           │                │          │              │
│ Define         │    →      │ Set secret     │    →     │ Verify proof │
│ constraint:    │           │ inputs         │          │              │
│ "sum = a + b"  │           │ → generate     │          │ Visible:     │
│                │           │   proof        │          │  sum=8 only  │
│ * No compute   │           │                │          │              │
│  Rules only    │           │ a=3, b=5 are   │          │ Hidden:      │
│                │           │ NOT in proof   │          │  a=3, b=5    │
└────────────────┘           └────────────────┘          └──────────────┘
  1. Build Phase: builder.add(a, b) does not compute a + b. It creates a constraint that says “sum must equal a + b”. The circuit is a template of rules.
  2. Prove Phase: When the prover sets a=3, b=5, Plonky2 generates a cryptographic proof that these values satisfy the constraints.
  3. Verify Phase: The verifier checks the proof. It sees sum=8 in the public inputs, but has no way of knowing a=3 or b=5.

Key point: A Target in Plonky2 is not a variable — it’s a “wire” in the circuit. builder.add(a, b) computes nothing. It just connects two inputs to an addition gate.

🔗 Example 2: Hashchain — Proving Ordered Processing

Alright let’s create something more practical now.
It proves that the final hash is calculated from the underlying items in the right processing order.

Concept

state_0 = hash(0)
state_1 = hash(state_0 || item_0)
state_2 = hash(state_1 || item_1)
state_3 = hash(state_2 || item_2)    ← Final hash (public)

Each step feeds the previous hash into the next.
If any item in the chain is modified, the final hash changes.
The prover proves the chain was computed correctly; the verifier only checks the final hash.

Proof and Verification Flow

  Prover                                   Verifier
  ──────                                   ────────

  Holds secret items:
  items = [item_0, item_1, item_2]
         ↓
  Set secret inputs in circuit:
  pw.set_target(items[0], item_0)
  pw.set_target(items[1], item_1)
  pw.set_target(items[2], item_2)
         ↓
  Generate proof:
  proof = data.prove(pw)
         ↓
  Send proof ──────────────────────────►  Receive proof
  (items are NOT included in proof)        ↓
                                       Extract final hash from
                                       proof.public_inputs
                                         ↓
                                       data.verify(proof) → Ok ✓
                                         ↓
                                       "Does the final hash match
                                        the expected value?"
                                       ← This is business logic (outside the circuit)

Code

use crate::utils::poseidon_hash_out::PoseidonHashOutTarget;

pub struct HashChainCircuit {
    pub data: CircuitData<F, C, D>,
    pub items: Vec<Target>,
}

impl HashChainCircuit {
    pub fn new(chain_length: usize) -> Self {
        let config = CircuitConfig::standard_recursion_config();
        let mut builder = CircuitBuilder::<F, D>::new(config);

        // Create a target (slot) for each item in the chain
        let items: Vec<Target> = (0..chain_length)
            .map(|_| builder.add_virtual_target())
            .collect();

        // Start from hash(0)
        let zero = builder.zero();
        let mut state = PoseidonHashOutTarget::hash_inputs(&mut builder, &[zero]);

        // Chain: for each item, state = hash(state || item)
        for item in &items {
            let inputs = [state.to_vec(), vec![*item]].concat();
            state = PoseidonHashOutTarget::hash_inputs(&mut builder, &inputs);
        }

        // Only expose the final hash — items stay secret
        builder.register_public_inputs(&state.to_vec());

        let data = builder.build::<C>();
        Self { data, items }
    }

    pub fn prove(&self, items: &[u32]) -> ProofWithPublicInputs<F, C, D> {
        let mut pw = PartialWitness::new();
        for (target, item) in self.items.iter().zip(items.iter()) {
            pw.set_target(*target, F::from_canonical_u32(*item));
        }
        self.data.prove(pw).unwrap()
    }
}

Usage:

// Build a circuit for a chain of length 3
let circuit = HashChainCircuit::new(3);

// Prove: "I processed items [1, 2, 3] in this exact order"
let proof = circuit.prove(&[1, 2, 3]);

// Verify: proof is valid and the final hash is in proof.public_inputs
assert!(circuit.data.verify(proof).is_ok());

💡 Why is this useful?

Imagine a database with 10,000 records.
The prover generates a single proof for the entire hash chain. The verifier can confirm that all records were processed correctly by checking just that one proof — no need to recalculate anything.

Usecase Example:

  • 📋 Watch Log: Proof that logs are not manipulated
  • 📦 Batch Process: Proof that bulk transactions are processed in the right order
  • 🔄 Data Pipeline: Proof that the ETL process is processed correctly.

Circuit is nothing but a calculator — hash(hash(hash(0, item0), item1), item2) = final_hash.
The verifier judges whether the final hash matches the expected value.
This separation of concerns — mathematical rules inside the circuit, business logic outside — is the fundamental pattern of ZKP design.

🌳 Example 3: State Transition — Proves Merkle Tree Update

Many systems store data in a Merkle tree.
State Transition Proof proves “I updated a leaf of the tree and the value of the root has changed from old_root to new_root“

The verifier only sees the two root values.
Which leaf was changed, and what the old or new value was, is never revealed.

Merkle Tree Update Root

                    Merkle Tree (height=2, 4 leaves)

            Before Update                       After Update
          old_root                            new_root
           /                                  /    
         h01     h23                         h01     h23
        /      /                          /      /   
      [10] [20] [30] [40]               [10] [99] [30] [40]
             ↑                                  ↑
          index=1                            index=1
          old_value=20                       new_value=99


  What the Prover knows          What the Verifier sees
  ────────────────────          ──────────────────────
  ・index = 1                   ・old_root
  ・old_value = 20              ・new_root
  ・new_value = 99              ・proof (cryptographic)
  ・Merkle path (sibling nodes)
  ・old_root, new_root

Code

pub struct StateTransitionCircuit {
    pub data: CircuitData<F, C, D>,
    old_leaf: Target,
    new_leaf: Target,
    index: Target,
    merkle_proof: MerkleProofTarget<Target>,
    old_root: PoseidonHashOutTarget,
    new_root: PoseidonHashOutTarget,
}

impl StateTransitionCircuit {
    pub fn new(height: usize) -> Self {
        let config = CircuitConfig::standard_recursion_config();
        let mut builder = CircuitBuilder::<F, D>::new(config);

        let old_leaf = builder.add_virtual_target();
        let new_leaf = builder.add_virtual_target();
        let index = builder.add_virtual_target();
        let merkle_proof = MerkleProofTarget::<Target>::new(&mut builder, height);
        let old_root = PoseidonHashOutTarget::new(&mut builder);
        let new_root = PoseidonHashOutTarget::new(&mut builder);

        // Constraint 1: old_leaf at this index produces old_root
        merkle_proof.verify::<F, C, D>(&mut builder, &old_leaf, index, old_root);

        // Constraint 2: compute root from new_leaf with same index and siblings → computed_new_root
        let computed_new_root =
            merkle_proof.get_root::<F, C, D>(&mut builder, &new_leaf, index);

        // Constraint 3: computed root must match the provided new_root
        computed_new_root.connect(&mut builder, new_root);

        // Public inputs: only the two roots
        builder.register_public_inputs(&old_root.to_vec());
        builder.register_public_inputs(&new_root.to_vec());

        let data = builder.build::<C>();
        Self { data, old_leaf, new_leaf, index, merkle_proof, old_root, new_root }
    }
}

The prover sets the witness (secret inputs):

fn prove(
    &self,
    tree: &mut MerkleTree<u32>,
    leaf_index: u64,
    old_value: u32,
    new_value: u32,
) -> ProofWithPublicInputs<F, C, D> {
    // Get old state
    let proof = tree.prove(leaf_index);
    let old_root = tree.get_root();

    // Update the tree
    tree.update_leaf(leaf_index, new_value.hash());
    let new_root = tree.get_root();

    // Set all secret witnesses
    let mut pw = PartialWitness::new();
    pw.set_target(self.old_leaf, F::from_canonical_u32(old_value));
    pw.set_target(self.new_leaf, F::from_canonical_u32(new_value));
    pw.set_target(self.index, F::from_canonical_u64(leaf_index));
    self.merkle_proof.set_witness(&mut pw, &proof);
    self.old_root.set_witness(&mut pw, old_root);
    self.new_root.set_witness(&mut pw, new_root);

    self.data.prove(pw).unwrap()
}

Usage:

// Create a Merkle tree with 4 leaves
let mut tree = MerkleTree::<u32>::new(2);  // height=2 → 4 leaves
tree.update_leaf(0, 10u32.hash());
tree.update_leaf(1, 20u32.hash());
tree.update_leaf(2, 30u32.hash());
tree.update_leaf(3, 40u32.hash());

let circuit = StateTransitionCircuit::new(2);

// Prove: "I changed leaf 1 from 20 to 99"
let proof = circuit.prove(&mut tree, 1, 20, 99);

// Verify: the root transition is correct
circuit.data.verify(proof).expect("should verify");

🤥 Can you deceive?

When a prover tries to cheat — e.g. claiming the old value was 999 when it was actually 20 — the Merkle path won’t match the old_root, and proof generation itself fails.
It’s impossible to generate a valid proof for a false statement. 🛡️

// Panics — you can't prove a lie
let result = std::panic::catch_unwind(|| {
    circuit.prove(&mut tree, 1, 999, 50);  // 999 ≠ actual value
});
assert!(result.is_err());

🧱 Overall Picture: How To Combine the Patterns

The three patterns above are useful on their own, but they become truly powerful when combined.

Combining the Patterns

┌────────────────────────────────────────────────────────────────┐
│                                                                │
│  Prover (the party who holds the data)                         │
│  ━━━━━━━━━━━━━━━━━━━━━━━━━━━━━━━━━━━━                         │
│                                                                │
│  Step 1: Prove individual operations                           │
│  ┌──────────────────────────────────────────────────────┐      │
│  │                                                      │      │
│  │  ┌────────────────┐  ┌────────────────┐              │      │
│  │  │ Operation A    │  │ Operation B    │  ...         │      │
│  │  │                │  │                │              │      │
│  │  │ State          │  │ State          │              │      │
│  │  │ Transition     │  │ Transition     │              │      │
│  │  │ (Merkle tree)  │  │ (Merkle tree)  │              │      │
│  │  └───────┬────────┘  └───────┬────────┘              │      │
│  │          │ proof_a           │ proof_b                │      │
│  └──────────┼───────────────────┼───────────────────────┘      │
│             │                   │                               │
│             ▼                   ▼                               │
│  Step 2: Chain the proofs together (hash chain)                │
│  ┌──────────────────────────────────────────────────────┐      │
│  │                                                      │      │
│  │  hash(hash(hash(0, proof_a), proof_b), ...)          │      │
│  │    = final_hash                                      │      │
│  │                                                      │      │
│  └─────────────────────────┬────────────────────────────┘      │
│                             │                                  │
│                     Final proof                                │
│                                                                │
└─────────────────────────────┬──────────────────────────────────┘
                              │
                              │  Send proof
                              ▼
┌────────────────────────────────────────────────────────────────┐
│                                                                │
│  Verifier (auditor / smart contract / server)                  │
│  ━━━━━━━━━━━━━━━━━━━━━━━━━━━━━━━━━━━━━━━━━━                   │
│                                                                │
│  verify(proof) → Ok ✓                                         │
│                                                                │
│  Visible:  old_root, new_root                                  │
│  Hidden:   individual operations, data values, account details │
│                                                                │
│  * Verifying just one proof cryptographically guarantees       │
│    the correctness of ALL operations                           │
│                                                                │
└────────────────────────────────────────────────────────────────┘

Role of Each Pattern

Pattern What it proves Example use cases
Hash Chain A sequence of data was processed in the correct order Audit logs, batch processing, data pipelines
State Transition A Merkle tree update was performed correctly Database updates, balance changes, config changes

By combining them:

  • Prove each individual update with a state transition proof
  • Chain those proofs together with a hash chain
  • The verifier checks just one final proof to confirm the correctness of everything

🛠️ Practical Tips

1. 🏎️ Always Build in Release Mode

cargo test --release test_name

Debug mode is orders of magnitude slower. A proof that takes 2 seconds in release can take minutes in debug. 🐢→🐇

2. 🔁 The Circuit Pattern Is Always the Same

struct MyCircuit {
    data: CircuitData<F, C, D>,   // Compiled circuit
    // ... targets (wire slots)
}

impl MyCircuit {
    fn new() -> Self {            // Build phase: define constraints
        let mut builder = CircuitBuilder::<F, D>::new(config);
        // ... add constraints ...
        let data = builder.build::<C>();
    }

    fn prove(&self, ...) {        // Prove phase: set witness
        let mut pw = PartialWitness::new();
        // ... set values on targets ...
        self.data.prove(pw)
    }
}

3. 🔓🔒 Public vs. Secret Is Decided at Build Time

// This value stays secret (only the prover knows it)
let secret = builder.add_virtual_target();

// This value becomes public (verifier can see it)
builder.register_public_input(secret);  // Now it's public

4. ⚠️ Constraints Are Assertions, Not Computations

// This does NOT compute a + b at build time
// It creates a gate with the constraint: sum = a + b
let sum = builder.add(a, b);

// At prove time, if the witness values don't satisfy
// the constraint, proof generation fails

🎬 Wrapping Up

Zero-knowledge proofs aren’t magic. They’re constraint systems wrapped in clever cryptography. The circuit defines the rules, the prover fills in the secret inputs, and the verifier checks the proof without ever seeing those inputs.

With Plonky2:

  • 🔗 Hash Chain — prove that data was processed in the correct order
  • 🌳 State Transition — prove a database update without revealing what changed

The code patterns are consistent and composable. Once you understand CircuitBuilder → PartialWitness → prove → verify, you can stack simple circuits to build arbitrarily complex proof systems. 🧱✨

The code in this article uses the Plonky2 framework — a fast recursive SNARK system built on Poseidon hashing over the Goldilocks field.

Surviving as a Human in the Age of AI

Karpathy freaking out about coding on X

This is a submission for the 2026 WeCoded Challenge: Echoes of Experience

There’s a palpable feeling of anxiety in developer communities right now as concrete programming skills that we have painstakingly built either through study or experience appear to now be … kaput. Outdated. Irrelevant. Passé.

Andrej Karpathy described the feeling of watching his manual coding ability “slowly degenerating,” as a personal sense of loss as AI tools take over coding work: “I’ve already noticed that I am slowly starting to atrophy my ability to write code manually”.source

Karpathy freaking out about coding on X

Ex-Google CEO Eric Schmitt expresses shock at watching AI zip through programming tasks that he used to have to hand-code: “I’ve been doing programming for 55 years. To see something something start and end in front of your own life is really profound.” source

Developers of all stripes are coming to the realization that being “just a coder” is no longer enough; new skills of systems thinking and architecture, plus that vague concept of ‘taste’ are starting to factor heavily in success in this industry. Students, as usual, are quickest to come to this realization, and Computer Science programs are rapidly either evolving or depopulating. Students are also feeling the brunt of this rapid change as narratives they were told as freshmen no longer hold true by the time they reach their senior year.

It’s a tough time to [just] code.

Kristen Bell laughing and crying

Laughs in Humanities PhD.

Plus ça change, plus c’est la même chose [The more things change, the more they remain the same]

A tale of two pathways

Let me tell you a little story. It’s the tale of someone who followed her heart her entire career.

When I was 16, I went to France, and was swept away while visiting Chartres cathedral. True story. Growing up in a pretty privileged environment, with parents encouraging me to follow my dream, I studied for 6 years post-bachelors degree before achieving my PhD in French literature from Cal Berkeley in 1998.

Even during my tenure in graduate school in the 90s, it was clear that Silicon Valley was the hub of some really exciting stuff and that a seismic shift was occurring in the dot-com-boom. But we in our ivory tower looked slightly askance at the fellow in Scandinavian Studies who ditched his PhD program to join a hot startup way back then. We were that confident that our skills would be valued. Anyway Scandinavian Studies is far less relevant than French Studies, everybody knows that.

We of course didn’t realize that humanities PhD programs in the languages are primarily designed to ensure a stream of cost-effective [read: crazy cheap] TAs (GSIs – graduate student instructors, as we called ourselves after unionizing). We were on the front lines of language learning, teaching a section of French 1 or 2 every day, coupled with mandatory pedagogy training, so that Cal undergrads could get through their language requirement. With the hope that we’d be able to graduate and land a tenure-track position, we put up with a lot, relying on this scanty income to keep food on the table and rent checks covered for a room in a West Berkeley two-storey.

Here is some lore: that house on Roosevelt Ave had a can of peaches that had to have been a decade old, a gift from every successive wave of grad students who rented the house. I wonder if it’s still there.

Most of us were unwilling to understand that the academic job market was weak and getting weaker by the year, although there were signs.

monk and dragon

We really didn’t want to hear the gospel

One wake-up call to me was watching a colleague and her husband, after graduating, accept one teaching job between them. Another was watching another colleague getting thinner and thinner as he was quite literally going hungry to cover his family’s expenses while part-time teaching.

Unsurprisingly, given our blinders, the bottom falling out from what was left of the job market, and the other considerable headwinds (I see you, Adjuncting!), the academic job market kicked my rear. Within a few years I threw in the towel and retrained as a web developer, catching that dot-com-boom at its tail end, restarting from scratch. In those days, you could take courses in web design online from Macromedia University, an early training program, and find an entry-level job in a completely new industry.

I worked my way up the corporate ladder (stories for another day) over the subsequent 25 years, but I won’t say that I haven’t yearned every day for what I gave up. Mourning the loss of a dream. Wondering “what might have been”. Reconsidering the choice to pivot every time I hit a career bump, and being tempted to try to go back to some form of teaching. Coping with accusations of having sold out.

Ubi Sunt

This long preamble is meant to emphasize that where you come from will most likely have very little relationship to where you are going in your career in the long run, especially in this fast-moving age of dramatic technical change – much faster and probably even more disruptive than the dot-com-boom of the early 2000s.

The current anxiety and nostalgia permeating the tech discourse boils down to this tweet:

useless

One benefit of having a background in a field other than where you wind up working is that you can lean on your previous knowledge base to bring insights to your work. Because really, there is nothing new here. The sentiment of loss and nostalgic mourning is explored over and over again in literature – the motif even has a name, ‘Ubi sunt’. The 10th century poem The Wanderer expresses this trope with exquisite sadness:

“Where is the horse gone? Where the rider? Where the giver of treasure?
Where are the seats at the feast? Where are the revels in the hall?
[…] How that time has passed away,
grown dark under cover of night, as if it had never been.”

In a world grown old and dark, where is the greatness of our past? And was the past great at all, if it can disappear without a trace, as if it had never existed?

The Wanderer manuscript, from the Exeter Book

The 10th century manuscript containing The Wanderer, the Exeter Book. The word “Eardsteppan” translates to “Wanderer”, in the usual Old English “kenning” where two words are put together to refer to one thing. In this case the “earth stepper” is the wanderer.

In the 15th century in Middle French, François Villon borrows the Ubi Sunt trope to mourn the great ladies of the past, comparing them to those of the present day:

“Where is the very wise Héloïse,
For whom was castrated, and then made a monk,
Peter Abelard in Saint-Denis?
For his love he suffered this sentence.
Similarly, where is the Queen
Who ordered that Buridan
Be thrown in a sack into the Seine?
Oh, where are the snows of yesteryear!”

Villon was a slippery character who had several run-ins with the law, and he seems to be not so much mourning the past as reminding us that returning to it might get you chucked into the Seine.

print edition of Villon's Testament

“Student, poet, housebreaker” – an early print manuscript of Villon’s works from 1489, in Paris BNF.

Still, if 10th century Anglo Saxon poets dwelling in a much more uncomfortable world felt a profound sense of regret for a (probably) even more uncomfortable past, we in our ergonometric chairs battling Cursor also have the right to feel a degree of loss, a “slow degeneration” à la Karpathy. We can perhaps express ourselves using a literary trope that’s over 1000 years old. But we ought to be able to put this anxiety into perspective, as Villon insinuates that we should. This brings me to my second point.

All The Feels

We have the right to feel all the feels that AI is making us feel – sad, useless, confused, stressed at its speed-of-light implementations, upset at the instability in the job market as we are threatened with AI-powered [sic] wave after wave of layoffs, worried for the next generation of early-career folks clawing their way up through the ranks in a very different world.

But I would posit that we, the dispossessed diaspora of ex-Humanities academics, have something to contribute here. We, too, trained for years only to be met with a job market that resolutely turned its back on us. And there isn’t a day that I don’t mourn that this happened, as I mentioned above. But I found ways to cope, and that has been to bring the skills of my own lived and learned experience to bear on an ever-evolving professional landscape.

One coping mechanism for me has been to attempt to bridge these two worlds by bringing the humanities into tech, because the lessons I learned there apply universally – such as those lessons around close reading, translating syntax, and the power of interdisciplinarity.

The Interdisciplinarian

Consider your past experience as a way to inform your present situation. In the near future, tech is going to look very different from how it does now. The job of the programmer will lean into more architecture than hand-coding. But your hard-won skills will still resonate in your day to day activities; rather than becoming obsolete, your programming skills will simply be applied in a different context.

You will have to lean into your accumulation of knowledge, know that parts of it will apply, be ready to learn anew, and accept that the only thing that never changes is the fact that things will change. Well, and also death. And probably taxes.

As Emily Dickinson (whose poetry is well-studied from a data science context) well knew:

All but Death can be
Adjusted ;
Dynasties repaired,
Systems settled in their
Sockets,
Centuries removed, —

Wastes of lives resown
With colors
By superior springs,
Death — unto itself exception —
Is exempt from change.

— 89

To put a corporate stamp on it, the old exhortation to bring your whole self to work applies, now more than ever. The workplace has need of all of us with all of our interesting, strange, diverse, warty, emotional, and overwhelmingly human perspectives as our professions will be shaped increasingly by the collective that is AI. Embrace your interdisciplinarity, lean into it. I wish you great success. And please take care of yourself and each other.

Clean Code vs Shipping Fast: What Actually Matters?

Every developer has faced this at some point.

Do you take time to write this properly…
or do you just ship it?

On one side, you have clean code, best practices, nice structure.
On the other, deadlines, pressure, and getting things out the door.

So what actually matters?

The Honest Answer

Both matter.

But not equally all the time.

The real skill is knowing when to prioritize clean code and when to just ship.

When Shipping Fast Matters More

There are times when speed is the right call:

  • Early-stage features
  • MVPs
  • Tight deadlines
  • Experiments that might get scrapped anyway

In these cases, over-engineering is a waste.

Spending hours making something perfect that might be deleted next week is not good engineering.
It is just slow.

If the code will not live long, it does not need to be perfect.

When Clean Code Matters More

Some parts of your system will stick around:

  • Core business logic
  • Shared components
  • Code other developers will touch often

This is where clean code pays off.

Because messy code here does not just slow you down today.
It slows everyone down tomorrow.

The longer code lives, the cleaner it needs to be.

This Is Not About Being a “Good” or “Bad” Developer

Choosing speed over cleanliness sometimes does not mean you are careless.
Choosing clean code does not mean you are slow.

The real issue is not skill.

It is judgment.

Even experienced developers get this wrong when they either over-engineer everything or rush everything.

A Better Way to Decide

Instead of asking:

Should this be clean or fast?

Ask this instead:

How long will this code live, and who will touch it?

That one question will guide most of your decisions.

Practical Rules I Follow

  • If I need to explain it in a call, the code is too complex
  • If I copy-paste something twice, it is time to refactor
  • If it is an experiment, I ship fast and clean later
  • If multiple people will touch it, I slow down and make it clear
  • If it touches core logic, I do it properly the first time
  • I avoid abstractions until I actually feel the pain
  • I keep things modular so it is easy to find and update
  • If I cannot find something in under 30 seconds, the structure is wrong
  • I optimize only when there is a real problem, not a guess
  • I write code assuming someone else will debug it at 2AM
  • I leave the code slightly better than I found it

You do not need perfect code.

You need code that fits its purpose.

The Middle Ground

Clean code and shipping fast are not enemies.

Good developers know how to balance both:

  • Move fast when it is safe
  • Slow down when it matters

That is what real-world engineering looks like.

Final Thought

Shipping fast gives you progress.
Clean code keeps that progress from collapsing later.

The goal is not to choose one.
It is to know when each one matters.

Securing the Agentic Era: AI Agents as First-Class Security Principals

Securing the Agentic Era: AI Agents as First-Class Security Principals

47 Agents, 6 Approvals

I was looking at a dashboard last month with a security architect I know. We were staring at a list of every AI agent running in her production environment.

The count was 47.

Her team had formally reviewed, pentested, and approved exactly six of them. The other 41 were out there in the wild — shipping traffic, scraping customer data, and chaining API calls. Nobody with a security background had ever looked at their code.

That isn’t an outlier. That is the median enterprise in 2026.

We have spent the last two years treating agents like “advanced chatbots.” We gave them user credentials and hoped for the best. But this week, the industry finally admitted what we’ve all secretly known: an agent isn’t a user, and it isn’t a service account. It’s a new kind of principal, and our current identity stack is completely failing to contain it.

GitHub, Microsoft, Cloudflare, and Scalekit all dropped major architectures this week. They agree on the diagnosis. But the solutions? They are fighting three different wars.

The “Infinite Session” Problem

Here is why your CISO is losing sleep.

When I log into a system, I use OAuth. I click a button, I get a token, I do my work, and eventually, the session dies or I log out. The assumption baked into the protocol is that a human represents the session boundary.

Agents break that assumption.

An agent doesn’t log out. It runs a loop. It takes that OAuth token — which was designed for a 30-minute browser session — and keeps it alive indefinitely. It passes that token to other tools. It explores. It makes decisions I didn’t explicitly authorize.

We handed out master keys to interns who never go home.

82% of executives think their current policies cover this. Meanwhile, only 14.4% of agents shipping today have gone through a real security review. That gap is where the next major breach is going to happen.

Three Philosophies, One Diagram

If you look at the architectures released this week, you’ll see three distinct schools of thought. I’m going to be honest: you can’t mix and match these easily. You have to pick a philosophy.

The Isolationist (GitHub): Trust nothing. Put the agent in a padded cell (chroot jail). Give it zero secrets. If it wants to talk to the outside world, it has to ask a proxy.

The Governor (Microsoft): Register everything. Every agent gets a badge and a file in HR (Agent 365). Centralized control, centralized audit.

The Granularist (OAuth Community): Check every move. You don’t get a session key; you get a single-use ticket for one specific ride.

So, How Do We Actually Build This?

The “Zero-Secret” Container

GitHub’s post-mortem on their Copilot Coding Agent is the most pragmatic thing I read all week. They didn’t try to prompt-engineer their way to safety. They used Linux primitives.

They run the agent in a container with zero secrets. None. The agent literally cannot exfiltrate credentials because it doesn’t have them. Authentication tokens live in a separate proxy container. LLM keys live in a gateway.

The agent says “Open a PR.” The proxy checks if that’s allowed, attaches the token, and sends the request. The agent never touches the raw string.

This is the only way to sleep at night. If you are putting OPENAI_API_KEY in your agent’s environment variables, you have already lost.

The Identity Crisis

Scalekit laid out the identity problem perfectly. We are trying to shove agents into OAuth, and it hurts.

They outlined four patterns, but the one that caught my eye is Capability Tokens. Instead of giving an agent a “Read Email” scope for an hour, you issue a token that can read one specific email and then immediately self-destructs.

It adds latency. It’s annoying to implement. But for high-stakes operations — like transferring money or deleting infrastructure — “ambient authority” is a death sentence. You need per-action authorization.

The Unflushable Data

Cisco made a point that terrified me.

In a traditional breach, if a database gets stolen, you rotate keys, patch the hole, and apologize. You clean up.

But what happens when an attacker injects malicious data into your agent’s context or fine-tuning set? That data becomes part of the model’s weights or its long-term memory vector store. You can’t just DELETE FROM users WHERE id=1. The bad data is now part of the agent’s brain.

Cisco calls this “Data Permanence.” I call it a nightmare. Standard incident response playbooks assume you can scrub the system. With AI, you might have to burn the model down and retrain from scratch.

My Take: Stop Trusting the Model

There is a temptation to use “System Prompts” as security. We tell the model: “You are a helpful agent. Do not delete production databases.”

That is not security. That is a suggestion.

Adversarial research shows that fine-tuning attacks bypass model guardrails 57% to 72% of the time. If your security relies on the LLM being “good,” you have a 60% failure rate baked into your architecture.

The hard truth: You have to move security out of the prompt and into the infrastructure.

If I were building an agent platform today, I would adopt GitHub’s Isolation-first model. Use firewalls. Use read-only filesystems. Use proxy containers for auth.

Yes, the Centralized Governance model (Microsoft) offers better visibility for compliance teams. And yes, Per-Action Auth (Scalekit) is more elegant. But isolation is the only thing that stops a confused agent from becoming an attacker.

The gap between “what the agent should do” and “what the agent can do” is the attack surface. Shrink it.

What You Should Do on Monday

1. Inventory the shadows.
Run a scan. Look for processes calling OpenAI, Anthropic, or Azure OpenAI endpoints. Find the 41 agents your security team doesn’t know about. You cannot secure what you haven’t found.

2. Kill the “Service Account” pattern.
Stop creating generic service accounts for agents. If you have an agent, give it a unique identity. If it gets compromised, you want to revoke that agent’s access, not the access of every automation script in your org.

3. Implement the “Two-Person Rule” for writes.
If an agent wants to merge code, delete resources, or send money, a human should have to click “Approve.” We aren’t ready for fully autonomous write access yet. Not even close.

This isn’t about slowing down innovation. It’s about ensuring that when we look at that dashboard next year, we aren’t terrified of what we see.

Resources

Sources & Attribution

Research findings synthesized from:

  • GitHub Engineering — “Under the Hood: Security Architecture of GitHub Agentic Workflows,” published March 9, 2026.
  • Microsoft Security Blog — “Zero Trust for AI” (March 19), “Secure Agentic AI End-to-End” (March 20), “Observability for AI Systems” (March 20).
  • Scalekit — “API Access Patterns for AI Agents,” published March 16, 2026.
  • Cloudflare Blog — “AI Security for Applications — Now Generally Available,” published March 11, 2026.
  • Cisco Security Blog — “AI Incident Response,” published March 18, 2026.

Key statistics: 82% executive confidence vs 14.4% full security approval rate sourced from enterprise AI security surveys cited in the Microsoft and Cisco posts. Fine-tuning attack bypass rates (72% Claude Haiku, 57% GPT-4o) from adversarial ML research referenced in the GitHub post.

Related Themes

Why AI agents fail at scheduling (and how to fix it)

Your AI agent can draft emails, search the web, summarize a 40-page PDF, and write code. Then someone asks it to “find a time with Sarah and James next week” and it confidently books a slot during Sarah’s all-hands meeting.
This isn’t a reasoning failure. The LLM didn’t get confused. It’s an API design problem — calendar APIs were built for humans navigating UIs, not for agents making sequential tool calls. And the gap between what those APIs expose and what an agent needs to do reliable scheduling is wider than it looks.

The real reason: calendar APIs aren’t built for agents
To find mutual availability for two people using raw Google Calendar or Outlook, an agent has to:

Authenticate with OAuth for each person (more on this in a moment)
Fetch each person’s calendar events for the target week
Parse the free/busy data into usable windows
Cross-reference working hours per timezone
Apply buffer preferences (no back-to-back meetings, no 8am calls)
Rank the resulting slots by quality
Handle pagination if there are many events
Present options in a format the user can act on

That’s 6–8 steps of stateful tool calls before a single time is suggested. Each step is a new opportunity to hallucinate or fail silently.
Most agents either skip steps and guess, or collapse under the complexity of multi-party coordination. Add a third person across a different timezone and the combinatorial complexity quickly exceeds what fits cleanly in a single agent loop.
There are four specific failure modes:

OAuth redirect flows — agents can’t click “Allow.” Every major calendar API requires a browser-based OAuth flow that’s simply incompatible with agentic tool use.
Raw free/busy without scoring — the API gives you busy blocks, not ranked availability. The agent has to invent its own ranking logic or just pick the first open slot.
Timezone math — LLMs are notoriously unreliable at timezone arithmetic. A slot that looks available in UTC might be 11pm for one participant.
Multi-party coordination — four people across three timezones isn’t just harder, it’s categorically different. The intersection of constraints doesn’t fit neatly into a prompt.

What a scheduling API for agents actually looks like
The fix isn’t a smarter agent — it’s an API designed around how agents actually work.
MeetSync is a scheduling API built on four principles:
API key auth, not OAuth. A single header: X-API-Key: your-key. No redirect flows, no token refresh, no browser required.
Explicit timezone offsets in every field. Every datetime in every response includes a full ISO 8601 offset — 2025-09-22T10:00:00-04:00, not 10:00:00. The agent never has to infer a timezone.
UUIDs as stable references. Participants, proposals, and bookings are identified by UUIDs throughout. The agent can reference the same entity across multiple tool calls without re-fetching or re-resolving names.
Scored slot output. Instead of raw free/busy data, findMutualAvailability returns ranked slots with a 0–1 score combining working hours fit (0.5), buffer preference fit (0.3), and daily meeting load (0.2). The agent picks from a ranked list — it doesn’t compute one.
Error responses include a code, message, and details field that tells the agent exactly what failed and how to fix it — not a generic 400.

Five tool calls from “schedule a meeting” to confirmed booking
Here’s what the full flow looks like when an agent receives: “Schedule a 30-minute call with Sarah and James next week.”
Call 1 — Register participants (if not already registered)
createParticipant → { id: “sarah-uuid”, name: “Sarah”, email: “sarah@…” }
createParticipant → { id: “james-uuid”, name: “James”, email: “james@…” }
Call 2 — Find mutual availability
json// Tool call
{
“tool”: “findMutualAvailability”,
“input”: {
“participantIds”: [“sarah-uuid”, “james-uuid”],
“durationMinutes”: 30,
“startDate”: “2025-09-22”,
“endDate”: “2025-09-26”,
“limit”: 5
}
}

// Response
{
“slots”: [
{ “start”: “2025-09-22T10:00:00-04:00”, “end”: “2025-09-22T10:30:00-04:00”, “score”: 0.91 },
{ “start”: “2025-09-22T14:00:00-04:00”, “end”: “2025-09-22T14:30:00-04:00”, “score”: 0.84 },
{ “start”: “2025-09-23T11:00:00-04:00”, “end”: “2025-09-23T11:30:00-04:00”, “score”: 0.79 }
]
}


One call. Ranked results. No availability reasoning required from the agent.

**Call 3 — Confirm with the user, then book**

createBooking → {
organizerParticipantId: “sarah-uuid”,
participantIds: [“james-uuid”],
startTime: “2025-09-22T10:00:00-04:00”,
endTime: “2025-09-22T10:30:00-04:00”
}
The agent’s job throughout is orchestration — not reasoning about calendars. The API handles all the availability intelligence.

Setting it up: MCP server, Claude tool use, LangChain
There are three ways to connect MeetSync to your agent:

  1. MCP server (Claude Desktop and any MCP-compatible agent)
    bashnpx mcp-meetsync
    Set MEETSYNC_API_URL and MEETSYNC_API_KEY as environment variables and all 19 endpoints are immediately available as named tools. No code required.
  2. Claude tool use (TypeScript)
    Define the tools using the JSON schemas in docs/tool-definition.md and pass them to the Anthropic client. The full TypeScript agentic loop is in the tutorial.
  3. LangChain (Python)
    Three @tool functions wrapping the MeetSync endpoints, passed to create_tool_calling_agent. The full Python example with AgentExecutor is in the tutorial.
    Copy-paste definitions for all three are in docs/tool-definition.md.

The proposal workflow: let participants vote before booking
Sometimes the agent is acting on behalf of an organizer who can’t commit for the invitees. In that case, use the proposal workflow instead of booking directly.
It’s two extra tool calls: createProposal with a set of candidate slots, then respondToProposal once per participant to record their preference. Once all participants have accepted the same slot, the proposal moves to accepted and you call createBooking with the proposalId and acceptedSlotId.
This is useful for external meetings, cross-team scheduling, or any situation where the agent shouldn’t make the final commitment unilaterally.

Conclusion
Scheduling fails in agents because the APIs were built for humans. The fix is an API that does the availability intelligence — auth, timezone normalization, slot scoring, error explanations — so the agent only has to orchestrate tool calls and talk to the user.
MeetSync is that API.

Install: npx mcp-meetsync
Full tutorial (worked example, Claude TypeScript + LangChain Python): github.com/nicholasemccormick/mcp-meetsync/docs/tutorial.md
API reference: github.com/nicholasemccormick/mcp-meetsync/docs/README.md

Questions or feedback? Drop them in the comments — happy to help if you’re building something similar.

Building a Production eBPF Observability & Security Stack for Kubernetes in 2026

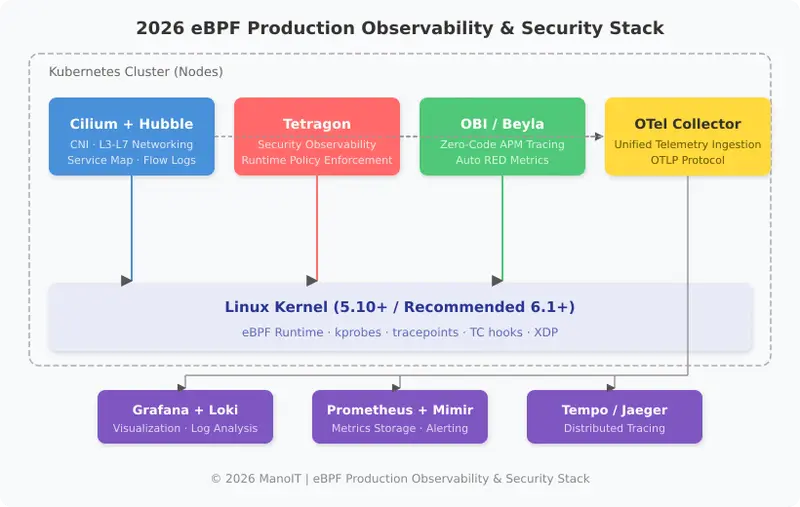
eBPF production stack architecture diagram showing Cilium Hubble for networking, Tetragon for security observability, Beyla OBI for zero-code APM tracing, and OTel Collector feeding into Grafana Loki Prometheus and Tempo backends on Kubernetes

Building a Production eBPF Observability & Security Stack for Kubernetes in 2026

Understanding what’s happening inside a production Kubernetes cluster running thousands of containers remains one of the hardest operational challenges. Attaching sidecar proxies increases resource overhead, and embedding SDKs requires application code changes. eBPF (extended Berkeley Packet Filter) solves this problem at the kernel level. According to the 2026 CNCF Observability Technical Advisory Group (TAG) survey, 67% of teams running Kubernetes at scale have already adopted at least one eBPF-based observability tool in production.

This guide covers everything from the latest announcements at KubeCon EU 2026 to building a complete production observability and security stack with Cilium, Tetragon, Grafana Beyla, and the newly launched OpenTelemetry eBPF Instrumentation (OBI).

Why eBPF Became the Standard for Kubernetes Observability

Let’s start by comparing traditional observability approaches with the eBPF-based approach. The key insight is: “Collect telemetry directly from the kernel without any code changes.”

Comparison Traditional (SDK/Sidecar) eBPF Approach
Instrumentation Embed SDK in app code or deploy sidecar proxy eBPF program in Linux kernel collects automatically
Code Changes Required (import, init, span creation) Not required (zero-code instrumentation)
CPU Overhead 3~8% per Pod (sidecar) Less than 1% per node
Memory Overhead 50~120MB per sidecar Single DaemonSet per node (40~80MB)
Restart Required Pod redeployment needed for SDK changes Applied immediately without Pod restart
Language Support Separate SDK per language (Java, Python, Go, etc.) Kernel-level — supports all languages
Collection Depth Application-level spans/metrics Network flows, syscalls, file I/O, process execution
Security Observability Requires separate security agent Unified security event collection via same eBPF programs

An eBPF program runs just once per node and collects telemetry for every Pod on that node. Even with 100 Pods, you need a single DaemonSet instead of 100 sidecars. This is why eBPF has an overwhelming advantage at scale.

2026 Production eBPF Stack Architecture

The most battle-tested eBPF production stack in 2026 consists of four core components, each with clearly separated responsibilities. All are CNCF projects or part of the CNCF ecosystem.

eBPF production stack architecture diagram showing Cilium Hubble for networking, Tetragon for security observability, Beyla OBI for zero-code APM tracing, and OTel Collector feeding into Grafana Loki Prometheus and Tempo backends on Kubernetes

As shown in the diagram above, Cilium/Hubble handles the network layer, Tetragon handles the security layer, OBI/Beyla handles application tracing, and all telemetry is delivered to backends (Grafana, Prometheus, Tempo) through the OpenTelemetry Collector.

Kernel Version Requirements

Choosing the right kernel version is critical for deploying the eBPF stack in production. The minimum requirement is 5.10 LTS, and the recommended version for 2026 production use is 6.1+.

Distribution / OS Default Kernel CO-RE Support Production Readiness
Ubuntu 24.04 LTS 6.8 Yes Excellent
Amazon Linux 2023 6.1 Yes Excellent
Bottlerocket (AWS) 6.1 Yes Excellent
Container-Optimized OS (GKE) 6.1 Yes Excellent
Ubuntu 22.04 LTS 5.15 Yes Good
RHEL 9 / Rocky 9 5.14 Yes Good
Amazon Linux 2 5.10 Partial Fair

Tip: Using kernel 6.1+ with CO-RE (Compile Once, Run Everywhere) support means you can deploy eBPF programs without recompiling on each node. For EKS, choose Amazon Linux 2023 or Bottlerocket AMI. For GKE, use Container-Optimized OS.

Step 1: Cilium + Hubble — Network Observability

Cilium is an eBPF-based CNI (Container Network Interface) that replaces traditional iptables with L3/L4/L7 network policies and observability capabilities. Hubble is the network observability layer on top of Cilium, providing service map visualization and flow logs.

Installing Cilium (Helm)

# Install Cilium CLI
CILIUM_CLI_VERSION=$(curl -s https://raw.githubusercontent.com/cilium/cilium-cli/main/stable.txt)
curl -L --fail --remote-name-all 
  https://github.com/cilium/cilium-cli/releases/download/${CILIUM_CLI_VERSION}/cilium-linux-amd64.tar.gz
sudo tar xzvfC cilium-linux-amd64.tar.gz /usr/local/bin
rm cilium-linux-amd64.tar.gz

# Install Cilium + Hubble via Helm
helm repo add cilium https://helm.cilium.io/
helm repo update

helm install cilium cilium/cilium --version 1.16.5 
  --namespace kube-system 
  --set hubble.enabled=true 
  --set hubble.relay.enabled=true 
  --set hubble.ui.enabled=true 
  --set hubble.metrics.enableOpenMetrics=true 
  --set hubble.metrics.enabled="{dns,drop,tcp,flow,port-distribution,icmp,httpV2:exemplars=true;labelsContext=source_ip,source_namespace,source_workload,destination_ip,destination_namespace,destination_workload,traffic_direction}" 
  --set prometheus.enabled=true 
  --set operator.prometheus.enabled=true 
  --set kubeProxyReplacement=true

Verifying Hubble Network Flow Observation

# Check Cilium status
cilium status --wait

# Observe real-time flows with Hubble CLI
hubble observe --namespace default --follow

# Filter traffic between specific services
hubble observe 
  --from-namespace production 
  --to-namespace production 
  --to-label app=api-gateway 
  --protocol TCP 
  --verdict FORWARDED

# Filter by HTTP response code (L7 observation)
hubble observe --http-status 500 --namespace production

# Port-forward to Hubble UI for service map visualization
kubectl port-forward -n kube-system svc/hubble-ui 12000:80

Once you access the Hubble UI, you can see real-time service maps of all inter-service traffic in the cluster. L7 protocol-level (HTTP, gRPC, Kafka) request/response metrics are also collected automatically.

Cilium Network Policy Example

# cilium-network-policy.yaml
# L7 HTTP policy from API Gateway to backend services
apiVersion: "cilium.io/v2"
kind: CiliumNetworkPolicy
metadata:
  name: api-gateway-to-backend
  namespace: production
spec:
  endpointSelector:
    matchLabels:
      app: backend-api
  ingress:
    - fromEndpoints:
        - matchLabels:
            app: api-gateway
      toPorts:
        - ports:
            - port: "8080"
              protocol: TCP
          rules:
            http:
              - method: "GET"
                path: "/api/v1/.*"
              - method: "POST"
                path: "/api/v1/.*"
                headers:
                  - 'Content-Type: application/json'

Step 2: Tetragon — Runtime Security Observability

Tetragon is a Cilium sub-project and CNCF project that uses eBPF to observe runtime security events directly from the kernel and enforce policies. It monitors process execution, file access, network connections, and system calls in real time, with the ability to block threats at the kernel level instantly.

Installing Tetragon

# Install Tetragon via Helm
helm repo add cilium https://helm.cilium.io
helm repo update

helm install tetragon cilium/tetragon 
  --namespace kube-system 
  --set tetragon.grpc.address="localhost:54321" 
  --set tetragon.exportFilename="/var/run/cilium/tetragon/tetragon.log" 
  --set tetragon.enableProcessCred=true 
  --set tetragon.enableProcessNs=true

# Install tetra CLI (for event observation)
GOOS=$(go env GOOS)
GOARCH=$(go env GOARCH)
curl -L --remote-name-all 
  https://github.com/cilium/tetragon/releases/latest/download/tetra-${GOOS}-${GOARCH}.tar.gz
sudo tar -C /usr/local/bin -xzvf tetra-${GOOS}-${GOARCH}.tar.gz
rm tetra-${GOOS}-${GOARCH}.tar.gz

TracingPolicy: Detecting Sensitive File Access

# tracing-policy-sensitive-files.yaml
# Detect and block access to sensitive files like /etc/shadow, /etc/passwd
apiVersion: cilium.io/v1alpha1
kind: TracingPolicy
metadata:
  name: sensitive-file-access
spec:
  kprobes:
    - call: "fd_install"
      syscall: false
      args:
        - index: 0
          type: int
        - index: 1
          type: "file"
      selectors:
        - matchArgs:
            - index: 1
              operator: "Prefix"
              values:
                - "/etc/shadow"
                - "/etc/passwd"
                - "/etc/kubernetes/pki"
                - "/var/run/secrets/kubernetes.io"
          matchActions:
            - action: Sigkill   # Immediately terminate the process
            - action: Post      # Send event log

TracingPolicy: Detecting Privilege Escalation

# tracing-policy-privilege-escalation.yaml
# Detect privilege escalation attempts inside containers
apiVersion: cilium.io/v1alpha1
kind: TracingPolicy
metadata:
  name: privilege-escalation-detect
spec:
  kprobes:
    - call: "__x64_sys_setuid"
      syscall: true
      args:
        - index: 0
          type: int
      selectors:
        - matchArgs:
            - index: 0
              operator: "Equal"
              values:
                - "0"   # Attempt to change to UID 0 (root)
          matchNamespaces:
            - namespace: Pid    # Container PID namespace
              operator: NotIn
              values:
                - "host_init_pid"  # Not host init process
          matchActions:
            - action: Sigkill
            - action: Post

Real-time Security Event Observation

# Observe real-time process execution events
kubectl exec -n kube-system ds/tetragon -c tetragon -- 
  tetra getevents -o compact

# Example output:
# process default/nginx-7d8b49557c-x2k9p /bin/sh -c "cat /etc/shadow"
# exit    default/nginx-7d8b49557c-x2k9p /bin/sh -c "cat /etc/shadow" SIGKILL
# -> /etc/shadow access attempt blocked immediately

# Detailed event output in JSON format
kubectl exec -n kube-system ds/tetragon -c tetragon -- 
  tetra getevents -o json | jq '.process_exec | {pod: .process.pod.name, binary: .process.binary, args: .process.arguments}'

# Filter events by specific namespace
kubectl exec -n kube-system ds/tetragon -c tetragon -- 
  tetra getevents -o compact --namespace production

Step 3: OBI / Grafana Beyla — Zero-Code APM Tracing

OpenTelemetry eBPF Instrumentation (OBI) is the zero-code observability solution that Splunk announced in beta at KubeCon EU 2026. Originally developed by Grafana Labs as Beyla, it was donated to the OpenTelemetry project and is now co-developed by Grafana Labs, Splunk, Coralogix, Odigos, and other vendors.

OBI monitors network traffic using eBPF to automatically generate distributed traces and RED metrics (Rate, Errors, Duration). It supports all major languages without code modifications, including Go, Java, Python, Node.js, .NET, Ruby, C/C++, and Rust.

Deploying Beyla DaemonSet

# beyla-daemonset.yaml
apiVersion: apps/v1
kind: DaemonSet
metadata:
  name: beyla
  namespace: observability
  labels:
    app: beyla
spec:
  selector:
    matchLabels:
      app: beyla
  template:
    metadata:
      labels:
        app: beyla
    spec:
      serviceAccountName: beyla
      hostPID: true           # eBPF needs access to host processes
      hostNetwork: true       # Required for network traffic capture
      containers:
        - name: beyla
          image: grafana/beyla:1.9
          securityContext:
            privileged: true    # Required for loading eBPF programs
          env:
            - name: BEYLA_OPEN_PORT
              value: "80,443,3000,8080,8443,9090"  # Ports to observe
            - name: BEYLA_SERVICE_NAMESPACE
              valueFrom:
                fieldRef:
                  fieldPath: metadata.namespace
            - name: OTEL_EXPORTER_OTLP_ENDPOINT
              value: "http://otel-collector.observability:4318"
            - name: OTEL_EXPORTER_OTLP_PROTOCOL
              value: "http/protobuf"
            - name: BEYLA_KUBE_METADATA_ENABLE
              value: "true"     # Auto-tag with Pod/Service metadata
            - name: BEYLA_TRACE_PRINTER
              value: "disabled"  # Disable stdout output in production
          volumeMounts:
            - name: sys-kernel
              mountPath: /sys/kernel
              readOnly: true
      volumes:
        - name: sys-kernel
          hostPath:
            path: /sys/kernel

Advanced Beyla Configuration (ConfigMap)

# beyla-config.yaml
apiVersion: v1
kind: ConfigMap
metadata:
  name: beyla-config
  namespace: observability
data:
  beyla-config.yml: |
    # Network-based auto-discovery
    discovery:
      services:
        - k8s_namespace: production
          k8s_deployment_name: ".*"
        - k8s_namespace: staging
          k8s_deployment_name: ".*"

    # RED metrics configuration
    routes:
      unmatched: heuristic    # Automatic URL pattern grouping
      patterns:
        - /api/v1/users/{id}
        - /api/v1/courses/{id}
        - /api/v1/courses/{id}/lessons/{lessonId}

    # Trace sampling (production cost savings)
    sampler:
      type: parentbased_traceidratio
      ratio: 0.1              # 10% sampling

    # Metrics export
    otel_metrics_export:
      endpoint: http://otel-collector.observability:4318
      protocol: http/protobuf
      interval: 15s

    # Traces export
    otel_traces_export:
      endpoint: http://otel-collector.observability:4318
      protocol: http/protobuf

Step 4: OpenTelemetry Collector — Unified Telemetry Hub

All telemetry collected from eBPF components is delivered to final backends through the OpenTelemetry Collector. The Collector handles data filtering, transformation, and routing, so you don’t need to change your collection infrastructure when swapping backends.

# otel-collector-config.yaml
apiVersion: v1
kind: ConfigMap
metadata:
  name: otel-collector-config
  namespace: observability
data:
  config.yaml: |
    receivers:
      otlp:
        protocols:
          grpc:
            endpoint: 0.0.0.0:4317
          http:
            endpoint: 0.0.0.0:4318

      # Hubble metrics collection (Prometheus scrape)
      prometheus:
        config:
          scrape_configs:
            - job_name: hubble
              kubernetes_sd_configs:
                - role: pod
              relabel_configs:
                - source_labels: [__meta_kubernetes_pod_label_k8s_app]
                  regex: cilium
                  action: keep

    processors:
      batch:
        timeout: 10s
        send_batch_size: 1024
      memory_limiter:
        check_interval: 5s
        limit_mib: 512
        spike_limit_mib: 128
      k8sattributes:
        extract:
          metadata:
            - k8s.namespace.name
            - k8s.deployment.name
            - k8s.pod.name
            - k8s.node.name
        pod_association:
          - sources:
              - from: resource_attribute
                name: k8s.pod.ip

    exporters:
      # Prometheus (metrics)
      prometheusremotewrite:
        endpoint: "http://mimir.observability:9009/api/v1/push"
        tls:
          insecure: true
      # Tempo (traces)
      otlp/tempo:
        endpoint: "tempo.observability:4317"
        tls:
          insecure: true
      # Loki (logs)
      loki:
        endpoint: "http://loki.observability:3100/loki/api/v1/push"

    service:
      pipelines:
        traces:
          receivers: [otlp]
          processors: [memory_limiter, k8sattributes, batch]
          exporters: [otlp/tempo]
        metrics:
          receivers: [otlp, prometheus]
          processors: [memory_limiter, k8sattributes, batch]
          exporters: [prometheusremotewrite]
        logs:
          receivers: [otlp]
          processors: [memory_limiter, batch]
          exporters: [loki]

Troubleshooting: Common Issues and Solutions

Issue 1: eBPF Program Loading Failure

The most common issue is eBPF program loading failure due to kernel version or security settings.

# Symptom: Beyla/Tetragon Pod in CrashLoopBackOff
# Diagnose the cause
kubectl logs -n kube-system ds/tetragon -c tetragon | grep -i "bpf|error|failed"

# Check kernel BTF (BPF Type Format) support
ls /sys/kernel/btf/vmlinux
# If file doesn't exist -> BTF not supported -> Kernel upgrade needed

# Check eBPF capabilities
bpftool feature probe kernel | grep -E "map_type|prog_type|attach_type"

# Fix: Upgrade node kernel (EKS example)
# Change managed node group AMI to Amazon Linux 2023
aws eks update-nodegroup-config 
  --cluster-name my-cluster 
  --nodegroup-name my-nodegroup 
  --launch-template name=my-template,version=2   # Use AL2023 AMI

Issue 2: Hubble Metrics Not Appearing in Prometheus

# Check Hubble metrics activation status
cilium config view | grep hubble

# Verify Hubble relay is healthy
cilium hubble port-forward &
hubble status

# Check Prometheus ServiceMonitor
kubectl get servicemonitor -n monitoring -l app=cilium

# Manually test metrics endpoint
kubectl exec -n kube-system ds/cilium -- 
  curl -s http://localhost:9965/metrics | head -20

# Fix: Explicitly enable Prometheus integration in Helm values
helm upgrade cilium cilium/cilium -n kube-system 
  --set hubble.metrics.enableOpenMetrics=true 
  --set prometheus.enabled=true 
  --set prometheus.serviceMonitor.enabled=true

Issue 3: Beyla Not Capturing Traffic for Specific Services

# Check Beyla discovery logs
kubectl logs -n observability ds/beyla | grep -i "discover|instrument"

# Problem: TLS traffic cannot be decrypted by default
# Fix: Enable uprobe for SSL libraries (Go/Node.js, etc.)
# Add to beyla-config.yml:
#   ssl:
#     enabled: true

# Problem: Service using non-standard ports
# Fix: Add the ports to BEYLA_OPEN_PORT environment variable
kubectl set env ds/beyla -n observability 
  BEYLA_OPEN_PORT="80,443,3000,5432,6379,8080,8443,9090,27017"

Conclusion: eBPF Stack Adoption Roadmap

The eBPF-based observability and security stack is no longer experimental technology in 2026. With Splunk officially announcing the OBI beta at KubeCon EU 2026 and Grafana Beyla being donated to the OpenTelemetry project, vendor-neutral standardization is advancing rapidly.

Here’s the recommended roadmap for production adoption:

  1. Week 1-2: Verify and upgrade kernel version (6.1+). Install Cilium + Hubble on staging cluster. Migrate from existing CNI (Calico/Flannel).
  2. Week 3-4: Deploy Tetragon and apply basic TracingPolicies (sensitive file access, privilege escalation detection). Benchmark performance against Falco.
  3. Week 5-6: Deploy Beyla/OBI DaemonSet. Run in parallel with existing SDK-based instrumentation to verify data consistency. Adjust trace sampling ratio.
  4. Week 7-8: Configure OTel Collector pipeline. Build Grafana dashboards. Set up alerting rules. Gradually roll out to production.

Future Outlook: In the second half of 2026, AI-driven threat detection applying ML to Hubble network flow data is planned. Additionally, the new tetragon-python SDK will allow writing eBPF security policies in Python that transpile to bytecode. eBPF is breaking down the boundaries between observability and security, evolving into a unified kernel-level observation platform.

My AI remembered the wrong thing and broke my build. So I built memory governance.

Six weeks ago I gave my AI assistant a memory. It worked. No more re-explaining the project every session. Bugs got fixed once and stayed fixed.

Then it followed a rule from January that I’d overridden in February, and the audio in my video sounded like a robot reading through a tin can.

The old rule said “always apply loudnorm to voice audio.” The new rule said “never do that — it lifts the noise floor.” Both were in memory. Both active. Both ranked the same. The agent grabbed the wrong one and I didn’t catch it until I listened to the export.

330 memories, no idea which ones were still valid

I build YouTube Shorts with my AI assistant. Daily production — voice generation, image prompting, FFmpeg assembly, captions, upload. Over two months, the memory database grew to 330 entries. Bugs, fixes, decisions, settings, voice profiles, pipeline steps.

Some of those entries were battle-tested rules that saved me hours every week. Some were from the first week, when I was still figuring things out, and they were just wrong. The database treated them all the same. No status. No history. No way to tell what was current.

I looked at Mem0, Letta, Mengram. Good at storing and retrieving. None of them answer “is this memory still true, or did something else in this database already replace it?”

Lifecycle states

Every memory now gets a status:

hypothesis  →  active  →  validated
                          deprecated  •  superseded

New observations start as hypothesis. They get promoted when confirmed. They get deprecated when disproven. If a new rule replaces an old one, the old one is marked superseded and points to the replacement.

Deprecated and superseded memories don’t show up in search. The agent only sees current truth.

from agentmem import Memory

mem = Memory()

mem.add(type="decision", title="Never apply loudnorm to voice",
        content="Lifts noise floor. Use per-track volume instead.",
        status="validated")

# Kill the old wrong rule
mem.deprecate(old_rule_id, reason="Causes robotic audio")

# Agent now only sees the correct rule
context = mem.recall("audio processing", max_tokens=2000)

That alone would have prevented the tin-can incident.

1,848 conflicts (then 7)

I ran conflict detection on the full production database.

from agentmem import detect_conflicts

conflicts = detect_conflicts(mem._conn)

First run: 1,848. Matching any two memories that share a few words and contain “never” somewhere is not precise. After tuning — requiring 25% topic overlap and sentence-level negation matching instead of whole-document scanning — it found 7.

All real. Duplicate entries from two different sync runs. A bug stored once as a “decision” and once as a “bug.” Two session snapshots that were never properly superseded. The kind of thing that sits quietly in your database and degrades trust so slowly you don’t notice until your agent does something wrong and you can’t explain why.

Staleness

Every memory now tracks where it came from — the source file, the section heading, and a hash of the content at import time. If the source file changes, the memory is flagged stale.

from agentmem import detect_stale

stale = detect_stale(mem._conn, stale_days=14)
# [decision] "Use atempo 0.90" — Source changed since import (hash mismatch)

I had memories referencing files that had been renamed weeks ago. Rules updated in the markdown source but never re-synced to the database. Without provenance tracking, I’d have never known.

Health score

One number. Can I trust what my agent knows right now.

$ agentmem health

Memory Health: 85/100
Total: 226
By status: validated: 14, active: 198, hypothesis: 12, deprecated: 2
Conflicts: 1
Stale: 3

Penalises conflicts, stale entries, orphaned supersedes, having zero validated memories. If you never explicitly confirm anything, the score reflects that. My production database started at 55.

65 videos later

Before governance: 330 memories, all “active,” 7 hidden contradictions, 104 duplicates. The agent sometimes followed outdated rules. I’d catch it in QA or I wouldn’t.

After: 226 active, 104 properly superseded, contradictions surfaced and resolved. Recall prioritises validated canonical rules over unprovenanced imports.

65 videos built since the governance engine went live. Zero repeated production bugs.

The database isn’t bigger. It’s cleaner. And the agent makes fewer mistakes because what it retrieves is actually right.

Install

pip install quilmem

Open source, local-first, no API keys, no cloud. SQLite underneath. Ships with a CLI, a Python API, and an MCP server with 13 tools that works with Claude Code, Cursor, and Codex.

The governance stuff — lifecycle states, conflict detection, staleness, health scoring, provenance tracking — is all in the free core.

GitHub / Landing page / PyPI

Turn Your Home Server into a NAS — Access Files from Any Device with Samba

In Part 2, we set up Nextcloud with Docker — your own Google Drive with phone auto-backup and desktop sync. That handles cloud-style access perfectly.

But sometimes you just want to drag files into a folder. No browser, no app, no sync client — just open Finder on your Mac (or File Explorer on Windows), and there’s your server, looking like any other drive.

That’s what Samba does. It turns your home server into a NAS (Network Attached Storage) that any device on your network can access natively.

What you’ll have after this guide:

  • Your server’s folders visible in Mac Finder / Windows File Explorer
  • Drag-and-drop file transfer at full network speed
  • Auto-mount on startup so the drive is always there
  • Nextcloud and Samba sharing the same storage — files added via either method are visible in both
  • Remote NAS access via Tailscale (set up in Part 4)

Let’s set it up.

How Samba and Nextcloud work together

This is important to understand before we start. Both Nextcloud and Samba will point to the same storage directory (/srv/nas). This means:

  • Upload a photo via Nextcloud’s web interface → it appears in Samba immediately
  • Drop a video into the Samba share from your Mac → Nextcloud can see it after a quick scan

They’re two doors into the same room. Nextcloud gives you the cloud experience (browser, apps, sharing links). Samba gives you the local network experience (Finder, drag-and-drop, raw speed).

💡 When you add files via Samba, Nextcloud won’t detect them automatically. You’ll need to run a quick scan command. I’ll cover this at the end.

Step 1: Install Samba

SSH into your server and install Samba:

sudo apt install samba -y

Verify it’s installed:

smbd --version

You should see something like Version 4.x.x. Samba is now installed but not configured yet.

Step 2: Create a Samba password

Samba uses its own password system, separate from your Linux login. Create a Samba password for your user:

sudo smbpasswd -a your-username

Replace your-username with your actual Linux username. It’ll ask you to set a password — this is what you’ll enter when connecting from your Mac or PC. It can be different from your Linux password.

Step 3: Configure Samba shares

Open the Samba config file:

sudo nano /etc/samba/smb.conf

Scroll to the bottom and add your shared folders:

[NAS]
   path = /srv/nas
   browseable = yes
   read only = no
   valid users = your-username
   create mask = 0644
   directory mask = 0755
   force user = www-data
   force group = www-data

[Photos]
   path = /srv/nas/photos
   browseable = yes
   read only = no
   valid users = your-username
   create mask = 0644
   directory mask = 0755
   force user = www-data
   force group = www-data

[Videos]
   path = /srv/nas/videos
   browseable = yes
   read only = no
   valid users = your-username
   create mask = 0644
   directory mask = 0755
   force user = www-data
   force group = www-data

Let me explain the key settings:

  • path — the directory to share
  • browseable = yes — makes it visible when browsing the network
  • read only = no — allows writing (uploading files)
  • valid users — only this user can access the share
  • force user / force group = www-data — this is critical. Nextcloud runs as www-data, so any file created via Samba must also be owned by www-data. Without this, Nextcloud can’t read files you add through Samba.

Save and exit (Ctrl+X, then Y, then Enter).

Step 4: Set permissions

Make sure the storage directory has the right ownership:

sudo chown -R www-data:www-data /srv/nas
sudo chmod -R 775 /srv/nas

This ensures both Nextcloud (running as www-data) and Samba can read and write to the same files without permission conflicts.

Step 5: Restart Samba

sudo systemctl restart smbd
sudo systemctl enable smbd

The enable command ensures Samba starts automatically after reboots.

Verify it’s running:

sudo systemctl status smbd

You should see active (running) in green.

Step 6: Open firewall ports

If you’re running UFW (which you should be — we’ll set it up properly in Part 5), allow Samba traffic:

sudo ufw allow 137/udp
sudo ufw allow 138/udp
sudo ufw allow 139/tcp
sudo ufw allow 445/tcp

These are the standard ports Samba uses for NetBIOS and file sharing.

Step 7: Connect from Mac

  1. Open Finder
  2. Press Cmd+K (or click Go → Connect to Server)
  3. Type: smb://192.168.1.100 (replace with your server’s IP)
  4. Click Connect
  5. Select Registered User
  6. Enter your username and the Samba password you created in Step 2
  7. Select which shares to mount: NAS, Photos, Videos
  8. Click OK

Your server’s folders now appear in the Finder sidebar under “Locations.” You can drag files in, open them directly, and treat it exactly like a USB drive — except it’s over your network.

Auto-mount on Mac startup

So you don’t have to reconnect every time:

  1. Connect to the NAS using the steps above
  2. Go to System Settings → General → Login Items
  3. Click + under “Open at Login”
  4. Navigate to Network → your server IP → select the NAS folder
  5. The drive now mounts automatically every time your Mac starts

Step 8: Connect from Windows

  1. Open File Explorer
  2. Click the address bar at the top
  3. Type: \192.168.1.100 (backslashes, not forward slashes)
  4. Press Enter
  5. Enter your username and Samba password
  6. Check “Remember my credentials” if you want auto-login
  7. Your shares appear as network folders

Map as a network drive (auto-mount):

  1. Right-click on the share folder
  2. Click Map network drive
  3. Choose a drive letter (e.g., Z:)
  4. Check Reconnect at sign-in
  5. Click Finish

Your server now shows up as Drive Z: in File Explorer, permanently.

Step 9: Sync Samba files with Nextcloud

When you add files through Samba (drag-and-drop from Mac/PC), Nextcloud doesn’t know about them yet. You need to tell Nextcloud to scan for new files:

docker exec -u www-data nextcloud php occ files:scan --all

This scans the entire storage directory and adds any new files to Nextcloud’s index. Takes a few seconds for small changes, longer for thousands of files.

Make it automatic

If you’re regularly adding files via Samba, set up a cron job to scan every 15 minutes:

crontab -e

Add this line:

*/15 * * * * docker exec -u www-data nextcloud php occ files:scan --all > /dev/null 2>&1

Now Nextcloud automatically picks up any files you add through Samba within 15 minutes.

Step 10: Bulk transfer — the fastest way to load your server

If you have hundreds of gigabytes of photos and videos to move onto your server, Samba is by far the fastest method. Here’s the recommended approach:

  1. Connect via Samba from your Mac or PC (Steps 7 or 8)
  2. Drag and drop your files into the appropriate folders (photos → Photos, videos → Videos)
  3. Wait for transfer to complete — local network transfers are fast, typically 50-100 MB/s over WiFi, faster over Ethernet
  4. Run the Nextcloud scan once the transfer is done:
docker exec -u www-data nextcloud php occ files:scan --all

This is much faster than uploading through Nextcloud’s web interface, which has overhead from HTTP and PHP processing.

💡 Transferring a large collection? Use an Ethernet cable for the transfer if possible — you’ll see 2-3x faster speeds compared to WiFi. A Cat 6 Ethernet cable costs practically nothing and makes a big difference for bulk transfers.

Troubleshooting

Can’t see the server in Finder/File Explorer?

  • Make sure you’re on the same WiFi network as the server
  • Try connecting directly via IP: smb://192.168.1.100 (Mac) or \192.168.1.100 (Windows)
  • Check Samba is running: sudo systemctl status smbd

“Permission denied” when writing files?

  • Check ownership: ls -la /srv/nas/ — files should be owned by www-data
  • Fix permissions: sudo chown -R www-data:www-data /srv/nas
  • Make sure your smb.conf has force user = www-data

Files added via Samba not showing in Nextcloud?

  • Run the scan: docker exec -u www-data nextcloud php occ files:scan --all
  • Or wait for the cron job if you set one up

Connection drops after Mac sleep?

  • This is normal. The Mac disconnects SMB shares when it sleeps. It should auto-reconnect when it wakes up if you set up auto-mount (Step 7). If not, just press Cmd+K and reconnect.

Slow transfer speeds?

  • Switch to a wired connection. WiFi has overhead and interference. An Ethernet connection will give you significantly faster and more reliable transfers.

What you should have now

After following this guide:

✅ Samba installed and configured with NAS, Photos, and Videos shares
✅ Mac or Windows PC sees your server as a network drive
✅ Drag-and-drop file transfer at full network speed
✅ Auto-mount on startup so the drive is always there
✅ Nextcloud synced with Samba via manual scan or cron job
✅ A complete NAS setup using hardware you already own

Between Nextcloud (Part 2) and Samba (this guide), you now have two ways to access your files:

Method Best for Speed
Nextcloud (browser/app) Remote access, phone backup, sharing links Good
Samba (Finder/Explorer) Bulk transfers, local file access, drag-and-drop Fast

Use both. They complement each other perfectly.

What’s next

Right now, everything works on your home network. But what about when you’re not home?

🌐 Part 4: Access your server from anywhere — Set up Tailscale for private encrypted access, get an Oracle Free VPS, configure frp tunneling to bypass CGNAT, set up Nginx and SSL, and point your custom domain to your home server. After Part 4, you’ll access your NAS from anywhere in the world.

🔒 Part 5: Security hardening + lessons learned — UFW firewall, Fail2Ban, SSH hardening, monitoring, and everything I wish I’d known before starting.

All config files from this series are available in the companion GitHub repo:
👉 github.com/sasrath/homecloud

Hit Follow if you don’t want to miss Part 4 — that’s the one where everything comes together. Drop a comment if you hit any issues with the Samba setup.

Your server is now a NAS. Next up: accessing it from anywhere in the world. 🌐

Discord Open Sources Osprey Safety Rules Engine Processing 2.3 Million Rules per Second

Model Context Protocol MCP hero banner — dark tech network hub connecting AI agents to databases, APIs and tools

Discord open-sourced Osprey, a safety rules engine processing 400 million daily actions and 2.3 million rules per second. Osprey uses a polyglot architecture: a Rust coordinator manages traffic, while stateless Python workers execute logic using a Python-based domain-specific language called SML. This design allows trust and safety teams to deploy real-time threat mitigations at high scale.

By Patrick Farry