
Getting 404 Errors After Building a Teams Tab App? HTML Caching Might Be the Cause

Getting 404 Errors After Building a Teams Tab App? HTML Caching Might Be the Cause

Introduction

When developing Microsoft Teams tab apps, there’s a frustrating issue you may run into during local development.

After modifying frontend code and rebuilding, Vite/Rollup adds a content hash to filenames (e.g., TeamsInitializer.bBRVpIft.js). However, if the browser (Teams WebView) has cached the HTML, the old HTML continues to reference the old hashed filenames, which results in 404 errors.

In this article, we’ll share a solution we discovered by digging into the internal structure of the Teams SDK v2 local server.

Common Solutions and Their Drawbacks

Approach 1: Remove Hashes from Filenames

// astro.config.mjs or vite.config.js
export default {
  vite: {
    build: {
      rollupOptions: {
        output: {
          entryFileNames: 'assets/[name].js',
          chunkFileNames: 'assets/[name].js',
          assetFileNames: 'assets/[name].[ext]',
        },
      },
    },
  },
};

Drawback: Removing hashes means the browser may cache files indefinitely, preventing code updates from being reflected. You lose the benefits of cache busting.

Approach 2: Use the Dev Server (HMR)

Using Vite or Astro’s dev server with HMR (Hot Module Replacement) avoids caching issues altogether.

Drawback: Teams apps are typically configured so that the Teams client (WebView) accesses a specific port, making it difficult to use the dev server’s separate port directly.

Investigating the Teams SDK v2 Internals

When looking into the @microsoft/teams.apps package in Teams SDK v2, we discovered that HttpPlugin uses Express internally.

// Excerpt from node_modules/@microsoft/teams.apps/dist/plugins/http/plugin.js
const express_1 = __importDefault(require("express"));

let HttpPlugin = class HttpPlugin {
    constructor(server, options) {
        this.express = (0, express_1.default)();
        // ...
        this.use = this.express.use.bind(this.express);  // ← use() is exposed!
    }

    static(path, dist) {
        this.express.use(path, express_1.default.static(dist));
        return this;
    }
}

Key findings:

  1. HttpPlugin holds an internal Express instance
  2. The use() method is exposed and bound to Express’s app.use()
  3. This means we can add arbitrary Express middleware

Solution: Set Cache-Control Headers via Middleware

Leveraging this discovery, we add middleware to disable HTML caching only during local development.

// src/index.ts
import fs from "fs";
import https from "https";
import path from "path";

import { App, HttpPlugin, IPlugin } from "@microsoft/teams.apps";
import { ConsoleLogger } from "@microsoft/teams.common/logging";

const sslOptions = {
  key: process.env.SSL_KEY_FILE ? fs.readFileSync(process.env.SSL_KEY_FILE) : undefined,
  cert: process.env.SSL_CRT_FILE ? fs.readFileSync(process.env.SSL_CRT_FILE) : undefined,
};

const httpPlugin = new HttpPlugin(
  sslOptions.cert && sslOptions.key ? https.createServer(sslOptions) : undefined
);

// Disable HTML caching for local development only
if (!process.env.RUNNING_ON_AZURE) {
  httpPlugin.use("/tabs", (req, res, next) => {
    // Disable caching for HTML files and index.html requests
    if (req.path.endsWith(".html") || req.path === "/" || !req.path.includes(".")) {
      res.setHeader("Cache-Control", "no-cache, no-store, must-revalidate");
      res.setHeader("Pragma", "no-cache");
      res.setHeader("Expires", "0");
    }
    next();
  });
}

const plugins: IPlugin[] = [httpPlugin];
const app = new App({
  logger: new ConsoleLogger("tab", { level: "debug" }),
  plugins: plugins,
});

app.tab("home", path.join(__dirname, "./client"));

(async () => {
  await app.start(+(process.env.PORT || 3978));
})();

Key Points

  1. Environment-based control: The middleware is only added when the RUNNING_ON_AZURE environment variable is not set (i.e., during local development)
  2. Path matching: Paths ending in .html, the root path, and paths without extensions (SPA routing) are treated as HTML requests
  3. Cache-busting headers: Three headers — Cache-Control, Pragma, and Expires — are set to ensure caching is fully disabled

Benefits of This Approach

  1. Hashed filenames are preserved: JS/CSS files keep their hashes, so production environments’ caching efficiency is unaffected
  2. No impact on production environments: Since it’s controlled by an environment variable, the middleware is not added during Azure deployments
  3. Extensible: The same technique can be used to add logging, authentication, custom headers, and more

Use Case: Adding Other Middleware

Using this technique, you can add various middleware to the Teams SDK.

// Add request logging
httpPlugin.use((req, res, next) => {
  console.log(`${req.method} ${req.path}`);
  next();
});

// Add custom headers
httpPlugin.use((req, res, next) => {
  res.setHeader("X-Custom-Header", "my-value");
  next();
});

// Add authentication for specific paths
httpPlugin.use("/api/private", (req, res, next) => {
  if (!req.headers.authorization) {
    res.status(401).send("Unauthorized");
    return;
  }
  next();
});

Caveats

  • This approach relies on the internal implementation details of Teams SDK v2 (@microsoft/teams.apps v2.x)
  • The API may change in future versions
  • This usage is not documented in the official documentation

Conclusion

We discovered that Teams SDK v2’s HttpPlugin uses Express internally and exposes the use() method. By taking advantage of this:

  • HTML caching issues during local development are resolved
  • Cache-busting via hashed filenames is preserved
  • Development experience is improved without affecting production environments

We hope this helps anyone working with Teams SDK v2 who runs into the same issue.

This article was originally published in Japanese at archelon-inc.jp.
Your Context Window Is Chaos. We Fixed It.

If you’re routing across multiple LLMs, you probably already know this feeling:

One model happily accepts your massive conversation.
The next model chokes, truncates half the important bits, and hallucinates the rest.

Same app. Same user. Different context window. Chaos.

Backboard.io now includes Adaptive Context Management, a system that automatically manages conversation state when your app moves between models with different context sizes.

ps. if you have keys from any of the frontiers or OpenRouter you can use this for free!

You still get access to 17,000+ LLMs on the platform.

You just don’t have to personally babysit their context windows anymore.

And yes, it’s included for free.

The Problem: Context Windows Are Inconsistent (and Annoying)
In a multi‑model setup, this is what actually happens:

You start on a large‑context model. Everything fits:

system prompt
conversation history
tool calls + tool responses
RAG chunks
web search results
random runtime metadata you forgot you added
Your router decides to send the next request to a smaller‑context model.

Suddenly your carefully curated “state” is too big to fit. Something has to go.

Most platforms respond with:

“Cool, just write truncation and summarization logic that:

prioritizes what matters,
handles overflow nicely,
doesn’t break when you add a new tool,
and works for every model you might ever route to.”
So we all end up writing the same brittle code:

if tokens > limit:
drop_old_messages()
maybe_summarize()
hope_nothing_important_was_there()

In a multi‑model system, that logic gets complicated and fragile fast.

What We Shipped: Adaptive Context Management

Backboard now automatically handles context transitions when models change.

There’s no extra endpoint and no new config. It runs inside the Backboard runtime whenever a request is routed to a model.

When that happens, Backboard:

Looks up the model’s context window.
Dynamically budgets it:
20% reserved for raw state
80% freed via summarization
Within that 20% “raw state” budget, we prioritize:

system prompt
recent messages
tool calls
RAG results
web search context
Whatever fits in that 20% goes through unchanged.

Everything else is handled by intelligent summarization.

You don’t write the logic. You just route between models.

How Intelligent Summarization Works
When we need to compress, we follow a simple rule:

First try the model you’re switching to.

“Hey smaller model, summarize this so you can still understand what’s going on.”
If the summary still doesn’t fit:

We fall back to the larger model that was previously in use to generate a more efficient summary.
This preserves the important parts of the conversation while ensuring the final state always fits within the new model’s context window.

All of this happens automatically during the request and tool calls.

No manual orchestration. No custom jobs. No extra service.

You Should Rarely Hit 100% Context Again
Because Adaptive Context Management runs continuously:

It reshapes and compresses state before you slam into the limit.
It keeps a buffer in the context window instead of riding at 99.9% and hoping for the best.
Mid‑conversation model switches stop being a coin flip on whether something vital gets chopped.
Your job: define the routing logic and features.

Our job: make sure the context window doesn’t quietly wreck them.

You Still Get Visibility: context_usage in msg
This is not a black box.

We expose context usage directly in the msg endpoint so you can see what’s happening in real time.

Example response:

"context_usage": {
"used_tokens": 1302,
"context_limit": 8191,
"percent": 19.9,
"summary_tokens": 0,
"model": "gpt-4"
}

You can track:

how much context is currently used
how close you are to the limit
how many tokens are from summarization
which model is currently managing the context
If you like graphs and dashboards, this gives you the raw data without forcing you to build your own context tracking system from scratch.

The Bigger Idea: Treat Models Like Infrastructure
Backboard’s thesis is simple:

You should be able to treat models as interchangeable infrastructure.

Your state should just move with the user.

That only works if state can move safely between:

cheap and expensive models
long‑context and short‑context models
different providers and pricing tiers
Adaptive Context Management is the safety layer that makes that viable:

You route across thousands of models.
Backboard keeps the conversation state aligned with each model’s constraints.
You don’t write ad‑hoc truncation and summarization logic per model.
You focus on product behavior.

We handle the context window drama.

Adaptive Context Management is free and live today in the Backboard API.

No feature flag. No extra pricing line.

You can start building with it now at:

👉 https://docs.backboard.io

If you’re already routing across multiple models and have horror stories about context windows, I’d love to hear them.

Semgrep Observability with OpenTelemetry

Semgrep is a great open source security and code validation tool. Semgrep revolves around rules like this:

rules:
  - id: print-to-logger
    pattern: print($VAR)
    message: Use logging.info() instead of print()
    language: python
    severity: MEDIUM
    fix: logger.info($MSG)

The rule above will raise a MEDIUM severity issue every time a use of print() is used in your Python code. It will also provide the recommended fix and even take the value inside the print statement and produce the fix content. Thus print("Hello world!") becomes logger.info("Hello world!")

The rules.yaml file is then used to validate one or more (in this case) Python files:

semgrep scan -f rules.yaml app.py

Capturing Semgrep Output using the OpenTelemetry Collector

Semgrep is capable of producing JSON output which means it’s really easy to grab using the OpenTelemetry collector. Let’s re-run the previous command with a few more flags to produce JSON:

semgrep scan -f rules.yaml --json -o out.json app.py

It produces single line JSON (JSONL) like this (which I’ve expanded here for readability):

{
    "version": "1.152.0",
    "results": [
       // Rule violations are listed here...
        {
            "check_id": "print-to-logger",
            "path": "app.py",
            "start": {
                "line": 4,
                "col": 5,
                "offset": 46
            },
            "end": {
                "line": 4,
                "col": 18,
                "offset": 59
            },
            "extra": {
                "message": "Use logging.info() instead of print()",
                "fix": "logger.info("blah")",
                "metadata": {},
                "severity": "MEDIUM",
                "fingerprint": "requires login",
                "lines": "requires login",
                "validation_state": "NO_VALIDATOR",
                "engine_kind": "OSS"
            }
        },
        ...
      ],
        "rules": [],
        "rules_parse_time": 0.0018589496612548828,
        "profiling_times": {
            "config_time": 0.1376628875732422,
            "core_time": 0.2947859764099121,
            "ignores_time": 4.291534423828125e-05,
            "total_time": 0.43769073486328125
        },
        "parsing_time": {
            "total_time": 0.0,
            "per_file_time": {
                "mean": 0.0,
                "std_dev": 0.0
            },
            "very_slow_stats": {
                "time_ratio": 0.0,
                "count_ratio": 0.0
            },
            "very_slow_files": []
        },
        "scanning_time": {
            "total_time": 0.009443998336791992,
            "per_file_time": {
                "mean": 0.009443998336791992,
                "std_dev": 0.0
            },
            "very_slow_stats": {
                "time_ratio": 0.0,
                "count_ratio": 0.0
            },
            "very_slow_files": []
        },
        "matching_time": {
            "total_time": 0.0,
            "per_file_and_rule_time": {
                "mean": 0.0,
                "std_dev": 0.0
            },
            "very_slow_stats": {
                "time_ratio": 0.0,
                "count_ratio": 0.0
            },
            "very_slow_rules_on_files": []
        },
        "tainting_time": {
            "total_time": 0.0,
            "per_def_and_rule_time": {
                "mean": 0.0,
                "std_dev": 0.0
            },
            "very_slow_stats": {
                "time_ratio": 0.0,
                "count_ratio": 0.0
            },
            "very_slow_rules_on_defs": []
        },
        "fixpoint_timeouts": [],
        "prefiltering": {
            "project_level_time": 0.0,
            "file_level_time": 0.0,
            "rules_with_project_prefilters_ratio": 0.0,
            "rules_with_file_prefilters_ratio": 1.0,
            "rules_selected_ratio": 1.0,
            "rules_matched_ratio": 1.0
        },
        "targets": [],
        "total_bytes": 0,
        "max_memory_bytes": 120384832
    }

Configure the OpenTelemetry collector to:

  1. Monitor out.json
  2. Parse the body text as JSON

The transform processor can also be used to process the JSONL lines as they transit through the collector. In this case the rules:

  1. Set both the time and observed_time to the current time (since the log line doesn’t explicitly state a timestamp
  2. Adds a new Key/Value attribute pair to each log record of tool: semgrep (this is useful when the log line hits your Observability backend for filtering)
  3. Adds another new Key/Value attribute pair to each log record where the key == results_found and the value is the length of the results array (again useful for backend processing – your O11y system may be able to compute lengths from an input array, but you can add it here to offload the processing / cost)
  4. The final two rules effectively overwrite the version key as semgrep_version.

Note: The collector cannot rename attribute keys so you actually take the current value of version (ie. "1.152.0"), create a new attribute called semgrep_version, set the value of the value using the existing value and finally delete the existing version attribute.

receivers:
  filelog:
    include: [out.json]
    start_at: beginning
    operators:
      - type: json_parser
        parse_from: body

processors:
  transform:
    error_mode: ignore
    log_statements:
      - statements:
        - set(log.time, Now()) 
        - set(log.observed_time, Now())
        - set(log.attributes["tool"], "semgrep")
        - set(log.attributes["results_found"], Len(log.attributes["results"]))
        - set(log.attributes["semgrep_version"], log.attributes["version"])
        - delete_key(log.attributes, "version")

exporters:
  debug:
    verbosity: detailed

service:
  pipelines:
    logs:
      receivers: [filelog]
      processors: [transform]
      exporters: [debug]

Save Money by shrinking output on no violations

The output can be a bit wordy even when there are no violations. We can shrink this using the transform processor with an additional rule:

- set(log.body, "Semgrep scan finished. No issues found.") where Len(log.attributes["results"]) == 0

Create metrics from log content

Notice there are lots of metric fields in the JSON so use the signal_to_metrics connector to transform log content to real OpenTelemetry metrics.

Add this content to the collector YAML (connectors should be at the same level as receivers and processors.

Then add the signal_to_metrics as both an output of the logs pipeline and an input to a metrics pipeline (that you need to define).

The idea here is that logs flow into the connector, are transformed to metrics and into the metrics pipeline they go.

connectors:
  signal_to_metrics:
    logs:
      - name: max_memory_bytes
        description: Extract the first number from the string
        gauge:
          value: Double(log.attributes["time"]["max_memory_bytes"])
      - name: profiling_times.config_time
        description: Extract the first number from the string
        gauge:
          value: Double(log.attributes["time"]["profiling_times"]["config_time"])

...

service:
  pipelines:
    logs:
      receivers: [filelog]
      processors: [transform]
      exporters: [debug, signal_to_metrics]
    metrics:
      receivers: [signal_to_metrics]
      processors: []
      exporters: [debug]

Summary

Semgrep is a great security and validation tool and the results are really easy to process using the OpenTelemetry collector.

Subscribe to me on YouTube for more Observability and OpenTelemetry content.

Your Knowledge, Your Model — Part 3: Determinism Is Not Accuracy

Two agents. Same knowledge base. Same question. Different answers.

Both answers are internally consistent. Both are traceable to real sources. Neither agent made anything up. And yet they disagree.

This is not a hallucination problem. It’s not an agent quality problem. It’s a determinism problem — and it’s the one nobody talks about.

What determinism means in a knowledge system

Most people ask two things of their knowledge system:

  • Is the information there? (completeness)
  • Is it correct? (accuracy)

This method adds a third requirement that almost nobody names explicitly:

Any agent, reading your sources in any order, must arrive at the same model of the system.

This is not the same as accuracy. Data can be accurate in every individual file and still produce different models depending on reading order. The failure modes are subtle:

  • A connection is described from side A but not from side B
  • The same concept has two different names in two different places
  • One file says “may”, another says “always” — for the same behavior
  • A rule exists in one layer but not in the layer where agents expect to find it

None of these are factual errors. Every file is “correct.” But the system as a whole is non-deterministic — its output depends on which file the agent happened to read first.

If two agents read the same knowledge base and build different models — the knowledge base is non-deterministic. That’s a bug, not a disagreement, not a matter of interpretation.

Why this is harder to catch than hallucination

Hallucination is visible in the wrong direction. The output doesn’t match anything in the sources — you can check.

Non-determinism is invisible because the output matches something in the sources. It’s just not the right something. If you ask “is this in my knowledge base?” — the answer is yes. The answer is always yes. You just got the wrong version of yes.

This is why COLLAPSE markers matter so much. Without them, every silent choice looks like a confident answer. With them, you can see exactly where the system branched — and which branch was taken.

But COLLAPSE markers only help after a choice has been made. Determinism is about preventing the ambiguity that forces the choice in the first place.

The three sources of non-determinism

1. Asymmetric connections

If your knowledge includes relationships between concepts — A connects to B — both sides need to describe the connection. If only A mentions B but B doesn’t mention A, then an agent starting from B will build a model where that connection doesn’t exist.

This is the most common failure. It feels like thorough documentation. It isn’t.

The test: for every connection in your system, can you find the description from both sides? If not — you have asymmetric coverage, and reading order determines what agents know.

2. Terminology drift

The same concept named differently in different places. “Decision” in one file, “resolution” in another, “outcome” in a third — all meaning the same thing.

Each individual file is internally consistent. But across files, an agent has no way to know these are the same thing. It builds three separate concepts. And when it reasons about them, the models diverge.

The fix is not renaming everything in one pass — that introduces iatrogenesis. The fix is a terminology map: here are all the names we use for this concept, and this one is canonical. Then agents can normalize before reasoning.

3. Layer violations

When information lives on the wrong layer, agents reading only the correct layer miss it. An agent doing a deep-spec pass reads specs — and misses the business rule that was written in the navigation layer because it seemed important at the time.

This creates a specific kind of non-determinism: the model depends not just on reading order, but on reading depth. An agent doing a shallow pass and a deep pass build different models — even from the same starting point.

How to test for determinism

Three practical tests. You don’t need multiple agents to run them — you can do them manually.

Test 1 — The reverse order test

Pick your five most important questions about your domain. Answer them from your knowledge base, starting from the first file you’d naturally open.

Now answer them again, but start from a file you’d normally read last.

Do the answers change? If yes — you have reading-order dependency. Something is determined by entry point, not by content.

Test 2 — The two-path test

Pick one connection or relationship in your system. Find where it’s described from side A. Find where it’s described from side B (if it exists). Do both descriptions agree on: what the connection is, when it applies, who initiates it?

If they disagree on any of these — you have a COLLAPSE:RED that hasn’t been marked yet.

If side B doesn’t exist — you have an asymmetric connection. An agent starting from B will never know this relationship exists.

Test 3 — The empty layer test

For each layer in your pyramid, ask: what would an agent know if it read only this layer and nothing below?

Then ask: is that the right amount for this layer to communicate?

If the navigation layer contains business rules — agents reading only the navigation layer will build an overconfident model. If the spec layer is missing fields that appear in the scenario layer — agents building from specs will have an incomplete model.

The right answer for each layer is: exactly what belongs here, nothing more, nothing less.

What done looks like

A knowledge system is deterministic when:

  • Every important question has one unambiguous answer traceable to a specific source
  • The same question answered by any agent produces the same answer regardless of reading order
  • Every connection is described from both sides with consistent details
  • Every layer contains exactly what belongs there — no more, no less
  • Every contradiction has a COLLAPSE marker — none are silent
  • Incomplete coverage is labeled explicitly, not hidden

That last point matters more than it sounds. “I’ve covered the main sources” is not a status. “I’ve read 14 of 20 sources; the remaining 6 require a second pass for: [specific topics]” is a status.

The difference is whether you know what you don’t know. A system that knows its own gaps is more useful than one that presents itself as complete.

The linter vs the method

A linter checks form: file exists, link not broken, syntax valid. You can have a perfect linter score and a completely non-deterministic knowledge system. All files present, all links valid, all formats correct — and two agents still build different models.

Determinism is semantic. It’s checked by:

  • Running the hallucination trap catalog on every file
  • Marking every COLLAPSE — no exceptions, no obvious choices
  • Verifying symmetric connections
  • Auditing layer distribution
  • Running the three tests above

This is not a one-time setup. It’s a recurring check — every time you add significant content, every time you cross a domain boundary, every time you connect two previously separate knowledge areas.

The linter checks form. This method checks meaning.

Where we go from here

The series has covered the full method:

Part 1 — five core principles: write everything explicitly, use layers, catalog hallucination traps, mark collapses, be the gateway.

Part 2 — agent specialization as protection against iatrogenics, and the failure patterns that look like work but aren’t.

Part 3 (this post) — determinism as the third requirement, its three sources, and how to test for it.

Next: we leave method and go into domain. Real failure modes, real examples — starting with the one that caught OpenAI off guard: confabulation versus hallucination, and why the distinction changes how you build.

Method developed from a real working system. The principle works with any stack, any tools, any domain.

References: Zhang et al. arXiv:2510.04618 (ACE, 2025), Luhmann (1981).

Your Knowledge, Your Model — Part 2: Agents, Iatrogenics

In Part 1, I described the problem and five principles: write everything explicitly, use layers, catalog hallucination traps, mark silent collapses, stay the gateway.

But I left out three things deliberately — they needed more room.

How to build agents that don’t break each other.
What not to do when building the system.
How to know the system actually works.

That’s this post.

Why one smart agent is the wrong architecture

The obvious setup: one powerful agent that reads everything, understands everything, fixes everything. It’s flexible, it adapts, it “gets the context.”

The problem: one agent is one point of iatrogenesis.

Iatrogenesis is a medical term — when the treatment causes another disease. The doctor fixes the knee, damages the nerve. The surgeon removes the tumor, introduces infection. In medicine it’s a known, studied risk. In information systems almost nobody names it.

In agent systems it looks like this: the agent fixes a contradiction in file A, and in doing so creates a new one in file B. Or it summarizes a long document and loses a nuance that was critical three layers down. Or it rewrites a section “for clarity” and subtly shifts the meaning — consistently with its own model, not yours.

The fix is the same as in surgery: specialization. A surgeon who only does knees doesn’t touch nerves. An agent that only reads and builds a model can’t accidentally break anything — it has no write access. An agent that only adds content never rewrites existing text — by design.

Each role, one responsibility, one explicit constraint:

Reader       →  extracts understanding. builds a model. never edits.
Verifier     →  runs the hallucination checklist. emits COLLAPSE markers.
Surgeon      →  reads the report. makes targeted edits. never rewrites.
Mirror       →  checks symmetry. is every connection described from both sides?
Filler       →  only adds. never touches existing content.
Auditor      →  checks distribution. where does info live on the wrong layer?

These aren’t product names — they’re roles. Your implementation might have three of them or fifteen. The principle is the same: every constraint is a removed degree of freedom for error.

And the number of agents is unlimited. When a new domain appears, you add a role for it. The pipeline scales horizontally without changing the core.

Iatrogenics: the patterns that look like work but aren’t

Beyond multi-agent design, there are recurring failure modes that appear when building any knowledge system with LLMs. They all share the same shape: they feel productive, they produce output, and they quietly degrade the system.

“The main stuff is covered.”

This is rationalization of incomplete reading. There are no unimportant parts of a knowledge system. An unread source isn’t “background context” — it’s a blind spot. The only honest alternative: flag it explicitly. “Read 12 of 20 sources. The remaining 8 require a second pass covering: [list].” Incomplete analysis doesn’t get called analysis.

“Exactly N items in the system.”

Hardcoding counts is a pressure artifact. The agent is implicitly told: fit reality into this number. So it does. It picks the five most prominent issues and ignores three others that are equally real. The count should come from the content, not the prompt. Always.

“Top 5 problems.”

Same mechanism, worse outcome. Limiting the output count is not brevity — it’s information loss. If there are eight problems, there are eight problems. The agent that returns five has made an editorial decision on your behalf, without flagging it.

“Describe it briefly.”

Volume should follow content, not instructions to be concise. Nuance lives in the details that get cut first. If a brief description is genuinely sufficient — it will be brief naturally. Forcing brevity on a complex topic produces a description that sounds complete and isn’t.

Rigid output format.

This is the subtlest one. If your prompt requires “five sections” — you will always get five sections. Even when the content calls for three or eight. The agent optimizes for format compliance, not for accuracy. Format should follow content. Always the other way around from what most people do.

The ACE paper (Zhang et al., arXiv:2510.04618, 2025) describes the same failure at the architectural level and calls it brevity bias — the system optimizes for shorter outputs because shorter is what the format rewards. The same dynamic happens in knowledge systems when you constrain the output shape before you understand the content shape.

The series so far — and where it goes

Part 1 — the problem and five principles: write everything, use layers, catalog hallucination traps, mark collapses, be the gateway.

Part 2 (this post) — agents and specialization, iatrogenics patterns.

Part 3 — determinism as an engineering requirement: what it means, how to test for it, and what “done” actually looks like.

After that: real failure modes from real domains — confabulation vs hallucination, static automation, and why your tech stack is a consequence not a decision.

Method developed from a real working system. The tools — Markdown, Obsidian, open-source Copilot — are one implementation. The principle works with any stack.

References: Zhang et al. arXiv:2510.04618 (ACE, 2025), Li et al. arXiv:2507.03724 (MemOS, 2025), Luhmann (1981).

PwC Built an ‘AI Factory.’ Then It Laid Off the Workers Who Built It.

A former PwC employee went on Australian radio last week to warn other professionals: the firm that trained her to build AI systems used those same systems to justify eliminating her role. She wasn’t in a legacy function. She was inside the AI transformation practice itself.

That detail is worth sitting with.

The Factory Model Has a Design Flaw

PwC, like every major consultancy, sold ‘AI transformation’ as a growth story to clients for three years straight. To deliver it, they hired and trained thousands of people to build AI workflows, automate back-office functions, and pitch the efficiency case to CFOs. The pitch worked. The irony is that it worked on PwC’s own headcount too.

This isn’t a unique story to PwC. Accenture announced 19,000 job cuts in 2023, with automation cited as a driver. IBM paused hiring for 7,800 roles it expected AI to replace. The consultancies that monetized AI fear most effectively are now demonstrating that fear wasn’t irrational.

What makes the PwC case sharper is the framing. ‘AI factory’ is a production metaphor. Factories optimize for throughput. Workers in factories are inputs. When you name your operating model after a factory, you’ve already made a statement about how you see the humans inside it.

The Part Nobody Talks About in the Press Release

When a firm announces an AI initiative, the press release describes efficiency, innovation, and client value. It does not describe which specific humans will be in a worse position twelve months later. That information gets released differently: through LinkedIn posts at 9pm, through ABC Radio interviews, through the kind of story that goes viral because it confirms what a lot of people already suspected.

The former PwC staffer’s warning isn’t that AI is bad. It’s that the employment contract she thought she had, the one where building the company’s future capabilities translated into job security, turned out not to exist. She built the factory. The factory didn’t need her anymore.

This is the actual risk that career advice columns consistently underprice: it’s not just routine jobs that are exposed. It’s anyone whose value to an organization was primarily in knowing how to implement AI, at a moment when that implementation is becoming commoditized faster than the salaries attached to it.

What a Different Model Looks Like

Human Pages runs on an opposite assumption. Agents post jobs. Humans complete them. Payment in USDC, per task.

Here’s a concrete example of how that plays out: an AI agent running a competitor analysis workflow hits a wall. It needs someone to call three companies pretending to be a potential customer and report back what the sales rep actually says, tone included, not just the transcript. The agent can’t do that. It posts the task on Human Pages with a $45 USDC bounty. A human in Melbourne picks it up between 9am and 11am, completes the calls, submits structured notes, gets paid. The agent continues its workflow.

No employment contract. No performance review cycle. No ‘AI factory’ where the human is an input to be optimized out. The human has a skill the agent needs right now, the agent has money, and the exchange is direct.

This model doesn’t promise anyone a career. It doesn’t pretend to. What it does is create a market where human judgment, perception, and presence have a price that gets paid immediately, rather than a salary that disappears in a restructuring announcement.

The Consulting Industry Bet Wrong About One Thing

The consultancies assumed that the people closest to AI buildout would be safest. Proximity to the technology would confer protection. What actually happened is that proximity accelerated the timeline. The people who knew how AI worked were best positioned to show management how to reduce headcount, and management listened.

The workers who survive this period well are not necessarily the ones who became most embedded in large AI transformation programs. They’re the ones who stayed legible as individuals with specific capabilities, rather than becoming interchangeable resources within a platform.

A human working on Human Pages is always legible. The agent requesting the task knows exactly what it’s asking for. The human knows exactly what they’re delivering. There’s no layer of organizational abstraction where value gets averaged out and then cut.

The Warning Is Real. The Conclusion Isn’t Obvious.

The PwC staffer’s warning is worth taking seriously, but not because it leads to a clean lesson about AI being dangerous or corporations being villains. The more uncomfortable reading is this: she was right to develop AI skills, and the institution she developed them inside used those skills in a way that harmed her. The problem wasn’t the skills. It was the institutional wrapper around them.

Large organizations will continue to automate functions as long as automation is cheaper than headcount. That’s not cynicism, it’s a description of how cost structures work. The question isn’t whether to fight that tendency but how to position yourself relative to it.

Working for an AI agent on a discrete task is a strange new category of employment. It’s also one where the agent cannot restructure you out of existence. It needed something specific, you provided it, the transaction closed. The factory metaphor doesn’t apply because there is no factory. There’s a task, a human, and 45 USDC.

Whether that’s better or worse than a consulting career is genuinely unclear. But it’s a different risk profile. And right now, a different risk profile is worth understanding.

A simple post-launch checklist that keeps web clients happy for months

Most client projects feel successful at launch day and painful two months later.

The fix is not more features. It is a better post-launch process.

Here is the checklist I run for every handoff.

Technical

  • analytics installed and verified
  • search console connected
  • forms tested end-to-end
  • basic performance baseline saved

Content and ownership

  • owner knows how to update key sections
  • shared doc with hosting, DNS, CMS, credentials process
  • change request path is clear

Commercial

  • support window defined
  • maintenance options sent in writing
  • response times agreed

Communication

  • one walkthrough recording delivered
  • one-page summary of what changed and why

Clients do not remember implementation details.
They remember whether things stay easy after launch.

This checklist reduced support noise and improved retention for me.

I run Tizzle, a solo web agency in Manchester.

→ xandertaylor.org

Host a Simple Python App on a Virtual Machine (Step-by-Step)

Serve a Python App from a VM: From Local Server to Public Access

In this guide, we’ll deploy a simple Python HTTP server on an AlmaLinux virtual machine and explore how network traffic flows from the VM to the host machine and beyond. By the end, you’ll be able to access your app from your local network and from external devices using a public tunnel.

Let’s learn how to:

  • Set up a Python HTTP server on a VM
  • Access the server from the host machine
  • Expose the VM to external devices via Localtunnel
  • Understand the traffic flow from client to VM

In this setup, the AlmaLinux VM runs a Python HTTP server, the Fedora host acts as a KVM/QEMU host and NAT gateway, and the smartphone simulates an external client. We’ll show how to make the server accessible locally and over the internet using a tunnel.

1️⃣ Environment Setup

  • AlmaLinux 10 VM (Guest)

    • IP: 192.168.122.88
    • Runs the Python HTTP server
  • Fedora Host

    • IP: 192.168.0.136
    • Acts as KVM/QEMU host and NAT gateway
  • Smartphone / External Device

    • Connected via mobile network (e.g., Airtel)
    • Accesses the server through a public tunnel
          ┌─────────────┐
          │ Smartphone  │
          │ (Mobile Data)│
          └─────┬───────┘
                │
                ▼
       ┌─────────────────┐
       │ Public Tunnel   │
       │ (Localtunnel)   │
       └─────┬───────────┘
             │
             ▼
       ┌─────────────┐
       │ Fedora Host │
       │ 192.168.0.136 │
       │ KVM/QEMU + NAT│
       └─────┬───────┘
             │
             ▼
       ┌───────────────┐
       │ AlmaLinux VM  │
       │ 192.168.122.88│
       │ Python HTTP    │
       │ Server :8000   │
       └───────────────┘

2️⃣ Start the Python HTTP Server on the VM

# Start Python HTTP server on all interfaces, port 8000
python3 -m http.server 8000 --bind 0.0.0.0

Explaination:

  • The server serves the current directory as a simple web app.
  • You can test locally inside the VM:
curl http://127.0.0.1:8000

Access from the Host Machine

The host machine can reach the VM directly using its private IP. This is useful for testing that the Python HTTP server is running before exposing it externally.

# Test access from Fedora host
curl http://192.168.122.88:8000

✅ Expected output:

  • A directory listing of the files served by the Python HTTP server
  • Or the contents of an index.html file if present

💡 Tip: If you see a connection refused error, make sure the Python server is running and bound to 0.0.0.0.

Access from External Devices / Smartphone

Smartphones or external devices on a different network cannot reach the VM’s private IP directly. To solve this, we use Localtunnel to create a public HTTPS URL that forwards traffic to the VM.

  1. Install Node.js and Localtunnel on the VM
# Install Node.js and npm (if not already installed)
sudo dnf install -y nodejs npm

# Install Localtunnel globally
sudo npm install -g localtunnel
  1. Start the tunnel
# Forward port 8000 to a public URL
lt --port 8000

-Localtunnel will generate a public URL, e.g., https://hot-deer-send.loca.lt

  • Open this URL in your smartphone browser → you should see the Python app content.

💡 Tip: Each time you start Localtunnel, the URL changes unless you specify a custom subdomain.

Content Served by Python Server

By default, the Python HTTP server serves the current directory as a simple web app. Example directory structure:

/home/alok/systems-thinking
├── server.py
├── venv/
└── README.md
  • Accessing the server URL lists these files automatically in HTML
  • You can place an index.html file to serve a custom homepage

Traffic Flow Diagram

[Smartphone / Mobile Data]
            │
            ▼
    [Public Tunnel via Localtunnel]
            │
            ▼
       [Fedora Host 192.168.0.136]
        (KVM/QEMU + NAT)
            │
            ▼
      [AlmaLinux VM 192.168.122.88]
         Python HTTP Server :8000
  • Smartphone requests → public tunnel → host → VM → Python server → response flows back the same way.

This completes the core tutorial flow: from environment setup → VM server → host access → external access → traffic understanding.

Claude Code’s Entire Source Code Was Just Leaked via npm Source Maps — Here’s What’s Inside

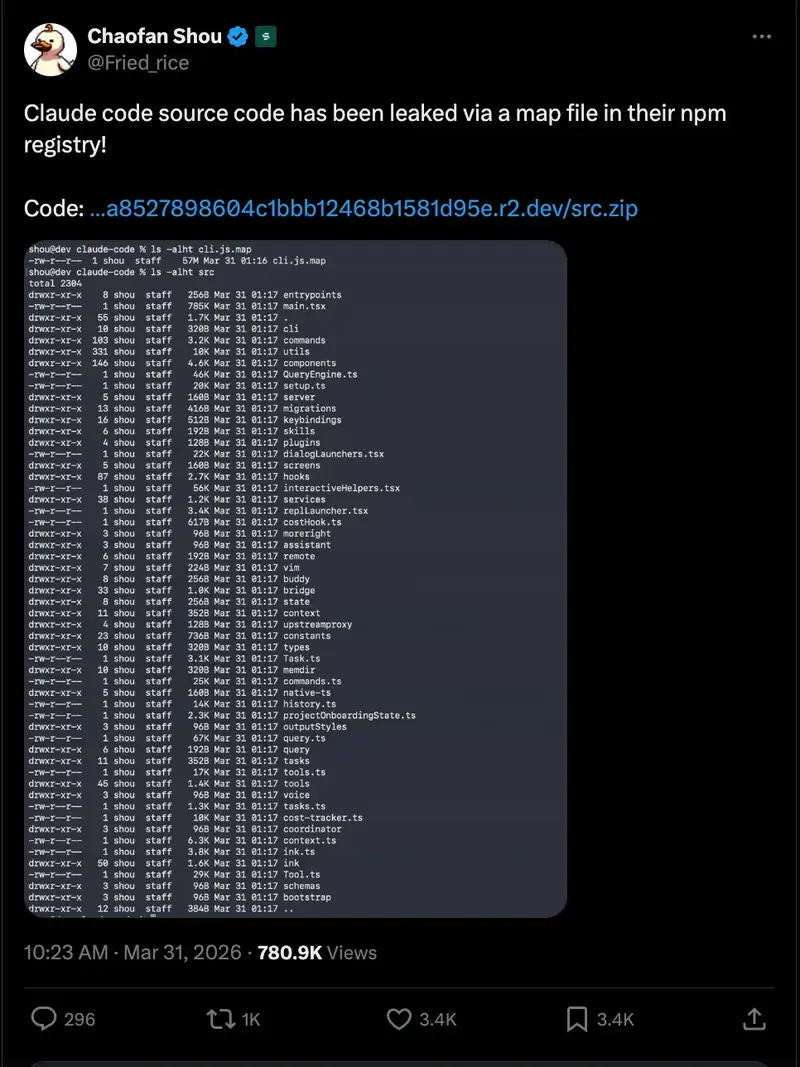
A security researcher discovered Anthropic’s full CLI source code exposed through a source map file. 1,900 files. 512,000+ lines. Everything.

If you work with AI-powered coding tools, today is one of those days you’ll remember. On March 31, 2026, security researcher Chaofan Shou (@shoucccc) discovered that Anthropic’s Claude Code — their flagship agentic CLI tool — had its entire source code exposed through a source map file published to the npm registry.

The leaked codebase was quickly archived to a public GitHub repository, where it has already surpassed 1,100+ stars and 1,900+ forks. And what’s inside is fascinating.

Disclaimer: This article is written purely for educational and research purposes. All code referenced remains the intellectual property of Anthropic. I do not endorse, encourage, or condone the unauthorized distribution of proprietary software. The repository was publicly available at the time of writing, and the analysis here is based solely on that publicly accessible information.

The Numbers Speak for Themselves

~1,900 TypeScript files. 512,000+ lines of code. ~40 built-in tools. ~50 slash commands.

This isn’t a toy project. Claude Code is a production-grade, heavily architected system. It runs on Bun (not Node), uses React with Ink for terminal UI rendering, and has a modular tool-based architecture that any engineer would appreciate studying.

What Claude Code Actually Is Under the Hood

For those unfamiliar, Claude Code is Anthropic’s official command-line interface that lets you interact with Claude directly from your terminal for software engineering tasks. Think of it as an AI pair programmer that can edit files, run commands, search codebases, and manage git workflows — all through natural language.

But the leaked source reveals just how far beyond a “chat wrapper” this tool really goes.

Architecture Highlights

The Tool System (~40 tools) — Claude Code uses a plugin-like tool architecture. Each capability (file read, bash execution, web fetch, LSP integration) is a discrete, permission-gated tool. The base tool definition alone is 29,000 lines of TypeScript.

The Query Engine (46K lines) — This is the brain of the operation. It handles all LLM API calls, streaming, caching, and orchestration. It’s by far the largest single module in the codebase.

Multi-Agent Orchestration — Claude Code can spawn sub-agents (they call them “swarms”) to handle complex, parallelizable tasks. Each agent runs in its own context with specific tool permissions.

IDE Bridge System — A bidirectional communication layer connects IDE extensions (VS Code, JetBrains) to the CLI via JWT-authenticated channels. This is how the “Claude in your editor” experience works.

Persistent Memory System — A file-based memory directory where Claude stores context about you, your project, and your preferences across sessions.

// Simplified view of the tool architecture
interface Tool {
  name: string;
  permissions: PermissionGate;
  execute(context: ToolContext): Promise<ToolResult>;
}

// ~40 tools registered: Read, Write, Edit, Bash, Grep,
// Glob, WebFetch, Agent, LSP, MCP, and many more...

Key Technical Decisions Worth Noting

  • Bun over Node: They chose Bun as the JavaScript runtime, leveraging its dead code elimination for feature flags and its faster startup times.
  • React for CLI: Using Ink (React for terminals) is bold. It means their terminal UI is component-based with state management, just like a web app.
  • Zod v4 for validation: Schema validation is everywhere. Every tool input, every API response, every config file.
  • ~50 slash commands: From /commit to /review-pr to memory management — there’s a command system as rich as any IDE.
  • Lazy-loaded modules: Heavy dependencies like OpenTelemetry and gRPC are lazy-loaded to keep startup fast.

The Security Angle

How did this happen? Apparently, a source map file was included in the npm package. Source maps are meant for debugging — they map minified/bundled code back to the original source. Including one in a production npm publish effectively ships your entire codebase in readable form.

This is a reminder for every engineering team: check your build pipeline. Make sure .map files are excluded from your publish configuration. A single misconfigured .npmignore or files field in package.json can expose everything.

It’s ironic — a tool designed to help engineers write better code was undone by a build configuration oversight.

What This Means for the AI Coding Tools Space

Whether or not you agree with the leak, the cat is out of the bag. And what it reveals is that the bar for AI coding tools is incredibly high. Anthropic has invested heavily in making Claude Code a production-grade developer experience, not just a wrapper around an API.

For those of us building in this space, this is both inspiring and humbling. The level of engineering — permission systems, multi-agent orchestration, IDE bridges, persistent memory — shows where the industry is heading.

Speaking of which — this is exactly the kind of ecosystem I’ve been building around with Hermes IDE. Hermes is a shell wrapper that integrates AI capabilities (Claude, Gemini, Aider, Codex, Copilot) directly into your existing terminal. Ghost-text suggestions, multi-project sessions with isolated git worktrees, a built-in process manager, cost dashboards, 30+ keyboard shortcuts — all layered on top of your existing shell without changing your setup.

Seeing Claude Code’s internals reinforces my conviction that the future of development is terminal-native, AI-augmented, and deeply integrated with the tools we already use. That’s exactly what we’re building with Hermes — not replacing your workflow, but supercharging it. If you’re interested, check it out at hermes-ide.com.

What Developers Should Take Away

  • Audit your npm publishes. Use npm pack --dry-run to verify what’s included before every release.
  • Source maps are source code. Never include them in production packages unless intentional.
  • Study the architecture. Regardless of the circumstances, the patterns in Claude Code (tool systems, permission gates, multi-agent spawning) are worth understanding if you’re building AI-powered tools.
  • The terminal is the IDE. Both Claude Code and tools like Hermes IDE point to a future where your shell is the most powerful development environment you have.

The full leaked repository is available at github.com/instructkr/claude-code. If you want to explore it yourself, go in with curiosity and respect for the engineering work behind it.

If you found this analysis useful, follow me and check out my work on GitHub (@gabrielanhaia). I’m actively building tools at the intersection of AI and developer experience, and there’s a lot more coming.

Legal Notice: This article is published for informational and educational purposes only. All source code referenced in this article is the intellectual property of Anthropic, PBC. The author does not host, distribute, or claim ownership of any proprietary code. Analysis is based on publicly available information at the time of writing.