BMAD-Method: AI-Driven Agile Development That Actually Works (Part 1: Core Framework)

The Problem With AI Coding Tools

You’ve tried Copilot. Maybe Cursor. Perhaps Claude Code. And somewhere along the way, you’ve probably felt that disconnect—the AI writes code for you, but it doesn’t quite get what you’re building.

The result? You spend more time correcting AI-generated code than you would have spent writing it yourself. Or worse, you end up with a codebase that works but nobody—including you—fully understands.

BMAD-Method changes this paradigm entirely.

What is BMAD-Method?

BMAD stands for Breakthrough Method of Agile AI-Driven Development. Unlike traditional AI coding tools that do the thinking for you, BMAD positions AI as a collaborative partner that guides you through structured processes to bring out your best thinking.

Think of it like this: Instead of an AI that writes your code, you get a team of 12+ specialized AI agents who act as expert consultants—a Product Manager who helps you define requirements, an Architect who designs your system, a Developer who implements with you, and a Scrum Master who keeps everything on track.

“Traditional AI tools produce average results because they do the thinking for you. BMad agents guide you through structured processes to bring out your best thinking in partnership with the AI.”

The Philosophy: Scale-Domain-Adaptive Intelligence

One of BMAD’s most powerful concepts is Scale-Domain-Adaptive intelligence. What does this mean practically?

Automatic Complexity Detection

BMAD analyzes your project and adapts its approach accordingly:

  • Bug fix? Use Quick Flow—3 commands and you’re done
  • Simple feature? Tech-spec to implementation in 30 minutes
  • SaaS platform? Full planning with PRD, architecture, epics, and sprints
  • Enterprise system? Add security reviews, compliance checks, and DevOps planning

Domain Awareness

A dating app has different requirements than a medical diagnostic system. BMAD understands this and adjusts:

  • What planning documents you need
  • How detailed your architecture should be
  • What compliance considerations matter
  • How to break down work appropriately

Meet Your AI Team: 12+ Specialized Agents

BMAD comes with a full complement of domain experts:

Agent Role What They Do
PM (Product Manager) Requirements Defines problems, users, MVP scope, creates PRDs
Architect Technical Design System design, technical decisions, architecture docs
Developer (DEV) Implementation Writes code, follows stories, maintains quality
SM (Scrum Master) Process Sprint planning, tracking, retrospectives
Analyst Research Market research, competitive analysis, brainstorming
UX Designer User Experience User flows, wireframes, design systems
QA (Quinn) Testing Test automation, quality validation
DevOps Infrastructure Deployment, CI/CD, infrastructure as code
Security Compliance Security reviews, vulnerability assessment
Tech Lead Code Quality Architecture enforcement, code reviews
Docs Writer Documentation API docs, user guides, README files
Data Analyst Analytics Metrics, dashboards, data modeling

Each agent has:

  • Specialized expertise in their domain
  • Consistent personality across sessions
  • Awareness of other agents’ work
  • Guided workflows they can execute

Two Paths: Quick Flow vs Full Planning

Quick Flow (3 Commands)

For bug fixes, small features, or clear-scope work:

# 1. Analyze codebase and create tech-spec with stories
/quick-spec

# 2. Implement each story
/dev-story

# 3. Validate quality
/code-review

When to use Quick Flow:

  • Scope is clear (1-15 stories)
  • No architectural decisions needed
  • Single developer work
  • Bug fixes and enhancements

Full Planning Path (BMad Method)

For products, platforms, and complex features:

# Phase 1: Analysis (Optional)
/bmad-brainstorming      # Ideation
/bmad-bmm-research       # Market/technical research
/create-product-brief    # Foundation document

# Phase 2: Planning (Required)
/create-prd              # Full requirements document

# Phase 3: Solutioning
/create-architecture     # Technical design
/create-epics-and-stories # Break into work items
/check-implementation-readiness # Validation

# Phase 4: Implementation
/sprint-planning         # Initialize sprint
/create-story → /dev-story → /code-review  # Per story

When to use Full Planning:

  • New products or major features
  • Architectural decisions required
  • Team collaboration
  • 10-50+ stories

Getting Started in 5 Minutes

Prerequisites

  • Node.js v20+
  • An AI IDE (Claude Code, Cursor, Windsurf, etc.)

Installation

# Install BMAD to your project
npx bmad-method install

# Follow the prompts to select:
# - Modules (BMad Method, BMad Builder, etc.)
# - Your AI IDE
# - Configuration options

Your First Workflow

After installation, open your AI IDE in the project folder:

# Not sure what to do? Ask for help!
/bmad-help

# Or ask specific questions:
/bmad-help How should I build a web app for my T-Shirt business?
/bmad-help I just finished the architecture, what's next?

Real-World Example: Building a Todo API

Let’s walk through building a simple REST API using Quick Flow:

Step 1: Quick Spec

You: /quick-spec

BMAD: I'll analyze your project and create a tech specification.
      What are you trying to build?

You: A REST API for todo items with CRUD operations, user auth,
     and PostgreSQL storage.

BMAD: [Analyzes project structure, existing code, tech stack]
      [Generates tech-spec.md with 6 stories]

      Created: _bmad-output/tech-spec.md
      Stories:
      1. Database schema and migrations
      2. User authentication endpoints
      3. Todo CRUD endpoints
      4. Input validation
      5. Error handling middleware
      6. API documentation

Step 2: Implement Stories

You: /dev-story 1

BMAD: [Reads tech-spec, understands story #1]
      [Implements database schema]
      [Creates migration files]
      [Updates story status to completed]

You: /dev-story 2

BMAD: [Reads existing code, understands auth requirements]
      [Implements JWT-based authentication]
      [Creates user model, auth routes, middleware]

Step 3: Code Review

You: /code-review

BMAD: [Reviews all implemented code]
      [Checks for security issues, best practices]
      [Validates against tech-spec requirements]

      ✅ All stories implemented correctly
      ⚠️ Minor: Consider adding rate limiting to auth endpoints
      ⚠️ Minor: Add index on todos.user_id for performance

Why BMAD Works

1. Structure Without Rigidity

BMAD provides guardrails without being prescriptive. You can:

  • Skip optional phases when they don’t add value
  • Load agents directly for specific tasks
  • Run workflows in any order once you’ve learned the flow

2. Context Persistence

Unlike chat-based AI tools, BMAD:

  • Saves all planning documents to files
  • Agents read previous outputs automatically
  • Your architecture informs your stories
  • Your stories guide your implementation

3. Party Mode: Multi-Agent Collaboration

Need multiple perspectives? Party Mode brings agents together:

You: /party-mode PM, Architect, Security

PM: From a product perspective, we need to consider...
Architect: The technical implications of that are...
Security: Before we proceed, let's address these concerns...

4. 100% Free and Open Source

No paywalls. No gated content. No premium Discord channels. BMAD believes in empowering everyone, not just those who can pay.

The Module Ecosystem

BMAD extends through modules:

Module Purpose
BMad Method (BMM) Core framework, 34+ workflows
BMad Builder (BMB) Create custom agents and workflows
Test Architect (TEA) Enterprise test strategy
Game Dev Studio Unity, Unreal, Godot workflows
Creative Intelligence Suite Innovation and brainstorming

Coming Up in This Series

Part 2: Workflows Deep Dive — The 4 development phases, practical walkthroughs, and Party Mode in action.

Part 3: BMad Builder — Creating custom agents for your domain.

Part 4: Creative Intelligence Suite — Innovation workflows and design thinking.

Get Started Today

npx bmad-method install

Join the community:

BMAD-Method represents a fundamental shift in how we work with AI for software development. Instead of AI as a tool that replaces thinking, we get AI as a collaborator that enhances it.

Have questions? Drop them in the comments below!
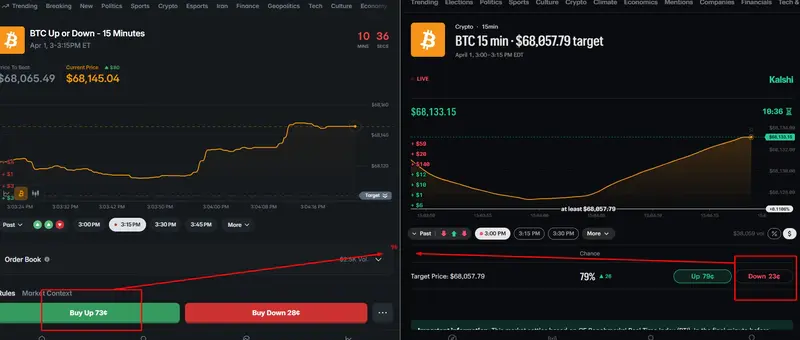
Polymarket Kalshi Arbitrage

A Systematic Strategy for Polymarket × Kalshi Inefficiencies

Abstract

Prediction markets have matured into highly reactive, information-driven trading environments. However, structural fragmentation between platforms creates persistent inefficiencies. This article presents a systematic arbitrage strategy exploiting pricing discrepancies between two major prediction exchanges—Polymarket and Kalshi—within short-duration (15-minute) markets.

We formalize the arbitrage condition, analyze execution risks, and outline a production-grade architecture for building a scalable trading system.

1. Introduction

Prediction markets are designed to converge toward probabilistic truth. Yet in practice, latency, liquidity fragmentation, and differing participant bases lead to temporary mispricings across platforms.

In short-horizon markets (e.g., 15-minute BTC direction), these inefficiencies appear frequently and predictably.

This creates an opportunity:

Simultaneously take opposite positions across two exchanges when pricing becomes inconsistent.

2. Market Structure

Both platforms offer binary outcomes:

  • YES (event occurs) → pays 1
  • NO (event does not occur) → pays 1

Prices represent probabilities:

  • Range: 0 to 1 (or 0–100 cents)

For a given event, the theoretical relationship is:

[
P(YES) + P(NO) = 1
]

However, across exchanges, this relationship often breaks.

3. Arbitrage Condition

Define:

  • ( P_{poly}^{YES} ): Price of YES on Polymarket
  • ( P_{kalshi}^{NO} ): Price of NO on Kalshi

Arbitrage exists when:

[
P_{poly}^{YES} + P_{kalshi}^{NO} < 1
]

4. Profit Guarantee

By entering:

  • Long YES on Polymarket
  • Long NO on Kalshi

You create a market-neutral position.

Payoff:

  • If outcome = YES → Polymarket pays 1
  • If outcome = NO → Kalshi pays 1

Profit:

[
text{Profit} = 1 – (P_{poly}^{YES} + P_{kalshi}^{NO})
]

This payoff is independent of outcome, forming a true arbitrage under ideal execution.

5. Why This Opportunity Exists

5.1 Latency Asymmetry

Polymarket reacts faster to real-time crypto price movements due to:

  • Web3-native infrastructure
  • Integration with crypto-native traders

Kalshi, by contrast:

  • Operates under regulatory constraints
  • Has slower retail-driven order flow

5.2 Liquidity Fragmentation

Order books are independent. Temporary imbalances create mismatched probabilities.

5.3 Market Microstructure Differences

  • Different data feeds
  • Different cutoff rules
  • Different trader demographics

6. Frequency of Opportunity

Empirical observation:

In a typical 15-minute market, this arbitrage condition appears multiple times (≈5+)

These opportunities are short-lived (often seconds), requiring automated execution.

7. Execution Challenges

Despite theoretical purity, practical arbitrage is constrained by:

7.1 Execution Risk

Both legs must fill. Partial fills introduce directional exposure.

7.2 Slippage

Top-of-book prices may not support desired size.

7.3 Fees

Transaction costs reduce or eliminate edge.

Adjusted condition:

[
P_{poly}^{YES} + P_{kalshi}^{NO} < 1 – text{fees}
]

7.4 Resolution Mismatch

Subtle differences in:

  • Price feeds
  • Timestamp cutoffs

Can introduce tail risk.

8. System Architecture

A production-grade arbitrage bot requires:

8.1 Market Matching Engine

Normalize markets across platforms:

  • Asset (BTC, ETH, etc.)
  • Strike price
  • Expiry timestamp

8.2 Real-Time Data Ingestion

  • WebSocket feeds (order books)
  • Latency-optimized pipelines

8.3 Arbitrage Detection Engine

Continuously evaluate:

[
edge = 1 – (P_{poly}^{YES} + P_{kalshi}^{NO})
]

Trigger trades when:

  • Edge > threshold
  • Sufficient liquidity exists

8.4 Execution Engine

  • Asynchronous order placement
  • Fail-safe cancellation logic
  • Partial-fill handling

8.5 Risk Manager

  • Position limits
  • Exposure tracking
  • Exchange-specific constraints

9. Strategy Design

9.1 Conservative (Pure Arbitrage)

  • Enter only when edge exceeds fee-adjusted threshold
  • Execute both legs immediately
  • Lock guaranteed profit

9.2 Hybrid Strategy

  • Enter arbitrage position
  • Delay hedge when directional edge exists
  • Capture both arbitrage + momentum

9.3 High-Frequency Loop

Given recurring opportunities:

  • Scan → Detect → Execute → Repeat
  • Multiple trades per market cycle

10. Optimal Timing

Best windows:

  • Early Phase (0–10 min): High inefficiency
  • Mid Phase (10–13 min): Best balance
  • Late Phase (last 2 min): Fast convergence, lower edge

11. Competitive Edge

Sustainable profitability depends on:

  • Latency advantage
  • Execution reliability
  • Accurate fee modeling
  • Liquidity-aware sizing

This is not purely a pricing strategy—it is an engineering problem.

12. Conclusion

Cross-exchange arbitrage between prediction markets represents a rare intersection of:

  • Market inefficiency
  • Quantitative modeling
  • Low-latency systems design

While the theoretical model is straightforward, real-world profitability depends on execution precision and infrastructure quality.

As prediction markets grow, these inefficiencies will compress. Early movers who build robust systems can capture significant value during this phase of market evolution.

Appendix: Minimal Pseudocode

while True:
    poly_yes = get_polymarket_yes()
    kalshi_no = get_kalshi_no()

    edge = 1 - (poly_yes + kalshi_no)

    if edge > threshold:
        size = min(liquidity_poly, liquidity_kalshi)
        execute(poly_yes, kalshi_no, size)

Final Note

This strategy is simple in concept but demanding in execution.

The opportunity is real—but only for those who can build fast, reliable, and risk-aware systems.

🤝 Collaboration & Contact

If you’re interested in collaborating, exploring strategy improvements, or discussing cross-exchange arbitrage opportunities, feel free to reach out.

I’m especially open to connecting with:

Quant traders
Engineers building trading infrastructure
Researchers in prediction markets
Investors interested in market inefficiencies

📌 GitHub Repository

You can explore the full implementation, strategy logic, and ongoing updates here:
https://github.com/Polymarkety/Polymarket-arbitrage-trading-bot-crypto

💬 Get in Touch

If you have ideas, questions, or would like to collaborate, don’t hesitate to open an issue on GitHub or reach out directly.

Feedback on your repo (based on your description & strategy)

Contact Info

Email
[email protected]

Telegram
https://t.me/BenjaminCup

X
https://x.com/benjaminccup

Creating a space to focus

It’s been a while since I’ve posted to dev.to. I just wanted to let you know if you like my writing I do a weekly newsletter called Practical Betterments.

It’s about one-off actions to improve your life continuously — however marginally.

Currently I’m doing a series on creating a dedicated space to help you with goals that require sustained focus.

You can read the first one here:

Create a dedicated focus nook

Here’s some other tips related to productivity and focus:

Add spaces to the dock on MacOS

Block browser notification requests

Place healthy apps within thumbs reach

Let me know what you think!

Behind the Scenes: How Database Traffic Control Works

Traffic Control checks

By Patrick Reynolds

In March, we released Database Traffic Control™, a feature for mitigating and preventing database overload due to unexpectedly expensive SQL queries. For an overview, read the blog post introducing the feature, and to get started using it, read the reference documentation. This post is a deep dive into how the feature works.

Background

If you already know how Postgres and Postgres extensions work internally, you can skip this section.

A single Postgres server is made up of many running processes. Each client connection to Postgres gets its own dedicated worker process, and all SQL queries from that client connection run, one at a time, in that worker process. When a client sends a SQL query, the worker process parses it, plans it, executes it, and sends any results back to the client. Planning is a key step, in which Postgres takes a parsed query and turns it into a step-by-step execution plan that specifies the indexes to use, the order to load rows from multiple tables, and the operators that will be used to filter, aggregate, and join those rows. Most queries can be run using several different plans, so it’s the planner’s job to estimate the cost of the possible plans and pick the cheapest one.

Every part of how Postgres handles queries can be modified by extensions. Extensions can add new functions, new data types, new storage systems, and new authentication methods, among other things. (They can also add new failure modes, but that’s a topic for another day.) Extensions can also passively observe and report on traffic, like PlanetScale’s own pginsights extension that powers Query Insights.

Much of what Postgres extensions can do, they do using hooks. A hook is a function that runs before, after, or instead of existing Postgres functionality. Want to observe or replace the planner? There’s a hook for that. Want to examine queries as they execute? There are three hooks for that. As of this writing, there are 55 hooks available to anyone writing Postgres extensions.

PlanetScale’s pginsights extension installs hooks for the ExecutorRun and ProcessUtility functions, among others, to run timers and measure resource consumption while SQL statements execute. Since each hook wraps the original Postgres functionality, that means pginsights sees each query just before it executes and again just after it completes. Any time that has elapsed and any resources the worker process has consumed are directly attributable to that query. The extension does some aggregation, sends aggregate data periodically to a data pipeline, and returns control to Postgres to accept the next query.

Insights, hooks, and blocking queries

When we first started planning for Traffic Control, we knew we would use a Postgres extension with a hook on ExecutorRun to decide whether or not each statement would be allowed to run. Initially, we wrote a new extension for this. We soon realized that there are two ways to choose which queries to block: based on static analysis of the individual query, or based on cumulative measurements of resource usage over time. We split the extension along those lines. Blocking based on static analysis got merged into the project that became pg_strict. Blocking based on cumulative resource usage became Traffic Control.

It turns out Traffic Control needed the same hook points and much of the same information that pginsights already had. So rather than duplicate all that code and impose the extra runtime overhead of another extension, we taught pginsights how to block queries.

Traffic Control checks

If there are any Traffic Control rules configured, then at the beginning of each query execution, the extension does four things:

  1. It identifies all of the rules that match the tags and other metadata of the query. Each rule identifies a budget; multiple rules can map to the same budget.
  2. It checks to see if any of the applicable budgets has reached its concurrency limit.
  3. It checks if the query’s estimated cost is higher than any applicable budget’s per-query limit.
  4. It checks to see if every applicable budget has enough available capacity for the query to begin execution. In the documentation, these parameters are described as the burst limit and the server share. As we’ll see below, those parameters combine over time to describe the behavior of a leaky-bucket rate limiter.

If any budget fails any of these checks, then the query is warned or blocked, based on how the budget is configured.

Blocking a query just before it begins execution means the server spends no resources on the query, beyond the cost of the planner and the decision to block it. That’s an improvement over schedulers like Linux cgroups, which let every task begin and simply starve them of resources if higher priority tasks exist in the system. It’s also an improvement over the Postgres statement_timeout setting, which allows any overly expensive query to consume resources until it times out. Traffic Control blocks expensive, low priority queries before they begin.

Cost prediction

I glossed over something important in the last section: cost. The concurrency check is easy, because it just counts worker processes already assigned to the queries associated with a Traffic Control budget. But the other two checks — per-query cost and cumulative cost — require us to know what resources the query will consume before it even begins execution. How do we do that? We trust, but also don’t trust, the planner.

A SQL query planner takes a parsed SQL statement and selects what it hopes is the most efficient series of steps to execute that query. To evaluate all the possible plans, the planner has to estimate the cost of each one. When you run EXPLAIN on a SQL statement, Postgres’s planner shows the cost of each step in the chosen plan, as well as the overall total cost. The cost is measured in dimensionless units and is based on configurable weights assigned to each step the plan will take. There are a lot of variables that go into the plan cost, most of which you can ignore for the purposes of understanding Traffic Control. Just remember these two things: plan costs are roughly linear (a plan with double the cost should take something like double the time and resources to execute), and the relationship between plan costs and real-world resources is heavily dependent on what query you’re running, what server you run it on, and what else is happening on that server at the moment.

Traffic Control compensates for those dependencies. We assume that there is an unknown constant k that we can multiply the plan cost by, to get the actual wall-clock time it will take to execute that query. But that constant is different for each query pattern and for each host. The constant may also change over time as the workload mix on the server changes and as tables grow and change. So it’s not exactly a constant!

Traffic Control implements a hash table on each host, mapping query patterns to two averages: CPU time and planner cost estimates. Both are exponential moving averages, heavily weighting recent queries. Every time a query completes, we update both of those averages. The magical not-quite-constant k is the ratio of the two.

Each time a query comes in, Traffic Control multiplies the planner’s estimated cost by k to guess how much CPU and/or wall-clock time the query will take. Based on that estimate, Traffic Control decides if the query can be allowed to begin. If it does, then at the end of query execution, Traffic Control updates the two averages for that query pattern so the k value will be more recent and more precise for the next query that arrives.

Leaky buckets

Two of the checks that Traffic Control performs for each query are easy: if the query’s estimated cost is too high, block it. If too many queries in the same budget are already running, block it. But the final check — is there enough capacity in the budget to proceed — is harder. It’s important, though! Many executions of a moderately expensive query can be even more damaging than a single very expensive query, and managing a budget over time is the best way to block queries that are only expensive in aggregate. Traffic Control considers the cumulative cost of queries in each configured budget.

Traffic Control leaky bucket

Each budget is modeled as a reverse leaky bucket. Here’s how that works. Each query that executes accumulates debt in the bucket. Any query that would cause the bucket to overflow with debt is blocked. Debt drains out over time, until the bucket is empty. The bucket has two important parameters: its size and its drain rate. The size dictates the burst limit, or what total resources queries under a given budget can use in a short amount of time. The drain rate dictates the server share, or what fraction of overall resources queries under a given budget can use in the long term.

Traditionally, leaky buckets work the other way: they start out full, they fill (but never overflow) with credits at a configured rate, traffic consumes credits, and if a bucket is ever empty, traffic gets blocked. We inverted the model for a simple reason: an empty bucket doesn’t need to be stored. Over time, we may need to store many buckets for changing rules and changing query metadata. We can drop buckets with a zero debt level, meaning that we only need to store recently active buckets, instead of every possible bucket. We store as many buckets as will fit in a configurable amount of shared memory, and we evict them implicitly when their debt falls to zero.

There is no periodic task that drains debt from all buckets. Instead, each bucket is updated only when read. There is also no periodic task to evict buckets with a debt level of zero. Instead, adding a new bucket to the table evicts any that have already emptied, or whichever bucket is expected to become empty soonest.

Rule sets

One important goal for Traffic Control is that it can efficiently decide when not to block a query. After all, Traffic Control has to make that decision before each query is even allowed to begin execution. So the budget here is measured in microseconds. But we also want developers and database administrators to be able to configure as many rules as it takes to manage traffic to their application. So it’s crucial that we can evaluate many rules quickly. Enter rule sets: a data structure that allows evaluating n rules in O(1) time.

Traffic Control rule set

Each rule has the form <key, value>, and it matches any query that has that same value for that same key. It’s complicated a bit by the fact that value can be an IP address with a CIDR mask.

A rule set maps each <key, value> pair to a rule. Now, when a query comes in with metadata like username=postgres, app=commerce, controller=api, the rule set can quickly identify the rule for each of those pairs. Hence, for this query, there are just three lookups in the rule set, regardless of how many rules are configured.

Note that a rule set only identifies rules to consider. Each rule’s budget is only checked if all its conditions match the query. A rule set is all about checking as few rules as possible. So, the sequence is: the rule set identifies a list of rules, that list is narrowed down to just the rules that actually match, and then the budgets for all the matching rules get checked to see if the query can proceed.

There are three exceptions to the O(1) target for identifying rules:

  1. Rules for the remote_address key check for a match for each mask length. So if you have rules for ten different mask lengths, the rule set has to do as many as ten lookups to find the rule with the longest matching prefix.
  2. Any conjunction rule — that is, a rule with multiple <key, value> pairs ANDed together — may be identified as a candidate for queries that match any one of the <key, value> pairs in the rule. So if you have conjunction rules with overlapping <key, value> pairs, the rule set may identify several or all of them as candidates for each query.
  3. It is possible to add multiple rules for the exact same <key, value> pair. If you do that, any query with that exact <key, value> pair will get checked against all of those rules.

Applying new rules

Traffic Control is meant to be used both proactively and during incident response. For incident response, it’s important that rules take effect quickly. And they do! Rules created or modified in the UI generally take effect at all database replicas in just 1-2 seconds. How?

Rules and budgets are stored as objects in the PlanetScale app. Any change to Traffic Control rules made in the UI or the API gets stored as rows in the planetscale database. Then it’s serialized as JSON in the traffic_control.rules and traffic_control.budgets parameters for Postgres. Some Postgres parameters require restarting the server, but those two don’t. So they cut the line and get sent immediately to postgresql.conf files on each database replica. Postgres reads the new config, and each worker process parses it into a rule set as soon as it completes whatever query it’s executing. The rule set is in place before the next query begins.

One big advantage of using Postgres configuration files, rather than sending configuration over SQL connections, is robustness on a busy server. You may want new Traffic Control rules most urgently when Postgres is using 100% of its available CPU, 100% of its worker processes, or both. Changing config files is possible even when opening a new SQL connection and issuing statements wouldn’t be.

Wrap up

Traffic Control uses the hooks and the performance measurements that Query Insights already implemented, then bolts on a system for sorting query traffic into budgets and warning or blocking queries that exceed those budgets. Each query can be warned or blocked if it’s individually too expensive, if too many other queries are already running under the same budget, or if recent and concurrent queries under the same budget have consumed too many resources in the aggregate. Traffic Control implements a dynamic model per query pattern that leverages the existing Postgres planner to estimate the real-world cost of a query before it begins to execute. Leaky buckets impose limits on both traffic bursts and the long-term average fraction of server resources assigned to any individual budget.

Taken as a whole, these elements implement Traffic Control, which gives developers and database administrators powerful new tools to identify, prioritize, and limit SQL traffic.

We Built the Same Agent Three Times Before It Worked

confusion

Two months ago, our DevOps team set out to build an AWS governance agent. Something that could look across a multi-account AWS organization, find orphaned resources, flag security issues, check tag compliance, and tell you where you’re bleeding money — in plain English.

We had AWS Strands Agents SDK, Amazon Bedrock AgentCore, and a reasonable amount of optimism.

What followed was two months of building, tearing down, and rebuilding. Three fundamentally different architectures. 18,000 lines of code written and then deleted. And a final system that’s simpler than any of the ones that came before it.

This is the story of how we got there.

Iteration 1: “The LLM Will Figure It Out”

The first version was the obvious one. Give the LLM a set of AWS API tools — describe_instances, list_security_groups, get_cost_and_usage — and let it call them directly.

We built an AgentRouter that received user queries, a CoordinatorAgent that managed multi-agent flow, and wired it all to boto3 calls. The LLM would receive a question like “find unused security groups in our production VPC,” reason about which APIs to call, and chain them together.

It worked. Sort of.

The problem wasn’t that the LLM couldn’t call AWS APIs. It could. The problem was that AWS APIs are inconsistent, paginated, rate-limited, and return wildly different response shapes across services. A question about orphaned EBS volumes required the LLM to:

  1. List all volumes
  2. Filter for available state
  3. Cross-reference with instance attachments
  4. Check if any are in use by ASGs or launch templates
  5. Handle pagination across all of these

The LLM would sometimes get this right. Sometimes it’d miss the pagination. Sometimes it’d hallucinate an API parameter. Every query was a fresh adventure in whether the model remembered the exact shape of describe_volumes response.

We were spending tokens on API exploration instead of governance analysis.

Lesson: Giving an LLM raw AWS APIs is like giving someone a phone book and asking them to plan a city. The information is there, but the abstraction is wrong.

confusion

Iteration 2: The 8,300-Line Orchestrator

If the LLM couldn’t be trusted to navigate AWS APIs on its own, we’d give it structure.

We built a five-stage deterministic pipeline:

  1. Classify — determine the intent (security audit, cost review, orphan detection)
  2. Reason — extract entities (account IDs, VPC names, resource types)
  3. Route — select the right tools and agents
  4. Execute — run the tools in the correct order
  5. Synthesize — compile results into a coherent response

This was a hybrid approach. Deterministic control flow with LLM reasoning at each stage. A SemanticIntentClassifier replaced keyword routing. A SupervisorAgent managed the pipeline. We added VPC disambiguation, cross-account routing, hallucination guards.

It felt like progress. The pipeline was predictable. Tests could target each stage. We could reason about failure modes.

But the orchestrator kept growing. Intent taxonomies needed constant updates. Every new query pattern required new routing logic. The classifier would misroute edge cases, and fixing one route would break another. VPC name resolution alone went through four bug-fix cycles.

By late February, the orchestrator was 8,300 lines across seven modules. The SupervisorAgent had been decomposed, recomposed, and decomposed again. We’d built an entire reasoning engine on top of an LLM that was already a reasoning engine.

We were fighting the model instead of using it.

Lesson: A deterministic pipeline that wraps an LLM is still deterministic. You get the rigidity of hardcoded flows with the unpredictability of language models. The worst of both worlds.

Iteration 3: The Satellite Architecture

Around the same time, we had a data freshness problem. Direct API calls were slow, rate-limited, and gave you a point-in-time snapshot. We wanted something closer to a continuously updated inventory.

So we built a satellite architecture:

  • Lambda scanners deployed across every AWS account via StackSets
  • Each scanner would enumerate resources on a schedule, enrich them with metadata and relationships
  • Results flowed into S3 Vectors — four buckets with 52 vector indexes, organized by domain (core, data, compute, ops)
  • An embedding service (Titan Embed Text v2, 1024 dimensions) vectorized everything
  • The agent would query the vector store instead of calling AWS APIs directly

The infrastructure was impressive on a whiteboard. Service-aware vector indexes. Cross-account routing. Relationship graphs embedded alongside resource metadata. A reconciliation pipeline to handle eventual consistency.

In practice:

Cost: Titan embedding calls for every resource in every account on every scan. Lambda execution time kept climbing — we bumped timeouts from 10 to 15 to 20 minutes. 57 VPC endpoints to give Lambdas access to S3 Vectors.

Consistency: Vector deduplication was a constant battle. Resources would appear twice after re-scans. Cross-account vector routing had subtle bugs where resources from one account would surface in queries about another.

Freshness: The thing we built this to solve. Scans ran on schedules, so the vector store was always behind reality. Users would ask about a security group that was created an hour ago and get nothing back.

Complexity: 3,700 lines of scanner code across eight modules. A 611-line S3 Vectors client. A 388-line relationship index. A 286-line embedding service. Infrastructure stacks for Step Functions, S3 Vectors buckets, scanner Lambdas, and all the IAM plumbing to connect them.

We had built a distributed data pipeline to feed an LLM that still couldn’t reliably answer “show me the unused EBS volumes.”

Lesson: When your data layer is more complex than your analysis layer, you’ve probably over-solved the wrong problem.

The Moment It Clicked

In late February, we stepped back and asked a different question: What if we stopped building infrastructure and started using what AWS already provides?

AWS Config Aggregator already has a continuously updated inventory of resources across all accounts. It supports SQL queries. It’s maintained by AWS. It doesn’t need Lambdas, embeddings, or vector stores.

And Strands SDK already handles tool selection, invocation, and chaining. It doesn’t need a five-stage pipeline to decide which tool to call.

On February 27, we deleted the 8,300-line orchestrator and replaced it with a single Strands agent. On March 2, we deleted the entire scanner infrastructure and replaced S3 Vectors with Config Aggregator queries.

The diff was dramatic: 18,000 lines removed. The new agent was roughly 1,500 lines.

What We Built Instead

getting_there

The current system has one Strands agent running Haiku. No multi-agent orchestration. No intent classification. No vector stores. The LLM picks tools from a registry, and the tools handle the complexity of talking to AWS.

Here’s what makes it work:

Data: Config Aggregator + Resource Explorer 2

Instead of building our own data layer, we query AWS’s:

SELECT resourceId, resourceType, configuration
WHERE resourceType = 'AWS::EC2::SecurityGroup'
AND accountId = 'XXXXXXXXXXXX'

Config Aggregator covers ~85% of resource types. Resource Explorer 2 fills the gaps. For anything with zero results, a direct API fallback fires automatically. No Lambdas. No embeddings. No eventual consistency problems.

Tools: Dispatchers Over Individual Functions

Early versions exposed 70+ individual tools to the model. Each tool call required the LLM to pick from a massive schema — roughly 30K tokens of tool definitions per request. The model would get confused, pick the wrong tool, or combine tools incorrectly.

We consolidated into 8 domain dispatchers:

@tool
def security_tool(action: str, **params):
    """Security operations: findings, sg_rules, nacl_analysis,
    kms_keys, compliance_check, ..."""
    return dispatch(action, params, _ACTIONS)

One security_tool with an action parameter replaces 11 individual tools. The LLM sees 8 clear categories instead of 70 ambiguous options. Tool schema dropped by 64% — about 10K fewer tokens per request.

Analysis: Context Builders, Not LLM Reasoning

The earlier architectures asked the LLM to analyze raw AWS API responses. “Here are 200 security groups, figure out which ones are orphaned.”

Now, deterministic context builders pre-process the data:

  • Orphan detection applies known rules (no attachments, no references, default VPC)
  • Security analysis flags known-bad patterns (0.0.0.0/0 ingress, missing encryption)
  • Cost analysis identifies savings opportunities from utilization data

The LLM receives pre-analyzed context and focuses on what it’s good at: explaining findings in plain language and prioritizing recommendations.

Skills: Progressive Disclosure

15 domain skills (cost optimization, security analysis, network intelligence, etc.) load on-demand based on query context. Each skill gates which tools the agent can access and provides domain-specific guidance.

This means the model doesn’t see irrelevant tool instructions. A cost question loads cost-optimization guidance and cost-related tools. The context stays focused.

The Well-Architected Sub-Agent

For deep assessments, we spawn a separate Strands agent running Sonnet (the main agent runs Haiku). This sub-agent has its own tool set — 20+ check functions for EBS, RDS, IAM, S3 — and its own system prompt tuned for Well-Architected Framework analysis.

It’s the one place where we use a more powerful model, and only when the user explicitly asks for an assessment.

Strands SDK: What Actually Matters

After using Strands through three architectural iterations, here’s what ended up being load-bearing:

Prompt caching (CacheConfig(strategy="auto")): Our system prompt is substantial — core orchestration plus dynamically loaded skills. Caching it across invocations cut latency and cost meaningfully.

The Plugin API: A single GovernancePlugin class registers hooks for before/after tool calls, after model calls, and after invocation. This gives us telemetry, token tracking, and post-response validation without touching the agent’s core logic.

event.resume: After the agent finishes responding, a hook can inspect the output and inject a follow-up. We use this for orphan analysis validation — if the agent’s response doesn’t match our deterministic findings, the hook sets event.resume with a correction prompt and the agent self-corrects. No infinite loops, no separate validation agent.

Streaming with agent.stream_async(): Real-time progress in Slack. Users see which tools are running, partial results, and the final analysis as it generates. This turned a 30-second wait into a 30-second experience of watching the agent work.

Agent cancellation: Long governance scans can take a while. Users can cancel mid-flight, and the agent cleans up gracefully.

Conversation summarization: Governance conversations can run long — “now check the other account,” “what about the network side.” The SDK’s SummarizingConversationManager keeps conversation history manageable while preserving critical context like account IDs and prior findings.

AgentCore: Production Without the Ops

AgentCore handles the parts we didn’t want to build:

  • Runtime hosting: Docker container on Graviton, managed by AgentCore. No ECS cluster to maintain.
  • Memory: Short-term and long-term session memory with episodic strategies. Cross-session learning — the agent remembers what it found in previous conversations and injects those reflections into new sessions.
  • JWT authentication: Corporate identity provider integration for user identity. The agent knows who’s asking and can scope responses to their permissions.
  • Guardrails: Bedrock Guardrails filter content to prevent secrets leakage in governance responses.

Bringing It to Slack with AG-UI

An agent that lives behind an API endpoint is useful. An agent that lives in the channel where your team already works is adopted.

We built a Slack bot as a separate service — Slack Bolt running in Socket Mode on ECS Fargate. When a user messages the bot, it calls the AgentCore-hosted agent over HTTPS. But early versions had a problem: governance scans take 15–30 seconds. Users would type a question, stare at a typing indicator, and wonder if anything was happening.

AgentCore supports AG-UI (Agent-User Interface), a streaming protocol that surfaces what the agent is doing in real time. We built a custom Strands-to-AG-UI adapter that translates the SDK’s internal events into an SSE stream:

POST /invocations
Accept: text/event-stream

→ TOOL_CALL_START: discover_resources (scanning 3 accounts...)
→ TEXT_DELTA: "Found 47 security groups across..."
→ TOOL_CALL_START: security_tool (analyzing findings...)
→ TEXT_DELTA: "12 groups have unrestricted ingress..."

The same endpoint serves both modes. Accept: text/event-stream gets the SSE stream; a normal request gets synchronous JSON. The Slack bot consumes the stream and progressively updates the Slack message — users see tools firing, partial results appearing, and the final analysis building in real time.

A few things we learned the hard way about streaming:

  • Never clear your accumulated response text when a new tool call starts. The agent can call tools mid-response, and clearing the buffer silently drops everything it said before the tool call.
  • Track unique tool stages, not individual calls, for progress display. Otherwise you flood the Slack message with duplicate updates.
  • Track text offsets after both tool-call-start and tool-call-end events. Text can appear between tool calls, and missing either offset creates gaps in the streamed output.

The result: what used to be a 30-second black box is now a 30-second live feed of the agent working through the problem. Users trust it more because they can see it thinking.

The Numbers

Metric Satellite Architecture Current
Lines of code ~25,000 ~7,000
Tool definitions exposed to LLM 70+ 25 (8 dispatchers + 17 individual)
Tool schema tokens per request ~30K ~10K
Infrastructure components S3 Vectors (4 buckets), 52 indexes, Lambda scanners, Step Functions, 57 VPC endpoints Config Aggregator (AWS-managed), 20 VPC endpoints
Data freshness Minutes to hours (scan schedule) Real-time (Config Aggregator)
Embedding costs Per-resource per-scan Zero
Live test pass rate Inconsistent 109/109 (100%)

What We’d Tell Ourselves Two Months Ago

“Not enough coverage” isn’t always a good reason to build your own. We dismissed Config Aggregator early because our research showed it didn’t cover every resource type we wanted to query. So we built an entire scanning pipeline to get 100% coverage. What we discovered later: Config Aggregator covers ~85% of resource types, Resource Explorer 2 fills most of the gaps, and a simple direct API fallback handles the rest. Three lines of fallback logic replaced 3,700 lines of scanner code. Perfect coverage wasn’t worth the complexity cost.

Don’t build orchestration on top of orchestration. Strands SDK is already a tool-use loop. Adding a five-stage pipeline on top of it added complexity without adding capability.

Token budget is an architecture constraint. 70 tools meant 30K tokens of schema per request. The dispatcher pattern wasn’t just cleaner code — it was a 64% reduction in per-request cost.

Deterministic preprocessing, LLM synthesis. The best division of labor: code handles data collection and known-rule analysis. The LLM handles explanation, prioritization, and natural language. Don’t ask the model to do what a SQL query can do better.

Ship the boring version first. Every complex architecture we built was an attempt to solve problems we hadn’t actually encountered yet. The current system handles real governance queries from real users. That’s the bar.

Built with AWS Strands Agents SDK and Amazon Bedrock AgentCore.

Why Cybersecurity Compliance Is Now a Strategic Business Asset — Not Just a Legal Obligation

Ask most business leaders what cybersecurity compliance means to their organization and the answer will center on obligation: avoiding regulatory fines, passing audits, satisfying contractual requirements from enterprise customers. These are real and valid reasons to maintain compliance — but they capture only a fraction of the business value that a mature compliance program actually delivers.
The organizations that treat compliance purely as a legal necessity are leaving significant strategic value on the table. The ones that treat it as a business asset are doing something fundamentally different — and reaping correspondingly different rewards.
The Compliance Landscape Has Changed
Regulatory requirements around data security have expanded dramatically over the last decade, and the trajectory is continuing. Beyond the well-established frameworks — PCI-DSS, HIPAA, ISO 27001, SOC 2, NIST — newer regional and sector-specific requirements are creating additional compliance obligations for businesses operating globally.
The cost of non-compliance has risen alongside the complexity. HIPAA settlements now routinely reach into the tens of millions. GDPR fines of 4% of global annual revenue are not theoretical — they’ve been levied against major organizations. PCI-DSS non-compliance creates liability exposure that payment processors take seriously.
But the more interesting development isn’t the growing stick. It’s the growing carrot.
Compliance as a Business Development Tool
Enterprise procurement has changed. Large organizations and government agencies increasingly require vendors, suppliers, and technology partners to demonstrate security certifications and compliance postures as a condition of doing business. A supplier without ISO 27001 certification or a SOC 2 report may simply not qualify for the RFP.
This dynamic has made security compliance a business development asset in concrete, revenue-linked ways. The organization that can present an ISO 27001 certification, a current SOC 2 Type II report, and documented compliance with relevant industry frameworks wins procurement evaluations that competitors without those credentials lose.
For businesses targeting enterprise customers, regulated industries, or government contracts, a mature compliance program is not overhead — it’s qualification criteria.
The Customer Trust Dimension
Beyond formal procurement requirements, customers increasingly make purchasing decisions based on trust signals around data security. High-profile breaches have made the general business audience acutely aware of the risks associated with sharing sensitive data with vendors. In a competitive market, visible security credentials differentiate.
This is particularly true in industries that handle sensitive personal data: healthcare, financial services, professional services, HR technology, and any SaaS platform that touches customer data. The ability to point to continuous compliance monitoring, third-party certifications, and a documented security program answers the question customers are increasingly asking before they sign.
The Operational Efficiency Angle
Here’s the dimension of compliance value that gets the least attention in business conversations: compliance programs, when implemented well, make organizations more operationally efficient.
The controls required by major security frameworks — access management, system monitoring, change management, incident response procedures, vendor risk management — are not just regulatory checkboxes. They’re foundational security practices that reduce operational risk, improve system reliability, and create documented processes where informal ad-hoc practices previously existed.
Organizations that have matured their compliance programs consistently report secondary benefits: fewer security incidents (the controls work), faster incident response (documented procedures exist and people know them), lower insurance premiums (demonstrable risk management), and reduced audit costs (continuous monitoring replaces last-minute scramble).
The challenge has historically been that compliance programs are expensive to run. Evidence collection, control testing, documentation maintenance, and audit preparation can consume significant internal resources — particularly in organizations managing compliance across multiple frameworks simultaneously.
How Automation Changes the Economics
The emergence of mature GRC (Governance, Risk, and Compliance) automation platforms has substantially changed the economics of running a compliance program. Rather than manually collecting evidence, testing controls, and preparing documentation at audit time, automated platforms provide:
Continuous control monitoring — real-time visibility into whether security controls are operating as designed, not just a point-in-time assessment at audit time.
Automated evidence collection — logs, access records, configuration states, and security events are automatically mapped to specific control requirements and retained in a format audit-ready for review.
Multi-framework management — organizations managing simultaneous compliance with ISO 27001, PCI-DSS, and HIPAA can view their compliance posture across all three frameworks from a single dashboard, with control overlap mapped automatically (many controls satisfy multiple frameworks simultaneously).
Gap identification and remediation guidance — when a control falls out of compliance, the platform identifies it immediately and provides remediation guidance rather than leaving the team to discover it at the next audit.
The operational impact is significant. Organizations using automated GRC platforms consistently report compliance audit preparation time reduced by 60–70% compared to manual approaches. That’s not just efficiency — it’s a meaningful reduction in the risk of compliance failure that comes from compressed, high-pressure manual audit preparation.
Platforms like CyberSilo provide a useful example of how integrated compliance automation works alongside security monitoring — where the same platform that detects threats also continuously tracks compliance posture, eliminating the traditional gap between security operations and compliance management.
Building the Business Case Internally
For business leaders making the case for compliance investment to stakeholders or boards, the conversation benefits from moving beyond the “avoiding fines” frame:
Risk quantification: What is the probability-adjusted annual cost of a major compliance failure (fines, litigation, remediation, reputational damage)? Compliance investment is insurance with a calculable actuarial value.
Revenue impact: What business have you lost or not pursued because of compliance gaps? What contracts would a certification open? These are real revenue numbers.
Operational savings: Estimate the current internal cost of manual compliance operations — audit preparation time, evidence collection, control testing. Compare against automated platform costs.
Competitive positioning: Where does your compliance posture compare to competitors in your market? In regulated verticals, this is often a decisive purchasing criterion.
Presented with these four dimensions quantified, compliance investment typically looks very different from a pure cost center.
The Strategic Conclusion
The businesses that will perform best in the next five years of an increasingly regulated, increasingly scrutinized digital economy are those that have built compliance into their operations as a continuous, automated function — not those scrambling to prepare documentation every time an audit looms.
Compliance is a lagging indicator of security maturity. Organizations with genuinely strong security programs find compliance straightforward — because the controls are already in place, the evidence is already being generated, and the documentation already exists. The compliance program becomes a certification of what the organization is already doing.
Framed that way, the investment case for compliance automation isn’t really about compliance at all. It’s about building a security program that’s genuinely effective — and then letting the compliance certifications and competitive advantages follow naturally.

Scan Any Document to a Searchable PDF For Free, Right in Your Browser

If you’ve ever had a printed contract, a handwritten note, or a physical receipt that you desperately needed as a PDF — and found yourself wrestling with apps that either upload your files to some random server, slap a watermark on the result, or charge you after three free scans — you know the frustration.
There’s a better way. It’s called ihatepdf.cv, and it runs entirely in your browser.

What ihatepdf.cv Actually Does
ihatepdf.cv is a free browser-based document scanner. You open it, point your phone or laptop camera at a piece of paper, and it spits out a clean, flat, searchable PDF — with no account required, no file ever leaving your device, and absolutely no watermark.
It’s the kind of tool that should have always existed. Here’s what happens under the hood when you hit that shutter button.

Step 1: It Detects the Document Edges Automatically
The moment you capture a frame, ihatepdf.cv runs an edge-detection algorithm directly in JavaScript — no computer vision library, no WebAssembly blob to download. It applies a Gaussian blur to reduce noise, then runs a Sobel operator across the image to find where brightness changes sharply (i.e., where your document meets the desk or background).
The four corners of your document are estimated from those edge points and shown as draggable handles on screen. Most of the time the auto-detect is spot on. When it isn’t, you just drag the corners yourself — and a little magnifying loupe pops up under your finger so you can place them with pixel-level precision.

Step 2: Perspective Correction (The Magic Part)
This is what separates a real document scanner from just “taking a photo.” Even if your paper is at an angle — tilted 20 degrees, shot from the side — ihatepdf.cv mathematically flattens it.
It computes a homography matrix: a transformation that maps your four selected corners to a perfect rectangle. Then it walks every pixel of the output image backwards through that transformation to find where it came from in the original photo. The result is a flat, de-skewed document that looks like it came off a flatbed scanner.
No OpenCV. No server. Eight equations, eight unknowns, solved in JavaScript.

Step 3: Enhancement — Make It Actually Readable
Raw camera images are often too soft or too grey for OCR to work well. ihatepdf.cv gives you five one-tap presets:

Original — untouched, exactly what the camera saw
Document — boosted contrast and brightness, great for printed text
B&W — full greyscale with heavy contrast, sharp black text on white
Whiteboard — aggressive brightness lift for whiteboard photos
Photo — gentle enhancement for mixed-content pages

You can also fine-tune brightness and contrast manually with sliders. Any preset can be applied to all pages in one tap — useful when you’re scanning a multi-page document in the same lighting conditions.

Step 4: OCR — Turn Your Scan Into a Searchable PDF
This is the feature that makes the output genuinely useful rather than just a pretty image. After you’ve captured and adjusted your pages, hitting “Scan & Extract Text” fires up Tesseract.js — an open-source OCR engine that runs locally in your browser.
It supports 17 languages including English, Hindi, French, German, Arabic, Chinese, Japanese, Korean, and more. Set it to Auto and it detects the script automatically from your first page.
Before OCR runs, ihatepdf.cv preprocesses each image:

Normalises the contrast range so faint text becomes visible
Sharpens edges with a Laplacian filter
Upscales small images to the sweet spot for Tesseract accuracy (~1800px)
If confidence is low, automatically retries on a binarised (black and white) version

The extracted words, along with their exact positions on the page, are embedded as an invisible text layer in the final PDF — white text sitting just underneath the image. The document looks exactly like your scan, but you can select text, search with Ctrl+F, and have it indexed by any search engine or document manager.

Step 5: Export Options That Don’t Hold You Hostage
Once processed, you get:

Download as PDF — a proper searchable PDF, no watermark, no size limit other than your device’s memory
Download as .txt — the raw extracted text, useful for pasting into other documents
Copy text — one tap to clipboard
Share — on mobile, triggers the native share sheet so you can AirDrop, send via WhatsApp, email it, whatever

There’s also a merge feature: if you already have an existing PDF, you can load it and choose whether your new scan goes before or after it. Useful when you’re adding pages to a report or combining a handwritten note with a typed document.

Multi-Page and Batch Scanning
Single-page scanning is the easy case. ihatepdf.cv handles multi-page documents too.
After each capture, you land back in a review screen where your pages appear as a scrollable thumbnail strip. Tap any thumbnail to preview it full-screen. Drag thumbnails to reorder pages. Long-press for a context menu that lets you rotate, replace, move, or delete individual pages. Swipe left and right on the preview to navigate between pages.
For situations where you need to quickly capture a stack of documents, Batch mode lets you keep the camera open and shoot as many frames as you want. You then review all captures at once, edit corners on any that need it, and add everything to your document in a single step.
A small coloured dot on each thumbnail gives you a blur quality score — green means sharp, amber is borderline, red means you should retake it. It’s a small thing, but it saves you from building a 20-page PDF only to find page 7 is unreadable.

Why “No Upload” Actually Matters
Most online PDF tools — even the free ones — route your files through a server. That’s fine for a grocery receipt. It’s less fine for:

Medical records
Legal contracts
Financial statements
ID documents
Confidential work files

ihatepdf.cv processes everything on your device. The image never leaves. There’s no server log of what you scanned, no storage bucket somewhere holding your documents, no terms of service clause about training AI on your uploads.
This isn’t a privacy marketing line. It’s just what happens when you do image processing in JavaScript on a canvas element. The data literally cannot go anywhere because there’s nowhere to send it.

Works Without an Internet Connection
Once the page loads, ihatepdf.cv works offline. The OCR language models are fetched on first use and cached by the browser. After that, you could put your phone in airplane mode and scan a full document to a searchable PDF without any network activity.
This matters more than it sounds. You’re scanning in a basement. On a plane. In a client meeting where pulling out your phone to use some cloud service looks unprofessional. ihatepdf.cv doesn’t care.

Import From Your Gallery Too
Don’t have something in front of you to scan right now? You can import existing photos from your camera roll. ihatepdf.cv runs the same edge detection and perspective correction on imported images, automatically applies the Document filter, and adds them to your page stack just like a live capture.
This is useful for: photos you already took of a whiteboard, photos of receipts sent to you by someone else, or images of documents you photographed earlier without a scanning app.

The Short Version
If you need to turn a physical document into a PDF and you want it to be:

Free
Searchable
Watermark-free
Private (nothing uploaded)
Available offline
Multi-language
Multi-page

— ihatepdf.cv does all of that. In your browser. Right now.
No sign-up. No install. Try ihatepdf.cv now →

Scan Any Document to a Searchable PDF — For Free, Right in Your Browser

If you’ve ever had a printed contract, a handwritten note, or a physical receipt that you desperately needed as a PDF — and found yourself wrestling with apps that either upload your files to some random server, slap a watermark on the result, or charge you after three free scans — you know the frustration.
There’s a better way. And it runs entirely in your browser.

What DocScan Actually Does
DocScan is a browser-based document scanner. You open it, point your phone or laptop camera at a piece of paper, and it spits out a clean, flat, searchable PDF — with no account required, no file ever leaving your device, and absolutely no watermark.
It’s the kind of tool that should have always existed. Here’s what happens under the hood when you hit that shutter button.

Step 1: It Detects the Document Edges Automatically
The moment you capture a frame, DocScan runs an edge-detection algorithm directly in JavaScript — no computer vision library, no WebAssembly blob to download. It applies a Gaussian blur to reduce noise, then runs a Sobel operator across the image to find where brightness changes sharply (i.e., where your document meets the desk or background).
The four corners of your document are estimated from those edge points and shown as draggable handles on screen. Most of the time the auto-detect is spot on. When it isn’t, you just drag the corners yourself — and a little magnifying loupe pops up under your finger so you can place them with pixel-level precision.

Step 2: Perspective Correction (The Magic Part)
This is what separates a real document scanner from just “taking a photo.” Even if your paper is at an angle — tilted 20 degrees, shot from the side — DocScan mathematically flattens it.
It computes a homography matrix: a transformation that maps your four selected corners to a perfect rectangle. Then it walks every pixel of the output image backwards through that transformation to find where it came from in the original photo. The result is a flat, de-skewed document that looks like it came off a flatbed scanner.
No OpenCV. No server. Eight equations, eight unknowns, solved in JavaScript.

Step 3: Enhancement — Make It Actually Readable
Raw camera images are often too soft or too grey for OCR to work well. DocScan gives you five one-tap presets:

Original — untouched, exactly what the camera saw
Document — boosted contrast and brightness, great for printed text
B&W — full greyscale with heavy contrast, sharp black text on white
Whiteboard — aggressive brightness lift for whiteboard photos
Photo — gentle enhancement for mixed-content pages

You can also fine-tune brightness and contrast manually with sliders. Any preset can be applied to all pages in one tap — useful when you’re scanning a multi-page document in the same lighting conditions.

Step 4: OCR — Turn Your Scan Into a Searchable PDF
This is the feature that makes the output genuinely useful rather than just a pretty image. After you’ve captured and adjusted your pages, hitting “Scan & Extract Text” fires up Tesseract.js — an open-source OCR engine that runs locally in your browser.
It supports 17 languages including English, Hindi, French, German, Arabic, Chinese, Japanese, Korean, and more. Set it to Auto and it detects the script automatically from your first page.
Before OCR runs, DocScan preprocesses each image:

Normalises the contrast range so faint text becomes visible
Sharpens edges with a Laplacian filter
Upscales small images to the sweet spot for Tesseract accuracy (~1800px)
If confidence is low, automatically retries on a binarised (black and white) version

The extracted words, along with their exact positions on the page, are embedded as an invisible text layer in the final PDF — white text sitting just underneath the image. The document looks exactly like your scan, but you can select text, search with Ctrl+F, and have it indexed by any search engine or document manager.

Step 5: Export Options That Don’t Hold You Hostage
Once processed, you get:

Download as PDF — a proper searchable PDF, no watermark, no size limit other than your device’s memory
Download as .txt — the raw extracted text, useful for pasting into other documents
Copy text — one tap to clipboard
Share — on mobile, triggers the native share sheet so you can AirDrop, send via WhatsApp, email it, whatever

There’s also a merge feature: if you already have an existing PDF, you can load it and choose whether your new scan goes before or after it. Useful when you’re adding pages to a report or combining a handwritten note with a typed document.

Multi-Page and Batch Scanning
Single-page scanning is the easy case. DocScan handles multi-page documents too.
After each capture, you land back in a review screen where your pages appear as a scrollable thumbnail strip. Tap any thumbnail to preview it full-screen. Drag thumbnails to reorder pages. Long-press for a context menu that lets you rotate, replace, move, or delete individual pages. Swipe left and right on the preview to navigate between pages.
For situations where you need to quickly capture a stack of documents, Batch mode lets you keep the camera open and shoot as many frames as you want. You then review all captures at once, edit corners on any that need it, and add everything to your document in a single step.
A small coloured dot on each thumbnail gives you a blur quality score — green means sharp, amber is borderline, red means you should retake it. It’s a small thing, but it saves you from building a 20-page PDF only to find page 7 is unreadable.

Why “No Upload” Actually Matters
Most online PDF tools — even the free ones — route your files through a server. That’s fine for a grocery receipt. It’s less fine for:

Medical records
Legal contracts
Financial statements
ID documents
Confidential work files

DocScan processes everything on your device. The image never leaves. There’s no server log of what you scanned, no storage bucket somewhere holding your documents, no terms of service clause about training AI on your uploads.
This isn’t a privacy marketing line. It’s just what happens when you do image processing in JavaScript on a canvas element. The data literally cannot go anywhere because there’s nowhere to send it.

Works Without an Internet Connection
Once the page loads, DocScan works offline. The OCR language models are fetched on first use and cached by the browser. After that, you could put your phone in airplane mode and scan a full document to a searchable PDF without any network activity.
This matters more than it sounds. You’re scanning in a basement. On a plane. In a client meeting where pulling out your phone to use some cloud service looks unprofessional. DocScan doesn’t care.

Import From Your Gallery Too
Don’t have something in front of you to scan right now? You can import existing photos from your camera roll. DocScan runs the same edge detection and perspective correction on imported images, automatically applies the Document filter, and adds them to your page stack just like a live capture.
This is useful for: photos you already took of a whiteboard, photos of receipts sent to you by someone else, or images of documents you photographed earlier without a scanning app.

The Short Version
If you need to turn a physical document into a PDF and you want it to be:

Free
Searchable
Watermark-free
Private (nothing uploaded)
Available offline
Multi-language
Multi-page

— DocScan does all of that. In your browser. Right now.
No sign-up. No install. Just open it and scan.

AI Writes Better UI Without React Than With It

I recently shipped a desktop app. No React. No npm. No node_modules. AI generated most of the UI code, and it worked better without a framework than it ever would have with one.

Streaming real-time content, managing complex state, drag-and-drop reordering, resizable layouts — all in plain Web Components and imperative DOM manipulation. Zero runtime dependencies.

This wasn’t an ideological choice. It just turned out that when AI writes your UI, frameworks get in the way more than they help.

Why frameworks existed

Think about what React actually solved when it came out. The browser DOM API was painful. Managing state across components was a mess. Keeping the UI in sync with data required tons of boilerplate. Frameworks abstracted all of that away.

But that was 2013. Since then, two things changed:

The platform caught up. Web Components, custom elements, CustomEvent, CSS custom properties, prefers-color-scheme, ResizeObserver, MutationObserver, template literals. The browser now has native answers to most of the problems that React was invented to solve.

AI writes the boilerplate. The remaining argument for frameworks is developer ergonomics — less repetitive code. But when AI generates your components, that argument disappears. AI doesn’t get bored writing document.createElement. It doesn’t need JSX to be productive. It just writes the code, and the code uses APIs that every model knows because they’ve been in every browser for years.

So you end up with: the platform handles the hard stuff natively, and AI handles the tedious stuff. What’s left for the framework to do?

The setup

The app is an Electron desktop app. The renderer is the part users interact with: a chat panel, tab bar, agent sidebar, task panel, status line. Standard desktop app stuff.

When I started, I figured I’d add React later when things got complex enough. That moment never came.

What the code actually looks like

Every component in the app follows the same pattern. There’s a render() method. When state changes, it gets called. It updates the DOM.

That’s it. That’s the architecture.

The DOM structure gets built once. After that, updates only touch what actually changed. No virtual DOM doing the diffing for me. I know what changed because I’m the one who changed it.

React’s entire selling point is “you describe what the UI should look like and we figure out the minimal DOM updates.” But if you already know what changed… you don’t need someone to figure it out. You just update that thing.

DOM caching without a virtual DOM

The chat component renders message blocks from an AI agent — text, code, tool calls, tool results. Messages stream in real-time. This needs to be fast.

My approach: a WeakMap that tracks what each DOM element was last rendered from. On update, compare the cache entry. If it matches, skip it. Remove elements that no longer exist, append new ones.

This is what React’s reconciler does, except I’m doing it for the one place that actually needs it. The rest of the app doesn’t need diffing at all — the DOM structure is stable, only content changes.

Event delegation over binding

Instead of attaching click handlers to every interactive element, I attach one handler to the container. It checks what was clicked using closest() and acts accordingly. New elements added to the DOM? Already covered. No need to bind or unbind anything.

This is old-school DOM programming. jQuery developers did this in 2010. It still works great.

What AI gets wrong with frameworks

Here’s the thing nobody talks about. Ask AI to build you a component in React and it’ll give you something that looks right. But then you need state management — and it picks a library you don’t use. Or it uses an older API pattern. Or it generates a hook that doesn’t compose well with the rest of your app. You spend time fixing the framework-specific parts, not the actual logic.

Ask AI to do the same thing with plain DOM manipulation and there’s nothing to get wrong. createElement, appendChild, addEventListener — these APIs haven’t changed. There’s no version mismatch, no deprecated patterns, no competing conventions for how to structure things.

The framework was supposed to make development faster. But when AI writes the code, the framework becomes the part that slows you down — it’s the thing that needs to be done correctly according to conventions that the model may or may not know.

Why you don’t need npm either

I needed a markdown parser for rendering LLM responses. Normally you’d npm install something. Instead I asked AI to generate one. It came out to about 300 lines. Handles code blocks, tables, lists, blockquotes, links, images — everything that actually shows up in LLM output.

I needed a state store for sharing data between components. AI generated a small one with selector-based subscriptions. About 50 lines.

I needed CSS theming with light/dark mode. That’s just CSS custom properties and a prefers-color-scheme media query. The browser does this natively now.

Every time I thought “I need a library for this,” I asked AI to write it instead. And every time, the result was a few hundred lines of code that does exactly what I need, nothing more. No transitive dependencies, no breaking changes on update, no 200KB bundle for a feature I use 10% of.

When AI can generate a focused solution in seconds, what’s the point of importing a general-purpose library?

The stability argument

Here’s a bonus you don’t think about until it matters: nothing in my app can break without me changing it.

No dependency will release a version that deprecates an API I use. No framework will ship a migration guide I have to follow. No package in my tree will get a CVE that forces an emergency update on a Friday night.

When your code only depends on browser APIs, the only thing that can break it is the browser. And browsers don’t break backwards compatibility. A Web Component I write today will work in 2030. Can you say that about your React 19 code?

When this doesn’t apply

I’m not going to pretend this works for everything. If you have a team of 20 people and everyone knows React, use React. The shared conventions are worth more than the technical purity.

But if you’re building something yourself, or with AI doing most of the generation — consider whether the framework is helping you or just giving AI more ways to make mistakes.

The platform handles the hard stuff natively. AI handles the tedious stuff. Frameworks used to sit in between. I’m not sure they need to anymore.

AgentWFY is open source, MIT licensed. The renderer code is in src/renderer/ if you want to see how all of this looks in practice.

Beyond the Hype: A Practical Guide to Integrating AI into Your Development Workflow

The AI Tidal Wave: Are You Building Boats or Waiting for the Tsunami?

Another week, another flood of “Will AI Replace Developers?” articles. While that existential debate rages, a quiet revolution is already underway in the trenches. The real question isn’t about replacement; it’s about augmentation. How can you, as a developer, harness AI tools today to write better code, solve complex problems faster, and free up your mental bandwidth for truly creative engineering?

This guide moves past the hype. We’ll explore practical, actionable strategies for integrating AI into your daily development workflow, complete with code examples and real-world use cases. Let’s stop speculating about the future and start building it.

The AI Toolbox: More Than Just a Chatbot

Before we dive into workflows, let’s categorize the AI tools at your disposal. Think of this as your new developer toolkit.

  1. Code-Autocomplete & Generation (e.g., GitHub Copilot, Tabnine): Your intelligent pair programmer, suggesting whole lines, functions, and blocks of code based on context.
  2. Chat-Driven Development (e.g., ChatGPT, Claude, specialized coding assistants): A conversational partner for explaining concepts, generating code from descriptions, debugging, and refactoring.
  3. AI-Powered Code Review & Analysis (e.g., SonarCloud with AI, Amazon CodeWhisperer security scans): Proactive tools that identify bugs, security vulnerabilities, and suggest optimizations beyond static analysis.
  4. AI for DevOps & Operations (e.g., AI-powered log analyzers, predictive monitoring): Tools that parse mountains of operational data to find anomalies, predict failures, and suggest fixes.

Integrating AI into Your Development Loop: A Phase-by-Phase Guide

Phase 1: Planning & Design

Instead of staring at a blank README.md, use a chat-based AI to kickstart your design process.

Prompt Example:

“Act as a senior software architect. I need to design a RESTful API for a task management application. It should have users, projects, and tasks. Generate a concise design document outlining the core models, key endpoints (with HTTP methods), and a suggested database schema in SQL.”

This gives you a structured first draft to critique, refine, and build upon. It’s a brainstorming partner that never gets tired.

Phase 2: Implementation (Where the Magic Happens)

This is where tools like GitHub Copilot shine. The key is context. Write descriptive function names, comments, and docstrings to guide the AI.

Bad Context:

function processData(data) {
  // code here
}

Good Context:

/**
 * Calculates the moving average of an array of numerical data.
 * @param {number[]} data - The input array of numbers.
 * @param {number} windowSize - The size of the moving window.
 * @returns {number[]} An array of moving averages. Handles edges by using a partial window.
 */
function calculateMovingAverage(data, windowSize) {
  // Copilot now has excellent context to generate accurate code.
}

When you hit a known but tedious pattern—like creating a React component with PropTypes, or a standard Express.js controller—let the AI generate the boilerplate. Then, you focus on the unique business logic.

Phase 3: Debugging & Problem Solving

Hit a cryptic error? Paste the error message and the relevant 10-15 lines of code into your chat assistant.

Prompt Example:

“I’m getting this error in my Python Flask app: sqlalchemy.exc.IntegrityError: (sqlite3.IntegrityError) NOT NULL constraint failed: post.user_id. Here’s my model definition and the save function: [paste code]. What’s the most likely cause and how do I fix it?”

The AI can quickly explain the foreign key constraint issue and suggest checking if the user object is properly associated before committing. It’s like having a senior developer on call 24/7 for those “stuck” moments.

Phase 4: Code Review & Refactoring

Use AI to critique your own code before the human review.

Prompt Example:

“Review this JavaScript function for potential issues, performance improvements, and readability. Suggest a refactored version.”

function getActiveUsers(users) {
  let active = [];
  for (let i = 0; i < users.length; i++) {
    if (users[i].isActive && users[i].lastLogin > Date.now() - 86400000) {
      active.push(users[i]);
    }
  }
  return active;
}

Potential AI Response:

“Consider using filter() for clarity and immutability. The magic number 86400000 should be a named constant. Also, consider extracting the condition into a well-named helper function for readability.”

const ONE_DAY_MS = 24 * 60 * 60 * 1000;
const isUserActive = (user) => user.isActive && user.lastLogin > Date.now() - ONE_DAY_MS;

function getActiveUsers(users) {
  return users.filter(isUserActive);
}

Advanced Tactics: Prompt Engineering for Developers

To get the best results, you need to speak the AI’s language. Here are key techniques:

  • Be Specific & Provide Context: “Write a Python function to parse this specific log format” is better than “write a parser.”
  • Ask for Step-by-Step Reasoning: For complex problems, prompt: “Let’s think step by step. How would I implement a rate-limiting middleware in Node.js?”
  • Iterate and Refine: Treat the first output as a draft. Follow up with: “That’s good, but now make it asynchronous and add error handling for network timeouts.”
  • Provide Examples (Few-Shot Learning): Show the AI the pattern you want.

    // Convert these strings to title case:
    // Input: "hello_world_example" -> Output: "Hello World Example"
    // Input: "userID" -> Output: "User ID"
    // Now, convert: "api_response_data"
    

The Human in the Loop: Critical Responsibilities AI Can’t Handle

AI is a powerful lever, but you are the architect. Your irreplaceable responsibilities include:

  • Architectural Vision: Understanding the broader system, trade-offs, and long-term maintainability.
  • Business Logic & Domain Expertise: Translating nuanced business rules into technical requirements.
  • Final Judgment & Ethics: Evaluating AI suggestions for security flaws, bias, or inappropriate solutions.
  • Craftsmanship & User Experience: Ensuring the final product is elegant, usable, and brings joy.
  • Asking the Right Questions: AI answers what you ask. Defining the problem is still a profoundly human skill.

Getting Started: Your Action Plan

  1. Pick One Tool: Start small. Install GitHub Copilot or get proficient with the coding mode of ChatGPT/Claude.
  2. Integrate into One Task: Use it for writing unit tests, which are often repetitive and well-defined. Prompt: “Write 3 Jest test cases for this React component: [paste component].”
  3. Practice Prompting: Spend 15 minutes a day solving small coding puzzles with an AI assistant. Notice what prompts give the best results.
  4. Critically Evaluate Every Suggestion: Never accept code blindly. Understand why the AI wrote what it did.

The developers who thrive in this new era won’t be the ones who fear AI, but the ones who learn to direct it with skill and judgment. The tool is here. The question is, how will you use it to build what’s next?

Start today. Pick one small problem from your current backlog and solve it with an AI assistant. Share what you learn. The future of development isn’t about being replaced—it’s about being amplified.