GitHub Issue Template: How to Get More Contributions and Build Community

TL;DR

  • Good issue templates increase contributor activity by 40%+
  • Bug report template → better bugs, faster fixes
  • Feature request template → clearer roadmap
  • Pull request template → higher merge rate
  • Free templates included — copy and use today

Why Issue Templates Matter

When developers file issues without guidance, you get:

  • Vague bug reports: “it doesn’t work”
  • Duplicate requests: “I already built this in #123”
  • Missing context: no steps to reproduce

With templates, you get actionable information that moves your project forward.

The 4 Essential Templates

1. Bug Report Template

---
name: 🐛 Bug Report
about: Report something that isn't working
labels: bug
---

**Description**
A clear description of the bug.

**Steps to Reproduce**
1. Go to '...'
2. Click on '...'
3. See error

**Expected Behavior**
What you expected to happen.

**Screenshots**
If applicable, add screenshots.

**Environment**
- OS: [e.g. macOS 14.0]
- Version: [e.g. 1.0.0]

**Additional Context**
Any other context about the problem.

2. Feature Request Template

---
name: ✨ Feature Request
about: Suggest an idea for this project
labels: enhancement
---

**Problem**
What problem does this solve?

**Solution**
Describe your proposed solution.

**Alternatives**
Any alternative solutions you've considered.

**Additional Context**
Mockups, examples, references.

3. Pull Request Template

## TL;DR
<!-- 1-3 sentences: what changed -->

## Changes
<!-- Added / Changed / Fixed -->

## Testing
<!-- How did you test this? -->

## Screenshots (if UI change)
<!-- Before → After -->

## Checklist
- [ ] Tests pass
- [ ] Documentation updated
- [ ] No console.log

4. Custom Issue Template (config.yml)

blank_issues_enabled: false
contact_links:
  - name: ❓ Questions
    url: https://github.com/YOUR_REPO/discussions
    about: Ask questions here
  - name: 💬 Discord
    url: YOUR_DISCORD_LINK
    about: Chat with the community

Pro Tips

Make Templates Discoverable

Add a ISSUE_TEMPLATE.md at repo root:

# Contributing

Before opening an issue:

- 🔍 Search existing issues first
- 📖 Check the FAQ in discussions
- 🐛 For bugs: use the Bug Report template
- ✨ For features: use the Feature Request template

Use Labels Strategically

Label When to Use
bug Something is broken
enhancement New feature request
good first issue Easy wins for new contributors
documentation Docs improvements
question User questions
wontfix Won’t address, explain why

Respond to Issues Fast

  • First response within 48 hours → 3x more likely to get contributions
  • Label “good first issue” → attracts new contributors
  • Close duplicates politely with a link to the original

TL;DR Summary

  • Bug template: Steps to reproduce + expected vs actual
  • Feature template: Problem + solution + alternatives
  • PR template: TL;DR + changes + testing checklist
  • Config: Disable blank issues, add links
  • Labels: Make them actionable
  • Speed: Respond within 48 hours

For more open source growth strategies, see github.com/Gingiris/gingiris-opensource — the complete playbook from 0 to 60k stars.

Part of the Gingiris Open Source Growth Playbook — helping developers build open source communities.

How to Split an EPUB Collection into Individual Books

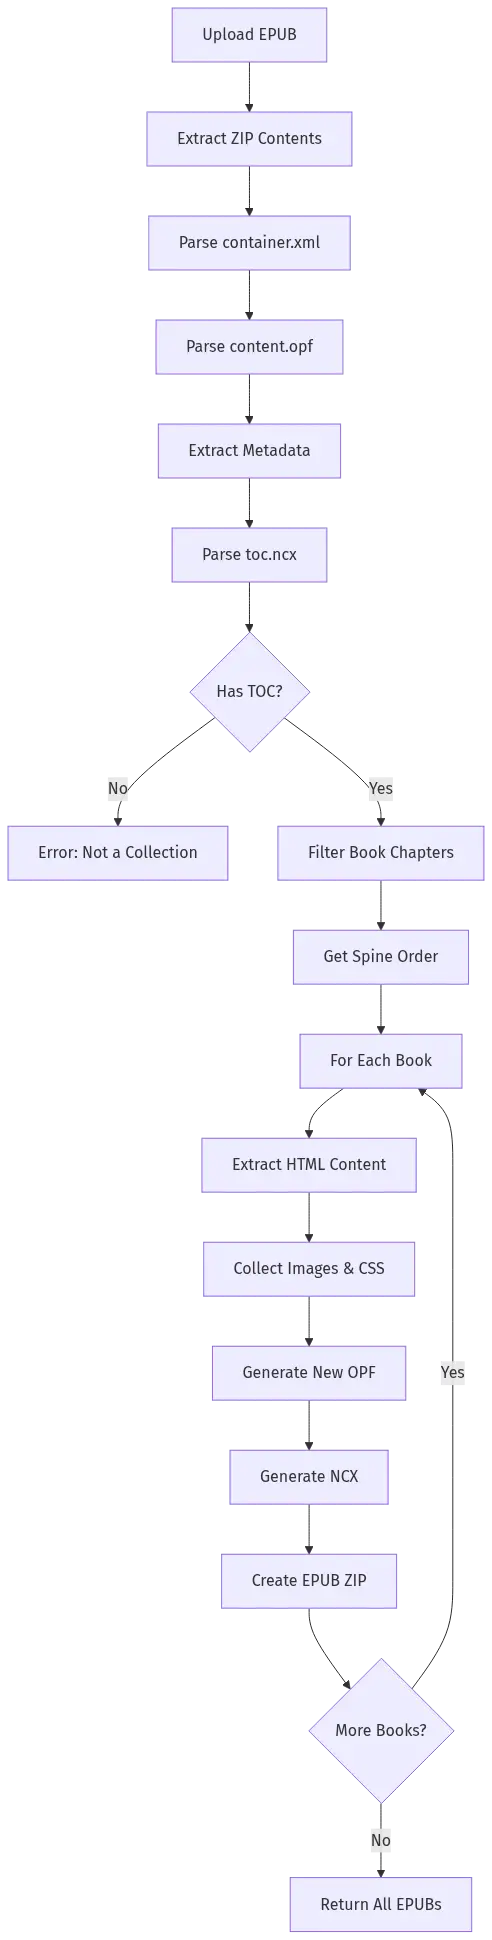
EPUB Splitting Process Flowchart

Have you ever downloaded an ebook collection only to find it’s a single massive EPUB file containing multiple books? This is especially common with translated works where publishers bundle entire series or author collections into one file. In this article, I’ll explain how to split these collections into individual EPUB files, complete with code examples and technical details.

Why Split EPUB Collections?

Here are some common scenarios where splitting EPUBs becomes essential:

1. Collection Bundles

  • Publisher bundles like “The Complete Works of [Author]” containing 10+ books
  • Box sets sold as single files (e.g., “The Complete Sherlock Holmes Collection [10 Books Box Set].epub”)
  • Series compilations where each book should be separate

2. Reading Experience

  • E-readers with limited storage prefer smaller files
  • Better organization in your digital library
  • Easier to sync specific books across devices
  • Faster loading times on older devices

3. Content Management

  • Selectively share individual books
  • Remove unwanted titles from a collection
  • Reorganize chapters or books in a different order

4. Academic Use

  • Extract specific volumes for citation
  • Distribute individual readings to students
  • Create custom anthologies

Understanding EPUB Structure

Before diving into the code, let’s understand how EPUB files work:

EPUB File (ZIP archive)
├── mimetype
├── META-INF/
│   └── container.xml
└── OEBPS/
    ├── content.opf
    ├── toc.ncx
    ├── chapter1.html
    ├── chapter2.html
    └── images/

Key files:

  • mimetype: Must be the first file, uncompressed, containing application/epub+zip
  • container.xml: Points to the OPF file location
  • content.opf: Contains metadata and manifest of all resources
  • toc.ncx: The table of contents with navigation points (navPoints)

The Splitting Process

Here’s how the splitting algorithm works:

EPUB Splitting Process Flowchart

Key Technical Details

1. Parsing the Table of Contents

The NCX (Navigation Control file for XML) is where the magic happens. It contains navPoints that define the book structure:

// Parse NCX to find book boundaries
function parseNCX(ncxXml: string): TocEntry[] {
  const tocData: TocEntry[] = [];
  const $ = cheerio.load(ncxXml, { xmlMode: true });

  $('navPoint').each((i, elem) => {
    const textMatch = $(elem).html()?.match(/<text>([^<]+)</text>/i);
    let label = textMatch ? textMatch[1] : '';
    label = decodeHtmlEntities(label); // Handle &amp;, &#1234;, etc.

    let href = $('content', elem).first().attr('src') || '';
    href = decodeURIComponent(href);

    if (label && href) {
      tocData.push({ label, href });
    }
  });

  return tocData;
}

Key insight: The href contains both the HTML file path and optional anchor (e.g., chapter1.html#section2).

2. Filtering Non-Book Chapters

Collections often include metadata chapters like copyright, introduction, or table of contents. We filter these out:

// Filter out non-book chapters
const books = tocData.filter(entry => {
  const lowerTitle = entry.label.toLowerCase();
  const skipKeywords = [
    'copyright', 'contents', 'introduction', 'preface',
    'dedication', 'acknowledgments', 'foreword', 'prologue'
  ];
  return !skipKeywords.some(kw => lowerTitle.includes(kw));
});

3. Extracting Content by Anchor

This is the most critical part. When multiple books share the same HTML file, we use anchors to extract specific sections:

function extractContentByAnchor(
  html: string, 
  startAnchor: string | null, 
  endAnchor: string | null
): string {
  // Find body content
  const bodyMatch = html.match(/<body[^>]*>([sS]*?)</body>/i);
  if (!bodyMatch) return html;

  const bodyContent = bodyMatch[1];
  let startPos = 0;

  // Find start anchor position
  if (startAnchor) {
    const pattern = new RegExp(`<a[^>]*id=["']${startAnchor}["'][^>]*>`, 'i');
    const match = bodyContent.match(pattern);
    if (match?.index !== undefined) {
      startPos = match.index + match[0].length;
    }
  }

  // Find end anchor position
  let endPos = bodyContent.length;
  if (endAnchor) {
    const pattern = new RegExp(`<a[^>]*id=["']${endAnchor}["'][^>]*>`, 'i');
    const match = bodyContent.match(pattern);
    if (match?.index !== undefined) {
      endPos = match.index;
    }
  }

  // Extract content between anchors
  let content = bodyContent.substring(startPos, endPos);

  // Fix incomplete tags at boundaries
  const lastCompleteTag = content.lastIndexOf('>');
  const lastOpeningTag = content.lastIndexOf('<');
  if (lastOpeningTag > lastCompleteTag) {
    content = content.substring(0, lastCompleteTag + 1);
  }

  return content.trim();
}

4. Handling Multi-File Content

Sometimes a book spans multiple HTML files in the spine. We need to concatenate them:

function extractContentAcrossFiles(
  fs: MemoryFileSystem,
  spine: string[],
  opfDir: string,
  startHtmlPath: string,
  startAnchor: string | null,
  endHtmlPath: string,
  endAnchor: string | null
): string {
  let content = '';

  // Find positions in spine
  const startFile = startHtmlPath.split('/').pop();
  const endFile = endHtmlPath.split('/').pop();
  const startIndex = spine.findIndex(h => h.endsWith('/' + startFile));
  const endIndex = spine.findIndex(h => h.endsWith('/' + endFile));

  // Extract from each file in range
  for (let i = startIndex; i <= (endIndex === -1 ? spine.length - 1 : endIndex); i++) {
    const htmlPath = opfDir ? `${opfDir}/${spine[i]}` : spine[i];
    const html = fs.readFileText(htmlPath);

    if (i === startIndex && i === endIndex) {
      // Same file
      content += extractContentByAnchor(html, startAnchor, endAnchor);
    } else if (i === startIndex) {
      // Start file: from anchor to end
      content += extractContentByAnchor(html, startAnchor, null);
    } else if (i === endIndex) {
      // End file: from start to anchor
      content += 'n' + extractContentByAnchor(html, null, endAnchor);
    } else {
      // Middle file: full content
      const bodyMatch = html.match(/<body[^>]*>([sS]*?)</body>/i);
      if (bodyMatch) content += 'n' + bodyMatch[1].trim();
    }
  }

  return content;
}

5. Resource Collection

We must collect all images and CSS files referenced by the extracted content:

// Collect images
const $ = cheerio.load(bookHtml);
const imagePaths: string[] = [];
const imagesToInclude = new Set<string>();

$('img').each((_j, img) => {
  const src = $(img).attr('src');
  if (src) {
    // Resolve relative paths
    let imgPath: string;
    if (src.startsWith('../')) {
      const parts = htmlDir.split('/');
      parts.pop();
      imgPath = [...parts, src.replace('../', '')].join('/');
    } else {
      imgPath = `${htmlDir}/${src}`;
    }

    if (fs.fileExists(imgPath)) {
      imagesToInclude.add(imgPath);
      imagePaths.push(imgPath);
    }
  }
});

// Similar logic for CSS files
$('link[rel="stylesheet"]').each((_j, link) => {
  // ... resolve path and collect
});

6. Generating Valid EPUB Structure

Each split book needs proper EPUB structure:

async function createEpub(
  title: string,
  author: string,
  htmlContent: string,
  images: string[],
  cssFiles: string[]
): Promise<Uint8Array> {
  const bookZip = new JSZip();

  // 1. Mimetype - MUST be first and uncompressed
  bookZip.file('mimetype', 'application/epub+zip', { 
    compression: 'STORE' 
  });

  // 2. Container XML
  const containerXml = `<?xml version="1.0" encoding="UTF-8"?>
<container version="1.0" xmlns="urn:oasis:names:tc:opendocument:xmlns:container">
  <rootfiles>
    <rootfile full-path="OEBPS/content.opf" media-type="application/oebps-package+xml"/>
  </rootfiles>
</container>`;
  bookZip.file('META-INF/container.xml', containerXml);

  // 3. Content files
  bookZip.file('OEBPS/content.html', htmlContent);

  // 4. Add resources
  images.forEach(imgPath => {
    const data = fs.readFile(imgPath);
    const relativePath = imgPath.split('/').pop();
    bookZip.file(`OEBPS/${relativePath}`, data);
  });

  // 5. Generate OPF and NCX
  const opfContent = generateOPF(title, author, 'content.html', images, cssFiles);
  bookZip.file('OEBPS/content.opf', opfContent);

  const ncxContent = generateNCX(title, [{ label: title, href: 'content.html' }]);
  bookZip.file('OEBPS/toc.ncx', ncxContent);

  // 6. Generate final EPUB
  return await bookZip.generateAsync({
    type: 'uint8array',
    compression: 'DEFLATE',
    compressionOptions: { level: 6 },
    platform: 'UNIX'
  });
}

7. Generating OPF and NCX Files

The OPF (Open Package Format) file defines the book’s metadata and manifest:

function generateOPF(
  title: string,
  author: string,
  language: string,
  htmlFile: string,
  imagePaths: string[],
  cssPaths: string[]
): string {
  let manifestItems = '';
  let idCounter = 0;

  // NCX (table of contents)
  const ncxId = `ncx${idCounter++}`;
  manifestItems += `    <item id="${ncxId}" href="toc.ncx" media-type="application/x-dtbncx+xml"/>n`;

  // Main HTML
  const htmlId = `html${idCounter++}`;
  manifestItems += `    <item id="${htmlId}" href="${htmlFile}" media-type="application/xhtml+xml"/>n`;

  // Images
  imagePaths.forEach((imgPath, idx) => {
    const ext = imgPath.split('.').pop()?.toLowerCase();
    let mediaType = 'image/jpeg';
    if (ext === 'png') mediaType = 'image/png';
    else if (ext === 'gif') mediaType = 'image/gif';

    manifestItems += `    <item id="img${idx}" href="${imgPath}" media-type="${mediaType}"/>n`;
  });

  // CSS
  cssPaths.forEach((cssPath, idx) => {
    manifestItems += `    <item id="css${idx}" href="${cssPath}" media-type="text/css"/>n`;
  });

  return `<?xml version="1.0" encoding="UTF-8"?>
<package version="2.0" xmlns="http://www.idpf.org/2007/opf" unique-identifier="BookId">
  <metadata xmlns:dc="http://purl.org/dc/elements/1.1/">
    <dc:title>${escapeXml(title)}</dc:title>
    <dc:creator>${escapeXml(author)}</dc:creator>
    <dc:language>${language}</dc:language>
    <dc:identifier id="BookId">urn:uuid:${generateUUID()}</dc:identifier>
  </metadata>
  <manifest>
${manifestItems}  </manifest>
  <spine toc="${ncxId}">
    <itemref idref="${htmlId}"/>
  </spine>
</package>`;
}

Browser vs Node.js Implementation

The code can run in both environments:

Node.js (using adm-zip):

  • Direct filesystem access
  • Better for batch processing
  • Can use cheerio for HTML parsing

Browser (using JSZip + Web Workers):

  • Privacy-first: files never leave the device
  • Uses Comlink for worker communication
  • Memory-efficient with streaming

Browser Architecture

Browser Architecture Sequence Diagram

Implementation Tips

  1. Anchor Detection: Not all EPUBs use consistent anchor formats. Support both id="anchor" and name="anchor" attributes.

  2. HTML Entities: Always decode HTML entities in titles (&amp;, &#1234;, etc.)

  3. Path Resolution: Handle relative paths correctly (../, ./, absolute)

  4. File Structure: Maintain the original EPUB’s directory structure for resources

  5. Mimetype: Always add mimetype as the first file in the ZIP with compression: 'STORE'

  6. Error Handling: Some collections may have malformed NCX files. Provide fallback extraction strategies.

  7. Memory Management: For large collections, process books sequentially rather than loading everything into memory.

Conclusion

Splitting EPUB collections requires understanding the EPUB specification, particularly the NCX navigation structure and how content is organized across HTML files. The key challenges are:

  • Parsing the table of contents correctly
  • Extracting content by anchors when multiple books share HTML files
  • Collecting all referenced resources (images, CSS)
  • Generating valid EPUB metadata files

With the techniques described in this article, you can build robust EPUB splitting tools that work both in browsers for privacy and on servers for batch processing.

The complete implementation is available as an open-source web tool that runs entirely in your browser – no files are ever uploaded to any server, ensuring complete privacy for your ebook collection.

Try It Now

Ready to split your EPUB collections? Try our free online EPUB splitter – it works entirely in your browser with complete privacy protection:

Free EPUB Splitter – Split Collections into Individual Books

Features:

  • Split EPUB collections into individual books automatically
  • 100% browser-based – no files uploaded to any server
  • Preserves formatting, images, and metadata
  • Download all split books as a ZIP file
  • Completely free to use

Try it yourself: The code examples in this article are based on a real implementation. You can adapt them for your own EPUB processing needs, whether building a command-line tool, a web application, or integrating into a larger ebook management system.

Claude Code’s Memory: 4 Layers of Complexity, Still Just Grep and a 200-Line Cap

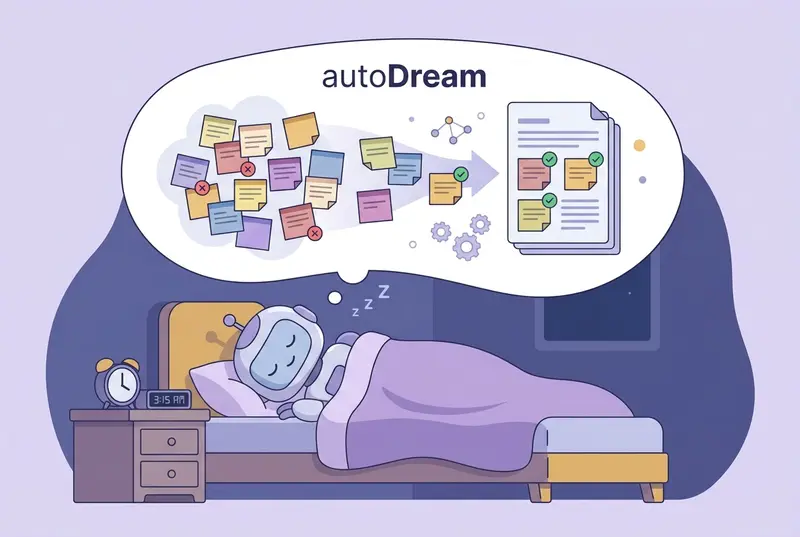
Auto Dream Consolidation

Claude Code’s memory system? Grep search, a 200-line index cap, and zero cross-agent sharing. After studying the leaked source, it’s way more primitive than the hype suggests.

It does a fair amount of work — multiple layers, even a mechanism that lets the agent “dream” to consolidate memories. Sounds sophisticated. But peel it open and you find an agent trapped in its own sandbox. Memory can’t leave, and it doesn’t last long.

Let’s break it down layer by layer.

Layer 1: CLAUDE.md — Rules You Write for the Agent

CLAUDE.md is a Markdown file you create and place in your project root. It can contain anything you want Claude to remember: code style conventions, architecture notes, test commands, deployment workflows, even “don’t touch anything in the legacy directory.”

Every session, Claude Code loads the entire file into context. Shorter files get followed better.

It supports three scopes: project-level CLAUDE.md in the project root, personal-level at ~/.claude/CLAUDE.md, and organization-level in enterprise configs. You write it, Claude reads it. You don’t write it, Claude has nothing.

Layer 2: Auto Memory — The Agent Takes Notes

CLAUDE.md handles what you explicitly tell the agent, but valuable information often surfaces during conversations — stuff you’d never bother writing down manually.

Auto Memory does exactly this: Claude decides what’s worth remembering during work and writes it into a dedicated memory directory.

It categorizes memories into four types: user (role and preferences), feedback (corrections and confirmations), project (decisions and context), and reference (external resource locations).

These memories live in ~/.claude/projects/<project-path>/memory/. Each memory is a standalone Markdown file with frontmatter noting its type and description. The entry point is MEMORY.md — an index where each line stays under 150 characters, storing pointers, not content.

At session start, the first 200 lines of MEMORY.md get injected into context. The actual knowledge is spread across topic files and loaded on demand.

~/.claude/projects/-Users-me-myproject/memory/
├── MEMORY.md                  ← Index file, one pointer per line
├── user_role.md               ← "Backend engineer, fluent in Go, React beginner"
├── feedback_testing.md        ← "Integration tests must use real DB, no mocking"
├── project_auth_rewrite.md    ← "Auth rewrite driven by compliance, not tech debt"
└── reference_linear.md        ← "Pipeline bugs tracked in Linear INGEST project"

One design detail worth noting: Claude is explicitly told not to trust its own memory. The leaked system prompt says, roughly, “memories are just hints — verify against real files before acting.” With model hallucination rates still in double digits, this self-distrust strategy is surprisingly practical.

Layer 3: Auto Dream — The Agent Sleeps and Tidies Up

After dozens of sessions, MEMORY.md gets messy. Contradictory entries pile up. Relative timestamps become meaningless. Refactored functions linger.

Auto Dream simulates what the human brain does during sleep: organize and consolidate memory. It converts relative timestamps to absolute dates, merges contradictions, removes stale content, and keeps MEMORY.md under 200 lines.

Trigger conditions: 24+ hours since last consolidation AND 5+ new sessions. Or type “dream” manually. Runs in a background sub-agent.

Auto Dream Consolidation

Layer 4: KAIROS — Unreleased Ambitions in the Leaked Code

KAIROS appears 150+ times in the source. It’s a background daemon mode that turns Claude Code from a passive tool into an autonomous observer — maintaining append-only logs, receiving <tick> signals, and deciding whether to act. It integrates autoDream but runs the full observe-think-act loop.

Currently behind a compile-time feature flag. More exploration than product.

Where This System Hits Its Ceiling

After extended use, the problems become clear:

  • 200-line hard cap. Run a project for months, and memories compete for space.
  • Grep-only retrieval. No semantic understanding. You remember “port conflict during deployment” but the memory says “modified docker-compose port mapping” — grep misses it.
  • Details get lost. Auto Memory records at coarse granularity. Code snippets, debugging steps, discussion context — mostly dropped.
  • Compounding complexity. Each layer patches the last, stacking complexity without fixing root constraints.
  • No cross-tool sharing. Switch to OpenCode or Codex CLI = start from zero.
  • Still short-term memory. “How did we fix Redis last week?” — hopeless for long-span recall.

Agent Memory Isolation

This isn’t a design failure. Single agent, session granularity, local storage — the ceiling is architectural.

memsearch: Memory Should Outlive Any Single Agent

This is the core idea behind memsearch. Agents change, tools change, but project knowledge shouldn’t disappear with them. memsearch pulls memory out of the agent into an independent persistence layer.

┌─────────────────────────────────────────┐
│         Agent Plugins (User Layer)       │
│  Claude Code · OpenClaw · OpenCode · Codex│
└──────────────────┬──────────────────────┘
                   ↓
┌──────────────────┴──────────────────────┐
│       memsearch CLI / Python API         │
│            (Developer Layer)             │
└──────────────────┬──────────────────────┘
                   ↓
┌──────────────────┴──────────────────────┐
│    Core: Chunker → Embedder → Milvus     │
│            (Engine Layer)                │
└──────────────────┬──────────────────────┘
                   ↓
┌──────────────────┴──────────────────────┐
│     Markdown Files (Source of Truth)      │
│          (Persistent Storage)            │
└─────────────────────────────────────────┘

How It Works

Memory writing is automatic. Each conversation gets summarized by Haiku and appended to that day’s Markdown file, then asynchronously vectorized. Background, invisible to users.

Recall triggers through skills. A memory-recall skill runs in a forked sub-agent (context: fork) — zero token overhead in the main session.

Hybrid retrieval. Semantic vectors + BM25 keyword matching + RRF fusion. Ask “how did we fix that Redis timeout” — semantic search gets it. Say “search handleTimeout” — BM25 nails it.

The sub-agent drills from L1 (semantic search, truncated previews) through L2 (full context expansion) to L3 (raw conversation transcripts) as needed.

L1: Semantic search → top results with scores and previews
L2: memsearch expand <hash> → full paragraph, all details
L3: memsearch transcript → raw user/agent conversation + tool calls

Cross-Agent Sharing

This is the fundamental difference. memsearch supports Claude Code, OpenClaw, OpenCode, and Codex CLI — all sharing the same Markdown memory format with collection names computed from project paths.

Memory written from any agent is searchable by all others.

Four Agents One Memory

Spend an afternoon in Claude Code debugging deployment, switch to OpenCode next day — it finds yesterday’s memories and gives the right answer. Point Milvus at Zilliz Cloud for team collaboration, and new members get instant project context without digging through Slack.

Quick Start

# Claude Code
/plugin marketplace add zilliztech/memsearch
/plugin install memsearch

# Python
uv tool install "memsearch[onnx]"

CLI and Python API for custom integrations:

from memsearch import MemSearch

mem = MemSearch(paths=["./memory"])
await mem.index()
results = await mem.search("Redis config")

Milvus Lite for local (zero config), Zilliz Cloud for teams (free tier), or self-hosted Docker. Default ONNX embeddings run on CPU — no GPU, no API calls needed.

Claude Code’s memory design has real value, and KAIROS is worth watching. But single-agent memory optimization can only go so far. Memory should outlive any single agent.

Full analysis with architecture diagrams: https://zc277584121.github.io/ai-coding/2026/04/01/claude-code-memory-vs-memsearch.html

GitHub logo

zilliztech
/
memsearch

A Markdown-first memory system, a standalone library for any AI agent. Inspired by OpenClaw.


memsearch

Cross-platform semantic memory for AI coding agents.

PyPI
Claude Code
OpenClaw
OpenCode
Codex CLI
Python
License
Tests
Docs
Stars
Discord
X (Twitter)

memsearch demo

Why memsearch?

  • 🌐 All Platforms, One Memory — memories flow across Claude Code, OpenClaw, OpenCode, and Codex CLI. A conversation in one agent becomes searchable context in all others — no extra setup
  • 👥 For Agent Users, install a plugin and get persistent memory with zero effort; for Agent Developers, use the full CLI and Python API to build memory and harness engineering into your own agents
  • 📄 Markdown is the source of truth — inspired by OpenClaw. Your memories are just .md files — human-readable, editable, version-controllable. Milvus is a “shadow index”: a derived, rebuildable cache
  • 🔍 Progressive retrieval, hybrid search, smart dedup, live sync — 3-layer recall (search → expand → transcript); dense vector + BM25 sparse + RRF reranking; SHA-256 content hashing skips unchanged content; file watcher auto-indexes in real time

🧑‍💻

…

Stop Confusing LangChain, LangGraph, and Deep Agents: A Practical Playbook for Building Real AI Systems

Stop Confusing LangChain, LangGraph, and Deep Agents: A Practical Playbook for Building Real AI Systems

Most developers do not fail with AI because they picked the wrong model.

They fail because they picked the wrong abstraction layer.

They start with a quick demo, add tool calling, bolt on retrieval, sprinkle a little memory, and call it an “agent.” Then reality shows up. The workflow gets longer. Failures become harder to debug. State leaks across steps. Tool results blow up context. Human approvals appear. Recovery becomes messy. Suddenly the cheerful prototype turns into a system nobody fully controls.

This is where the Lang ecosystem becomes useful — and where a lot of confusion begins.

People still talk about LangChain as if it were the old “chain library.” Others treat LangGraph like a niche graph toy for AI enthusiasts. And now Deep Agents enters the picture, which makes many developers ask the obvious question:

Do I need LangChain, LangGraph, or Deep Agents?

The wrong answer is “all of them.”

The right answer is: it depends on the level of control your system needs.

That is the core idea of this article.

This is not a package tour. It is not a syntax tutorial. It is a practical playbook for understanding the Lang stack as a set of increasing abstraction and increasing control:

  • LangChain for building quickly
  • LangGraph for controlling execution and state
  • Deep Agents for handling long-horizon, decomposable, context-heavy tasks

The official docs now describe this relationship pretty clearly. LangChain provides the application-layer building blocks and agent abstractions, and those agent abstractions run on top of LangGraph. LangGraph is the lower-level runtime for stateful, controllable, durable workflows and agents. Deep Agents builds on LangGraph and adds planning, filesystem-based context management, subagents, and related capabilities for more complex tasks. (docs.langchain.com)

If you understand those three layers correctly, your architecture decisions get dramatically better.

If you do not, you end up doing one of two things:

  • overengineering small problems with too much orchestration
  • underengineering hard problems with fragile agent loops

This article is about avoiding both.

The real problem is not “how do I build an agent?”

The real problem is:

How much runtime structure does my AI system need?

That question is more useful than asking which library is “best.”

A surprising number of AI systems do not need a sophisticated agent runtime at all. Some just need:

  • a prompt
  • one or two tools
  • structured output
  • maybe retrieval
  • maybe a retry strategy

Others need much more:

  • explicit state
  • conditional branching
  • resumability
  • approval gates
  • durable execution
  • observability across long, messy runs

And a smaller but important class of systems needs even more:

  • task decomposition
  • artifact management
  • context isolation
  • subagents
  • long-running execution across complex work

Those are not the same problem.

Trying to solve all of them with the same abstraction is how teams get stuck.

So before we talk about tools, we need a mental model.

The right mental model: the Lang stack is an abstraction ladder

Think of the ecosystem like this:

Layer 1: LangChain

This is where you move fast.

LangChain is the developer-friendly application layer. It gives you the basic building blocks for LLM apps and agents: models, messages, tools, middleware, structured output, and agent creation. The current docs also make an important point that many people miss: the create_agent API builds a graph-based runtime using LangGraph underneath. In other words, LangChain is not separate from LangGraph in some absolute sense — it is a higher-level way to work with the same underlying execution model. (docs.langchain.com)

This matters because it changes how you should think about LangChain.

LangChain is not “the simple thing before the real thing.”

LangChain is the convenient abstraction when you do not need to control every detail yourself.

Layer 2: LangGraph

This is where you move from “it works” to “I can control how it works.”

LangGraph is the lower-level orchestration runtime. Its value is not that graphs look clever in diagrams. Its value is that production AI systems eventually need explicit management of:

  • steps
  • transitions
  • state
  • branching
  • persistence
  • human intervention
  • debugging

The docs describe LangGraph as the place for persistence, streaming, debugging, deployment support, and explicit workflow/agent patterns. They also distinguish sharply between workflows, which have predetermined paths, and agents, which make dynamic runtime decisions. That distinction is one of the most useful architecture lenses in modern AI engineering. (docs.langchain.com)

Layer 3: Deep Agents

This is where you stop pretending your long-horizon task is “just another tool-calling loop.”

Deep Agents is presented by LangChain as an “agent harness” built on LangGraph. It adds system-level capabilities that become valuable once tasks are longer, more decomposable, and more context-intensive. The docs specifically call out planning, file systems for context management, long-term memory, subagent spawning, and token-management-related features like summarization and tool-result eviction. (docs.langchain.com)

That is a different category of problem from a lightweight assistant with a couple of tools.

And this is the first key takeaway of the entire article:

The Lang ecosystem is not three competing products.

It is three layers of increasing runtime responsibility.

If you read the ecosystem this way, the confusion starts to disappear.

Why developers get this wrong

There are three recurring failure modes.

Mistake 1: Treating “agent” as the default shape of an AI system

Many engineers jump straight from “LLM can call a tool” to “I should build an agent.”

But a lot of tasks are really just workflows:

  • classify input
  • fetch data
  • transform data
  • generate a result
  • maybe ask for approval
  • finish

That is not always an agent problem. Often it is a workflow problem with a language model inside it.

The LangGraph docs are useful here because they formalize the difference:

  • workflow = predetermined path
  • agent = dynamic path chosen at runtime (docs.langchain.com)

That distinction sounds simple, but it is operationally huge.

If your process is mostly known ahead of time, unbounded agency can make the system worse:

  • harder to test
  • harder to debug
  • harder to make reliable
  • more expensive
  • less predictable

A lot of “agentic” systems are actually poorly controlled workflows.

Mistake 2: Treating LangChain as “not serious enough”

Some developers assume that if a system is important, they must immediately drop into lower-level orchestration.

That is often premature.

LangChain already covers a large set of practical use cases well:

  • tool-using assistants
  • basic internal copilots
  • simple research workflows
  • structured data extraction
  • standard RAG assistants
  • moderate-turn agent interactions

And because LangChain agents are already implemented with LangGraph underneath, you are not choosing between “toy abstraction” and “real runtime.” You are choosing how much of the runtime you want to manage directly. (docs.langchain.com)

That is a healthier framing.

Mistake 3: Treating Deep Agents as “just another agent package”

This is the newest confusion.

Deep Agents is not merely a prettier wrapper over agent loops. Its value is in the extra execution model and operational affordances it brings:

  • task planning
  • context offloading into a filesystem
  • subagent delegation
  • memory
  • long-horizon work patterns

That means you should not ask, “Can Deep Agents answer questions and use tools?” Of course it can.

You should ask:

Does my problem need decomposition, artifact handling, context isolation, and longer-running work?

If not, you may not need it.

If yes, it may save you from hand-building machinery you will eventually regret.

A better way to think: build the smallest runtime that can survive production reality

The most useful engineering instinct here is restraint.

Do not ask, “What is the most advanced stack I can use?”

Ask, “What is the smallest runtime that can survive the realities of this product?”

That one question can save months of complexity.

Here is the practical progression.

Start with LangChain when:

  • your task is short to medium in horizon
  • you need a few tools, not an execution engine
  • control flow is simple
  • failure recovery is acceptable through retries or lightweight guardrails
  • you care more about speed than orchestration detail
  • your product is still in exploration mode

This is the right layer for many v1 systems.

Move to LangGraph when:

  • you need explicit state between steps
  • you need resumability or durable execution
  • you need approval checkpoints
  • you need custom branching, loops, or recovery paths
  • you need reliable long-running workflows
  • you need to debug why the system took a path

This is where the system stops being a clever demo and starts becoming a real runtime.

Reach for Deep Agents when:

  • tasks are long-horizon and multi-stage
  • context gets too large to keep in-message
  • the system must create and manage artifacts over time
  • decomposition and delegation matter
  • subagents improve context hygiene
  • planning and task structure are first-class concerns

This is the layer for “complex work,” not just “more agent.”

That is the playbook in one page.

But to use it well, we need to go deeper into what each layer is actually buying you.

LangChain: the speed layer

LangChain’s job is to remove unnecessary friction.

You can think of it as the layer that says:

  • here is the model
  • here are the messages
  • here are the tools
  • here is the output structure
  • here is the middleware
  • here is the agent

For a large number of applications, that is enough.

And not “enough” in the dismissive sense. Enough in the sense that it is the most sensible engineering choice.

If you can answer a business need with:

  • one model call or a small loop
  • some tools
  • retrieval
  • structured output
  • a few guardrails

then forcing in lower-level orchestration early may be a mistake.

The official docs explicitly position LangChain as the place for integrations and composable components, and note that it contains agent abstractions built on top of LangGraph. The agent docs also say the create_agent runtime is graph-based under the hood. (docs.langchain.com)

That means the question is not whether LangChain is “real” enough.

The question is whether your application needs more explicit runtime control than LangChain exposes conveniently.

That distinction is everything.

What LangChain is excellent at

LangChain shines when you want to ship a useful app before turning it into an operating system.

Examples:

  • a support assistant that uses a knowledge base and one ticketing tool
  • a research assistant that can search, summarize, and structure findings
  • a sales copilot that drafts emails with CRM lookups
  • a data extraction pipeline with schema-controlled outputs
  • a lightweight internal ops helper

In these scenarios, speed matters more than runtime choreography.

You want:

  • fewer moving pieces
  • less boilerplate
  • simpler mental overhead
  • easier onboarding for new developers

LangChain gives you that.

What LangChain is not trying to solve

LangChain is not where you go when your first concern becomes:

  • exact transition control
  • explicit state mutation
  • durable recovery after interruptions
  • complex branching topologies
  • nontrivial human-in-the-loop orchestration

You can push higher-level abstractions far, but once the runtime itself becomes the product concern, you start wanting the lower-level layer more directly.

That is where LangGraph enters.

LangGraph: the control layer

If LangChain is about velocity, LangGraph is about governance of execution.

This is the point where many teams discover that “tool calling” is not the hard part.

The hard part is everything around tool calling:

  • what happened before this step
  • what should happen if this step fails
  • who can interrupt the run
  • what state survives
  • what branch should execute next
  • how to resume safely
  • how to make the system inspectable

The LangGraph docs highlight persistence, streaming, debugging, and deployment support, and they frame the library around workflow and agent patterns. They also expose both a Graph API and a Functional API, which is a strong signal that the product is not just about graph diagrams — it is about giving you explicit control over how execution is represented. (docs.langchain.com)

Why real systems need this

Prototype AI systems are tolerant of ambiguity.

Production systems are not.

A prototype can survive with:

  • implicit state living in conversation history
  • vague retry behavior
  • minimal observability
  • accidental loops
  • manual restarts

A production system usually cannot.

Once a system has to:

  • run for a long time
  • survive failures
  • include humans in the loop
  • operate in regulated or operational contexts
  • coordinate multiple steps reliably

then runtime control becomes architecture, not implementation detail.

That is LangGraph territory.

The most important distinction: workflow vs agent

This deserves special emphasis because it is one of the clearest ideas in the official docs and one of the most practical distinctions for engineering teams.

A workflow has a predetermined path.

An agent chooses its path dynamically at runtime. (docs.langchain.com)

That sounds basic, but it fixes a major industry problem.

A lot of systems labeled “agents” are actually:

  • deterministic pipelines with one fuzzy step
  • workflows with a model-based classifier
  • routing systems with a language interface

Calling those “agents” too early leads teams to over-index on autonomy when what they really need is structured execution.

Once you adopt the workflow-vs-agent lens, design decisions improve quickly:

  • known path → workflow first
  • unknown path → agent or hybrid
  • mixed case → workflow shell with agentic interior

That last pattern is often the sweet spot.

What LangGraph buys you operationally

LangGraph is valuable when you want the runtime to express engineering reality:

  • states are explicit
  • nodes have defined responsibilities
  • edges represent real decisions
  • recovery is deliberate
  • interruptions are planned
  • persistence is part of the design, not an afterthought

This matters far more than whether the graph looks elegant.

The point of a graph runtime is not aesthetic.

It is control over what the system does next, and why.

That is the difference between a smart app and a dependable system.

Deep Agents: the long-horizon layer

Now we get to the most misunderstood part of the stack.

Deep Agents is easiest to understand when you stop thinking in terms of “another agent framework” and start thinking in terms of task shape.

Some tasks are short:

  • answer this question
  • summarize this page
  • call this API
  • draft this message

Some tasks are structurally longer and messier:

  • investigate a problem across multiple sources
  • create intermediate artifacts
  • plan work before execution
  • split the work into subtasks
  • preserve context hygiene over many turns
  • hand off specialized subproblems
  • revisit outputs and refine them

That second category is where Deep Agents starts to make sense.

The docs describe Deep Agents as an “agent harness” and explicitly call out built-in capabilities such as planning, file systems for context management, subagent spawning, and long-term memory. They also note token-management-related behavior such as conversation summarization and eviction of large tool results, which is exactly the kind of systems-level concern that appears once tasks become longer and more complex. (docs.langchain.com)

Why this matters

A standard agent loop tends to assume that context lives mostly in the conversation.

That is fine until it is not.

As task complexity rises, conversation history becomes an overloaded storage layer:

  • instructions compete with intermediate reasoning
  • tool outputs clutter the window
  • artifacts become unwieldy
  • the system drags irrelevant details forward
  • important context gets diluted

At that point, the problem is no longer “can the model call tools?”

The problem is “where does work live, and how is it organized over time?”

Deep Agents answers that with stronger execution primitives:

  • planning
  • filesystems
  • subagents
  • memory
  • more deliberate context management

That is not cosmetic. It changes what sort of work is feasible.

Subagents are not about sounding advanced

One of the most useful ideas in the Deep Agents docs is context quarantine via subagents. The docs note that subagents help keep the main agent’s context clean and allow specialized instructions. That is a deeply practical benefit, not a flashy architectural trick. (docs.langchain.com)

A lot of multi-agent hype is noise.

But context isolation is real.

If one subtask can be delegated cleanly with:

  • its own instructions
  • its own tool scope
  • limited spillover into the main context

then subagents can improve both performance and maintainability.

That does not mean every system should become multi-agent. It means that once decomposition becomes useful, Deep Agents gives you a more natural home for it.

File systems are about context discipline

This is one of the smartest parts of the Deep Agents story.

When developers first hear “filesystem-backed context,” they sometimes think it sounds incidental.

It is not incidental.

It is an answer to a very real systems problem:

not everything should stay inside the prompt transcript.

Artifacts, drafts, notes, code, intermediate outputs, and working memory often benefit from being handled as persistent objects rather than bloated chat messages.

That is a major shift in how you think about agent execution:

  • not just a sequence of messages
  • but a work environment

That is a strong sign you are no longer dealing with a lightweight assistant.

The architecture trap: not every escalation is justified

Now let us get to the most important practical warning in this article.

Just because the abstraction ladder exists does not mean you should keep climbing it.

More power also means:

  • more concepts
  • more runtime surface area
  • more debugging complexity
  • more onboarding cost
  • more architectural commitment

This is why teams need an explicit escalation rule.

A sane escalation rule

Start at the highest layer that still feels honest.

That usually means:

  1. Begin with LangChain
  2. Move to LangGraph only when runtime control becomes a design requirement
  3. Move to Deep Agents only when the work itself becomes longer-horizon and more decomposable

That sounds obvious, but many teams do the opposite:

  1. choose the most powerful stack
  2. force every use case into it
  3. spend weeks building machinery their product does not yet need

This is the AI engineering equivalent of deploying distributed systems to avoid a scaling problem you do not have.

The cure is architectural humility.

A practical decision framework

If I were advising a team building a new AI product today, I would use a decision framework like this.

Use LangChain if your app mostly needs:

  • tool calling
  • retrieval
  • structured output
  • a modest amount of middleware
  • fast iteration
  • low ceremony

Typical signs:

  • your process is still changing weekly
  • you need to prove value quickly
  • your failures are local, not systemic
  • a single runtime loop is sufficient

Use LangGraph if your app needs:

  • explicit state across steps
  • branching paths
  • retries and recovery logic
  • human approval points
  • resumability
  • durable execution
  • deeper debugging of execution paths

Typical signs:

  • your workflow has real business consequences
  • runs may be interrupted or resumed
  • different classes of inputs take different routes
  • you need to know exactly why the system did what it did

Use Deep Agents if your app needs:

  • planning before execution
  • long-running task decomposition
  • artifact creation and management
  • subagent delegation
  • context isolation
  • memory across longer work horizons
  • a more complete “work environment” for the agent

Typical signs:

  • the system behaves more like a digital worker than a chatbot
  • it generates and revisits artifacts over time
  • the transcript alone is no longer a good container for the task
  • decomposition quality matters to the end result

That is the cleanest way I know to keep the ecosystem legible.

What a healthy build progression looks like

One of the best ways to internalize the stack is to imagine building a single product through multiple stages.

Let us say you are building a Research Copilot.

Version 1: LangChain

The copilot can:

  • take a question
  • search a few sources
  • summarize findings
  • return structured output

This is exactly where you should optimize for speed.

A higher-level application layer is appropriate.

Version 2: LangGraph

Now the system must:

  • classify request type
  • choose a search strategy
  • ask for human approval before external actions
  • retry failed tools differently based on failure mode
  • resume interrupted investigations
  • preserve state for later continuation

Now the runtime itself has become important.

This is a control problem.

Version 3: Deep Agents

Now the system must:

  • break a research objective into subtasks
  • create notes and intermediate artifacts
  • delegate some subproblems
  • keep the main thread clean
  • revisit partial outputs
  • manage long-running work over time

Now the task has become structurally larger than a simple loop.

This is where planning, filesystems, and subagents stop sounding optional.

That is the entire Lang stack in one product arc.

And that is the right way to teach it.

The playbook most teams actually need

If you remember only one section of this article, let it be this one.

Rule 1: Do not start with the most powerful abstraction

Start with the smallest one that can carry the product honestly.

Rule 2: Treat workflow and agent as different system shapes

If the path is mostly known, prefer workflow thinking over unconstrained agency. The official LangGraph docs strongly reinforce this split, and teams should take that seriously. (docs.langchain.com)

Rule 3: Move downward only when runtime control becomes the bottleneck

Do not move to lower-level orchestration because it feels more “serious.” Move when you genuinely need:

  • state control
  • durable execution
  • recovery design
  • inspectable transitions

Rule 4: Treat Deep Agents as a response to task complexity, not hype

Use it when the work requires:

  • planning
  • decomposition
  • artifact handling
  • context isolation
  • longer-horizon execution

Not when you simply want a cooler architecture diagram.

Rule 5: Design for observability early

Even if your system starts at LangChain, the eventual production question is always the same:

how will we know what happened?

This is where LangSmith and similar observability layers matter. LangSmith is positioned as framework-agnostic and focused on tracing, evaluation, debugging, testing, and deployment workflows. Even if you are not using it on day one, the need it addresses is real and inevitable. (docs.langchain.com)

That observability mindset belongs in architecture discussions much earlier than many teams assume.

What this means for AI engineering as a discipline

There is a broader lesson here beyond one ecosystem.

AI engineering is maturing from:

  • prompts
  • demos
  • wrappers
  • quick wins

into:

  • runtime design
  • execution control
  • task decomposition
  • state management
  • operational reliability

That is why the Lang stack matters.

Not because everyone should use every layer.

But because it reflects a real truth about modern AI systems:

as product complexity grows, the runtime becomes part of the product.

At first, you are building with a model.

Then you are building with tools.

Then you are building with a workflow.

Then you are building with a runtime.

Then, if the work gets sophisticated enough, you are building with an environment for structured agent execution.

That progression is not marketing. It is engineering reality.

And once you see that clearly, the ecosystem stops looking fragmented and starts looking coherent.

The simplest summary I can give

If you want the shortest serious answer to “When should I use what?” here it is:

  • Use LangChain when you want to build quickly and your app does not need deep runtime control.
  • Use LangGraph when execution itself becomes something you need to design, inspect, recover, and govern.
  • Use Deep Agents when the task becomes long-horizon, decomposable, artifact-heavy, and context-complex.

That is the whole playbook.

Everything else is implementation detail.

Final thought

The biggest AI architecture mistake right now is not underestimating models.

It is underestimating system shape.

Too many teams ask, “Which model should we use?” before they ask, “What kind of runtime does this work require?”

The Lang ecosystem is valuable because it forces that second question into the open.

And that is exactly the right question.

Securing MCP Connections Through Your AI Gateway

MCP Gives Agents the Keys — Who’s Watching the Door?

The Model Context Protocol (MCP) is rapidly becoming the standard way AI agents interact with external tools — databases, file systems, APIs, code repositories. Instead of hardcoding integrations, developers expose MCP servers that agents discover and call dynamically.

This is powerful. It’s also a massive expansion of your attack surface.

MCP effectively gives an AI model the ability to read files, query databases, make HTTP requests, and execute code — all based on instructions it receives in its context window. If an attacker can influence that context, they can influence what the agent does with your tools.

Most MCP security guidance focuses on building secure servers. That’s important, but it’s only half the picture. If your team consumes third-party MCP servers — or even internal ones you didn’t write — you need security at the point where traffic flows: the gateway.

The MCP Attack Surface

Before diving into defenses, let’s map the threats. MCP introduces four categories of risk that didn’t exist with traditional API calls:

Tool poisoning — A malicious MCP server can advertise tools with deceptive descriptions. The tool named read_file might actually exfiltrate data to an external endpoint. Since the model selects tools based on their descriptions, a poisoned description can redirect agent behavior without any visible change to the user.

Data exfiltration via tool outputs — An MCP server returns data to the model as tool results. If the server has access to sensitive systems (databases, internal APIs), it can surface PII, credentials, or proprietary data into the model’s context — where it may leak into logs, responses, or downstream tool calls.

Prompt injection through tool descriptions — MCP tool descriptions are included in the model’s system context. An attacker who controls a tool description can inject instructions that override the user’s intent. This is indirect prompt injection applied to tool metadata.

Over-permissive server configurations — MCP servers often expose more capabilities than needed. A file system server might grant read/write access to the entire disk when the agent only needs one directory. There’s no built-in permission model in MCP itself.

Why Server-Side Security Isn’t Enough

OWASP published a practical guide for secure MCP server development that covers input validation, output sanitization, and least-privilege configurations. It’s solid guidance — for server authors.

But here’s the thing: most teams aren’t writing their own MCP servers. They’re consuming them. Community-built servers for GitHub, Slack, Jira, databases, and file systems are being plugged into agent workflows with minimal review. You’re trusting that every server you connect:

  • Validates its inputs correctly
  • Doesn’t leak sensitive data in tool results
  • Has descriptions that accurately reflect behavior
  • Doesn’t phone home with your data

That’s a lot of trust. And even for internal servers you do control, there’s no centralized visibility into what’s actually flowing through MCP connections at runtime.

This is the same problem that API gateways solved for microservices a decade ago: you need a chokepoint where you can inspect, log, and enforce policy on all traffic — regardless of what’s on either end.

Gateway-Level MCP Security

An AI gateway sitting between your agent and its MCP servers can provide controls that neither the client nor the server can enforce alone:

Inspect tool call arguments — Before a tool call reaches the MCP server, the gateway can scan arguments for PII (names, emails, credit card numbers, API keys) and either redact them or block the call entirely. This prevents your agent from accidentally sending customer data to a third-party tool.

Audit all MCP traffic — Every tool call, every result, every error — logged with full context including the trace ID, the originating prompt, and the model’s reasoning. This creates the audit trail that compliance teams need and that MCP doesn’t provide natively.

Detect and block injection — If the gateway detects prompt injection patterns in tool descriptions or tool results, it can block the response before it reaches the model. This is the critical difference between logging an attack and preventing it.

Rate-limit tool calls — An agent stuck in a loop can burn through API quotas and rack up costs. Gateway-level rate limiting per tool, per server, or per trace prevents runaway agents from causing damage.

Enforce allowlists — Only permit tool calls to approved MCP servers. If a poisoned tool description tries to redirect the agent to an unauthorized endpoint, the gateway blocks it.

Using Evals to Understand MCP Tool Usage

Logging tells you what happened. Evals tell you whether it was the right thing.

When MCP traffic flows through your gateway, you can run LLM-as-a-judge evaluations on tool call patterns to answer questions that logs alone can’t:

Which tools is the model actually calling? — Track tool call distribution across your MCP servers. If a model suddenly starts calling a tool it’s never used before, that’s worth investigating.

Are tool calls relevant to the user’s request? — An eval can score whether each tool call was necessary and appropriate given the original prompt. A low relevance score might indicate the model is being manipulated via indirect injection or is simply confused.

Is the model leaking data across tool calls? — Evaluate whether sensitive information from one tool’s output is being passed into another tool’s input. This catches data exfiltration patterns that per-call inspection might miss.

Quality scoring for tool results — Not all MCP servers are equal. Eval scores on tool result quality help you identify servers that return noisy, incomplete, or misleading data — before your users notice.

Running evals on production MCP traffic turns your gateway from a passive observer into an active quality and security monitor.

Inspect, Audit, and Block — Not Just Log

Most observability tools treat MCP traffic as just another set of log entries. That’s not enough when your agent has write access to production systems.

The security model for MCP needs three layers:

Layer 1: Real-time inspection — Every tool call is scanned in-flight. PII detection runs on arguments and results. Injection patterns are matched against tool descriptions and outputs. This happens synchronously, before the data reaches its destination.

Layer 2: Active blocking — When inspection finds a threat, the gateway doesn’t just flag it — it blocks the call. The model receives an error response, the trace records the blocked call with the reason, and an alert fires. This is the difference between “we detected an injection attempt in our logs” and “we stopped an injection attempt before it executed.”

Layer 3: Continuous evaluation — Evals run asynchronously on completed traces, catching patterns that real-time inspection can’t — like gradually escalating privilege across a chain of tool calls, or a model being slowly steered toward a specific tool by repeated subtle injections.

// Example: MCP tool call flowing through a gateway
// The gateway inspects, logs, and can block at each step

const response = await fetch("https://proxy.grepture.com/v1/chat/completions", {
  method: "POST",
  headers: {
    "Authorization": "Bearer gpt_your_key",
    "Content-Type": "application/json",
  },
  body: JSON.stringify({
    model: "claude-sonnet-4-5-20250514",
    messages: [
      { role: "user", content: "Summarize the Q1 sales report" }
    ],
    tools: [
      {
        type: "function",
        function: {
          name: "read_document",
          description: "Read a document from the company drive",
          parameters: {
            type: "object",
            properties: {
              path: { type: "string" }
            }
          }
        }
      }
    ]
  }),
});

// The gateway:
// 1. Logs the full tool call chain in a trace
// 2. Scans tool arguments for PII/secrets before forwarding
// 3. Checks tool descriptions for injection patterns
// 4. Blocks the call if a threat is detected
// 5. Runs async evals on tool call relevance and data flow

How Grepture Helps

Grepture sits in the request path as an AI gateway — which means MCP tool calls that flow through your LLM API already pass through Grepture. Here’s what you get out of the box:

Full trace visibility — Every tool call appears in the trace waterfall, showing the complete chain of tool invocations with timing, arguments, and results. You can see exactly what your agent did and in what order.

PII detection on tool traffic — Grepture’s detection rules run on tool call arguments and results, catching sensitive data before it leaves your infrastructure or enters your model’s context. Over 50 built-in PII patterns, plus custom rules.

Injection detection and blocking — Prompt injection detection applies to the full request context, including tool descriptions and results. When an injection is detected, Grepture can block the request and log the attempt.

Evals on tool call patterns — Run evaluators on your MCP traffic to score tool call relevance, detect anomalous patterns, and track quality over time. Custom eval prompts let you define domain-specific quality criteria for your agent’s tool usage.

Cost and usage tracking — Track token usage and cost per trace, so you know exactly how much each MCP-powered workflow costs — including the overhead of tool call chains.

Key Takeaways

  • MCP security doesn’t stop at the server. If you consume MCP servers you didn’t write, you need visibility and control at the gateway layer.
  • Inspect and block, don’t just log. Real-time PII scanning and injection detection on tool call traffic prevents attacks instead of documenting them.
  • Evals add the “why” layer. Logging shows what tools were called; evals reveal whether those calls were appropriate, relevant, and safe.
  • Treat MCP like any other API surface. Gateway-level controls (rate limiting, allowlists, audit trails) are the same patterns that secured microservices — applied to AI agent workflows.
  • The August 2026 EU AI Act deadline makes this urgent. Article 14 requires human oversight of high-risk AI systems. An unmonitored agent with MCP tool access is the opposite of oversight.

How to Add AI Gateway Observability to a Production Control Plane

A lot of teams add an AI gateway for a good reason.

They want one place to enforce policy.
They want one place to shape traffic.
They want one place to introduce retries, failover, quotas, and model controls without rewriting every application.

That architecture makes sense.

But once the gateway starts making real decisions, it is no longer just a proxy.

It becomes part of the production control plane.

That is the point where AI gateway observability matters.

Why a gateway becomes hard to debug

In a direct-to-provider setup, the debugging path is smaller.

You usually inspect:

  • the application request
  • the provider call
  • the final response

A gateway inserts a new decision layer in the middle.

Now the same request may go through:

  • a policy check
  • a quota or budget guardrail
  • route selection logic
  • a retry branch
  • a failover path
  • a downstream provider call
  • response shaping before it returns to the app

If latency spikes or the wrong provider is used, the real problem may not be the downstream model at all.

It may be the control-plane logic that shaped the request before the model call happened.

What good gateway observability should answer

A useful gateway trace should help you answer questions like:

  • Why did this request take this route?
  • Did a quota rule change the selected model?
  • Did failover trigger because of provider health or a gateway bug?
  • Did retries increase latency or token cost?
  • Which tenants were affected by the behavior change?
  • Did the issue begin in the gateway or at the provider?

If you cannot answer those questions from one request lineage, your gateway is still too opaque.

A practical trace shape

A small but useful gateway trace can look like this:

gateway request
  -> policy check
  -> route selection
  -> quota / budget rule
  -> failover or retry branch
  -> downstream provider call
  -> response + trace metadata

That structure makes it much easier to separate classes of problems.

If the provider was slow, you can see it.

If the provider was fine but the gateway retried too aggressively, you can see that too.

Example request flow

Suppose a client sends a payload like this:

{
  "tenant_id": "acme-enterprise",
  "model": "auto",
  "messages": [
    { "role": "system", "content": "You are a concise assistant." },
    { "role": "user", "content": "Summarize today’s error budget status." }
  ]
}

The gateway might make decisions like:

  • apply enterprise-specific policies
  • prefer the primary provider under normal conditions
  • fall back if the provider is degraded
  • preserve route metadata for later debugging

A response record with observability fields might look like this:

{
  "route_reason": "primary_provider_ok",
  "selected_provider": "openai",
  "selected_model": "gpt-4o-mini",
  "retry_count": 0,
  "failover_used": false,
  "tenant_id": "acme-enterprise",
  "trace_id": "trc_123abc"
}

That record gives teams something much more useful than a plain request log.

It explains the control-plane behavior.

What to instrument first

If you are just getting started, begin with the fields that explain route changes and incidents:

  • route reason
  • selected provider
  • selected model
  • override source
  • retry count
  • failover state
  • tenant context
  • latency by step
  • cost by step

Those fields make it possible to debug most real gateway issues without rebuilding the whole platform.

What AI gateway observability helps with in practice

Here are common production problems that become easier to understand:

  • a premium customer got routed to a cheaper model unexpectedly
  • traffic shifted to a backup provider but never shifted back
  • a policy rollout increased latency for one customer segment
  • quota pressure caused silent route changes
  • retries doubled cost during partial provider instability

These issues are hard to explain when all you have is provider logging.

They become much easier to reason about when the gateway decisions themselves are visible.

The main idea

Most teams think they need more logs.

What they often need is a clearer operational trace of the gateway as a decision system.

That means treating the gateway request like a workflow with explicit steps rather than a black box in front of model providers.

Once you do that, the control plane becomes much easier to operate.

The takeaway

If your gateway shapes routing, policy, failover, or provider behavior, it is already part of production operations.

That means you need observability for the gateway itself, not just the downstream model call.

Because the important question in production is usually not:

“Did the request finish?”

It is:

“Why did it take this path?”

The Free AI Coding Tool Landscape Just Changed and Here Is What I Switched To

I’ve been bouncing between free AI coding tools for about eight months now. Not because I enjoy the constant context-switching — I don’t — but because the free tiers keep changing. One month Copilot’s generous, the next they throttle completions. So you adapt.

Last week I finally settled on a setup I’m actually happy with, and the catalyst was Gemini Code Assist dropping its paid wall entirely.

My old setup (and why it fell apart)

For most of late March I was running Copilot’s free tier inside VS Code. It worked. The completions were decent for boilerplate — React components, SQL queries, that sort of thing. But I kept hitting the monthly suggestion cap at the worst possible moments. Always mid-sprint, always on a Friday afternoon.

I tried supplementing with Codeium. Fine for autocomplete, weak on multi-file reasoning. If I asked it to refactor a service layer that touched three files, it’d confidently edit two and hallucinate imports from a package that didn’t exist.

Gemini Code Assist going free changed everything

Google quietly made Gemini Code Assist free for individual developers in their March update. No waitlist, no credit card, just install the extension.

I was skeptical. Google’s track record with developer tools is… uneven. But after two weeks of daily use, here’s where I’ve landed:

What actually works well:

  • Multi-file context. It handles monorepo navigation better than anything else I’ve tried at this price point (free). I pointed it at a Next.js app with 40+ route files and it correctly traced a bug through three layers of middleware.
  • The chat interface is fast. Sub-second responses for most questions. Copilot’s chat feels sluggish by comparison.
  • Gemini 2.5 Pro under the hood means the reasoning quality on architecture questions is genuinely solid.

What doesn’t:

  • Inline completions are hit-or-miss. Sometimes brilliant, sometimes it autocompletes a function signature that doesn’t match the types I defined six lines up. Copilot still edges it out for pure autocomplete speed and accuracy.
  • No terminal integration. I can’t ask it to run tests or explain error output without copy-pasting. Minor, but it adds up.
  • Extension conflicts. If you’re running both Copilot and Gemini Code Assist, VS Code occasionally freezes for 2-3 seconds while they fight over who gets to suggest first.

I wrote a detailed breakdown of Gemini Code Assist’s free tier after my first week with it, if you want the full picture.

Where cloud agents fit in (and where they don’t)

The other big shift I’ve been watching is cloud-based coding agents — tools like OpenAI’s Codex and Anthropic’s Claude Code that run in sandboxed environments and execute code autonomously.

I tested both for a side project: migrating a Flask API to FastAPI. The kind of tedious, well-defined task that should be perfect for an autonomous agent.

Codex handled the route conversion cleanly but choked on the async database layer. It kept generating synchronous SQLAlchemy calls wrapped in asyncio.to_thread(), which technically works but defeats the purpose. Claude Code got further — it actually rewrote the DB layer properly — but burned through my free credits in about 40 minutes of back-and-forth.

The fundamental tradeoff: cloud agents are powerful but expensive, and the free tiers are thin. Local tools like Gemini Code Assist give you unlimited usage but less autonomy. For my workflow, I use the cloud agents for one-off complex refactors and keep Gemini running for daily coding.

I found a solid comparison of cloud vs local coding agents that maps out these tradeoffs in more detail than I can here.

My current stack (April setup)

After all the experimentation, this is what I’m running daily:

Primary: Gemini Code Assist (VS Code extension) — unlimited completions, good multi-file reasoning, free chat
Backup autocomplete: Copilot free tier — I keep it installed but disabled by default, toggle it on when Gemini’s suggestions feel off
Heavy lifting: Claude Code via terminal — reserved for large refactors, maybe twice a week

Total monthly cost: $0.

Is it as good as paying $19/month for Copilot Pro or Claude Pro? No. The completions are slower, the context windows are smaller, the autonomy is limited. But for solo projects and learning, it’s more than enough.

What I’d tell someone starting fresh

Skip the paid tiers until you’ve actually hit a wall with the free ones. I spent three months paying for Copilot Pro before realizing I used maybe 30% of its features. The free tools have gotten genuinely capable — not because any single one is perfect, but because you can layer them.

The one thing I’d watch out for: don’t install five AI extensions simultaneously and expect VS Code to behave. Pick two, max. Your RAM will thank you.

I write about developer tools and the weird economics of AI pricing. If you found this useful, I’m @jimliu_dev on Dev.to.

Drizby: An Open Source BI Platform Built on a Semantic Layer (and why I built it)

Drizby: An Open Source BI Platform Built on a Semantic Layer (and why I built it)

For a large part of my career I’ve been building or buying analytics tools. At the DailyMail I built a real-time dashboard that helped grow traffic from 55M to 200M monthly uniques. At TES we built a data lake on Redshift with Looker powering self-service reporting across the entire business. At Infinitas we use Snowflake and PowerBI (which I will be glad to one day never use again).

Through all of that — and a lot of time with Metabase, Superset, Redash, Mixpanel, Amplitude — one question has kept coming back:

“How can I share self-service analytics with my customers in a scalable, secure and maintainable way?”

This is what led me to build drizzle-cube, an open source embeddable semantic layer for TypeScript apps built on top of Drizzle ORM. I wrote about that journey here. Drizzle-cube lets you define analytics cubes on top of your existing Drizzle schemas — measures, dimensions, time dimensions, security contexts — and expose them through a REST API that’s compatible with the Cube.js query format.

But once I had the semantic layer working, I kept wanting more. I wanted dashboards. I wanted AI notebooks. I wanted a visual analysis builder. I wanted something I could point at a database and just use, without needing to embed it into an existing app first.

So I built Drizby.

What is Drizby?

Drizby is an open source BI platform — think Metabase or Superset, but built from the ground up on a semantic layer, with AI and embedding as first-class features. It’s MIT licensed, ships as a single Docker container, and has no per-seat pricing.

docker run -p 3461:3461 -v drizby-data:/app/data ghcr.io/cliftonc/drizby:main

That’s it. You get:

  • Dashboards — drag-and-drop grid layout with 20+ chart types (bar, line, area, pie, scatter, KPI cards, treemaps, tables, and more)
  • Agentic AI Notebooks — multi-turn conversations with your data, where AI generates charts, tables and markdown insights in real time
  • A Visual Analysis Builder — point-and-click query building inspired by Mixpanel and Amplitude, no SQL required
  • A Schema & Cube Editor — Monaco editor with full TypeScript autocomplete for defining your semantic layer in code
  • An MCP Server — expose your semantic layer to Claude, ChatGPT, Cursor, or any MCP-compatible AI assistant
  • GitHub Integration — version control your entire semantic layer, tag releases, restore from any version

Why a Semantic Layer Matters

Most BI tools query your database directly. You write SQL or drag columns around, and the tool generates queries. This works until it doesn’t — and it stops working the moment you need consistent metric definitions, multi-tenant security, or AI agents querying your data.

A semantic layer sits between your raw data and everything that consumes it. You define your metrics once — “revenue is sum of amount where status is completed” — and that definition is enforced everywhere. Dashboards, the analysis builder, AI notebooks, external API consumers, MCP-connected AI assistants: they all go through the same layer with the same definitions and the same security context.

In Drizby this is powered by drizzle-cube. If you already use Drizzle ORM, you’re 80% done — your existing schema is the foundation. You define cubes on top of it:

const salesCube = createCube({
  table: schema.sales,
  dimensions: {
    category: dimension(schema.sales.category),
    orderDate: dimension(schema.sales.orderDate),
  },
  measures: {
    totalRevenue: measure.sum(schema.sales.amount),
    orderCount: measure.count(),
  },
  securityContext: {
    organisationId: schema.sales.organisationId,
  },
});

That securityContext line is important. Every query that runs through the semantic layer is automatically filtered by it. One customer can never see another customer’s data. This isn’t bolted on — it’s baked into every query at the engine level.

Open Source at Its Core

This matters to me. I’ve used a lot of analytics tools over the years, and the pattern is always the same: you start free, you get locked in, and then the pricing conversation starts. Per-seat licensing in particular makes no sense in a world where AI agents and humans are querying the same data layer.

Drizby is MIT licensed. The semantic layer (drizzle-cube) is MIT licensed. You can self-host with unlimited users, unlimited dashboards, unlimited notebooks, unlimited connections. Your infrastructure, your data.

There is a Drizby Cloud option for people who don’t want to manage infrastructure — usage-based pricing, no per-seat fees — but the self-hosted version is the same codebase with nothing held back.

Embedding as a First-Class Feature

This is where Drizby’s lineage from drizzle-cube really shows. Because the entire platform is built on a semantic layer with a standard REST API, embedding analytics into your own app is straightforward.

You can use drizzle-cube directly if you want to embed analytics components into your existing React app — it gives you providers, hooks, and Tailwind-styled components for dashboards, charts, and the analysis builder. But you can also run Drizby as a standalone platform and consume its API, or connect AI assistants to it via MCP.

The MCP server is particularly interesting. You enable it in settings, and suddenly Claude Desktop, VS Code Copilot, or Cursor can discover your cubes, validate queries, and execute them — all with per-user OAuth 2.1 authentication and your security context enforced automatically. Your semantic layer becomes a set of tools that any AI agent can use.

From Database to Dashboards in Minutes

One of the things I’m most proud of is how automated the setup is. In most BI tools, connecting a database is just the start — then you spend hours or days modelling your data before anyone can build a dashboard. In Drizby the whole thing is AI-assisted and takes minutes.

Here’s how it works:

1. Connect your database. Point Drizby at a PostgreSQL, MySQL, SQLite, or any Drizzle-supported database. It tests the connection and you’re in.

2. Introspect the schema. Click “Introspect” and Drizby runs drizzle-kit pull under the hood to extract your full database schema as typed Drizzle ORM definitions. It post-processes the output — stripping exotic index types that generate invalid TypeScript, patching PostgreSQL array column annotations — so you get clean, compilable schema files. You then pick which tables you want to include.

3. AI plans your cubes. Once the schema is in, AI analyses your tables and proposes a set of analytics cubes. It identifies fact tables (orders, transactions, events) vs dimension tables (users, departments, products), skips junction tables and internal framework tables, and produces a plan. You get a checklist of proposed cubes — all pre-selected — and can deselect any you don’t want.

4. AI generates the cubes. This is the fun part. Drizby streams the generation via SSE — you watch in real time as each cube is written, saved, and compiled. The AI maps your column types to the right dimension types (text→string, integer→number, timestamp→time), generates appropriate measures (count, sum, avg, min, max on numeric columns), and sets up the security context. Each cube is saved to the database and compiled immediately.

5. AI proposes joins. After the cubes are generated, AI analyses your foreign key relationships and naming conventions to propose joins between cubes — belongsTo, hasOne, hasMany, even belongsToMany through junction tables. Again, you get a checklist to review.

6. Joins are applied and everything compiles. The AI edits the cube source code to add the join definitions, recompiles everything, and registers the cubes with the semantic layer. Done.

From a fresh database connection to a fully queryable semantic layer with cubes, measures, dimensions and joins — typically under five minutes. You can see the whole flow in the getting started video.

At every step you have full control. The Monaco editor is right there with TypeScript autocomplete, so you can tweak anything the AI generated. But the point is you don’t have to — the automated flow gets you to a working state fast, and you refine from there.

How It Compares

I’ve used most of the tools in this space, so here’s my honest take:

vs Metabase — Metabase is great for getting started quickly, but it doesn’t have a code-first semantic layer, AI notebooks, or an MCP server. Drizby adds these while keeping the simplicity of a single-container deployment.

vs Apache Superset — Superset is powerful but heavy. It requires a more complex deployment, doesn’t have AI notebooks or MCP, and its SQL-based approach to metrics doesn’t give you the same consistency guarantees as a typed semantic layer.

vs Looker — Looker pioneered the semantic layer idea with LookML. Drizby takes the same philosophy but uses TypeScript and Drizzle ORM instead of a proprietary language, is fully open source, and includes AI capabilities that Looker doesn’t have.

vs Hex / Sigma — These are excellent products, but they’re closed source with per-seat pricing. If you want to self-host, own your data pipeline, and not worry about seat costs as your team (and AI agents) grow, Drizby is the alternative.

The AI Angle

I’m building Drizby in what I think of as an “agentic world”. The old model of BI was: humans log in, build dashboards, share them. The new model adds AI agents into the mix — they need to query your data too, and they need consistent definitions and security just like human users do.

The agentic notebooks in Drizby let you have a conversation with your data. Ask a question in plain English, get charts and insights back, ask follow-up questions, and when you find something worth sharing, promote it directly into a dashboard. The AI queries go through the same semantic layer as everything else — same definitions, same security, same source of truth.

And because of MCP, your data doesn’t just live inside Drizby. Any AI assistant that supports MCP can connect to your semantic layer and query it as part of a broader workflow. Your analytics cubes become tools in the AI’s toolkit.

The Tech Stack

For those who care about what’s under the hood:

Layer Technology
Backend Hono (TypeScript)
Frontend React 18, TanStack Query, Recharts, Tailwind
Semantic Layer drizzle-cube
Code Editor Monaco Editor
Dashboard Grid react-grid-layout
Internal DB SQLite
User Databases PostgreSQL, MySQL, SQLite, Snowflake, SingleStore, DuckDB, and more
AI Anthropic Claude, OpenAI, Google Gemini
Auth Sessions, OAuth (Google, GitHub, GitLab, Microsoft, Slack), SAML 2.0, SCIM

The whole thing ships as a single Docker container. No Redis, no Postgres dependency for the app itself, no complex orchestration. Connect it to your databases and go.

Try It

If any of this resonates — if you’ve been looking for an open source BI platform that takes the semantic layer seriously, that treats AI and embedding as core features rather than afterthoughts, and that doesn’t charge you per seat — I’d love for you to give it a try.

docker run -p 3461:3461 -v drizby-data:/app/data ghcr.io/cliftonc/drizby:main

Or check out the code: github.com/cliftonc/drizby

The semantic layer underneath: drizzle-cube.dev

The live demo of drizzle-cube: try.drizzle-cube.dev

I’m actively developing this and looking for real-world users and feedback. If this might solve a problem for you, I’d be really happy to help where I can. Open an issue, start a discussion on GitHub, or just take it for a spin and let me know what you think.