Mert
Bakan Işıkhan: Teknoloji, insanı güçlendiren bir araç olmalıdır
Litvanya'nın başkenti Vilnius'ta görülen şüpheli İHA paniğe neden oldu
Google, Android XR tabanlı yeni akıllı gözlüklerini tanıttı
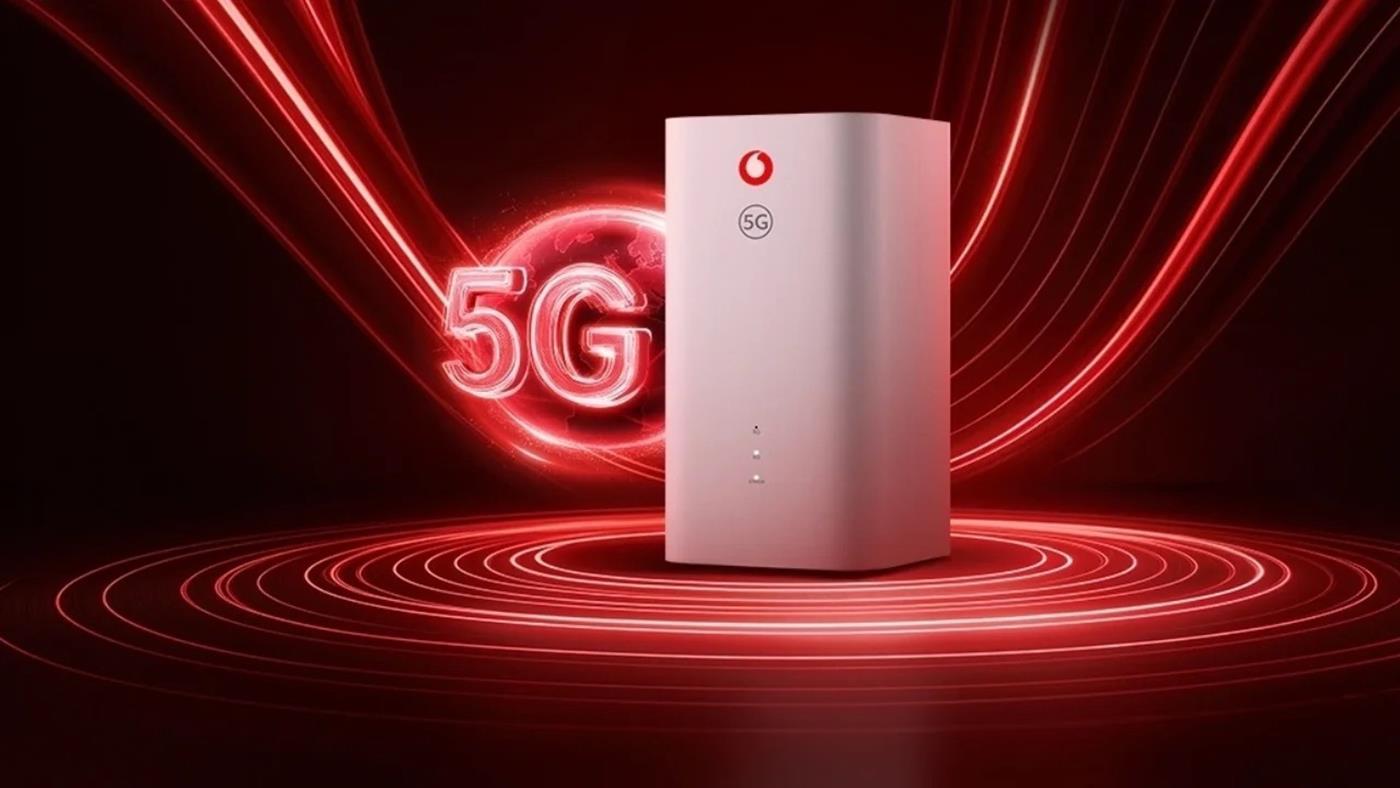
Vodafone 5G RedBox için hız garantisi başladı
Vodafone’un 5G şebekesi üzerinden fiber hızında ev interneti hizmeti suann Vodafone 5G RedBox için minimum 50 Mbps hız garantisi başladı. 50 Mbps’nin altında kalması durumunda iade imkanı sunuluyor.Google’dan bilim dünyasına yeni yapay zeka: Gemini for Science
Google, Gemini for Science adlı yeni yapay zeka platformunu tanıttı. Gemini for Science, hipotez üretimi, deney simülasyonu ve araştırma süreçlerini hızlandırmayı hedefliyor.Membangun Observability GBIM: Metrics Bisnis, Correlation ID, dan k6 Smoke Test
Judul
Membangun Observability GBIM: Metrics Bisnis, Correlation ID, dan k6 Smoke Test
Ringkasan
Iterasi monitoring GBIM akhirnya difokuskan pada tiga hal yang benar-benar bisa dibuktikan dari implementasi saat ini: custom metrics Prometheus, correlation ID end-to-end, dan k6 smoke test yang mengirim telemetry ke Prometheus/Grafana. Frontend juga menambahkan analytics event GA4 sebagai sinyal aktivitas pengguna, tetapi bukti utama untuk CPL 6 tetap berada pada Prometheus, Grafana, k6, dan log request.
Masalah Awal
Sebelum perubahan monitoring ini, stack Prometheus dan Grafana sudah ada, tetapi bukti observability masih kurang kuat:
- Endpoint metrics masih lebih banyak menampilkan telemetry HTTP generik, belum banyak outcome bisnis GBIM.
- Dashboard k6 masih berisiko kosong karena belum ada alur yang konsisten untuk menjalankan k6 dan menulis hasilnya ke Prometheus remote write.
- Request dari frontend ke backend belum mudah ditelusuri saat error karena correlation ID belum konsisten dibawa, divalidasi, dan dikembalikan.
- Aktivitas penting pengguna seperti registrasi, aktivasi akun, verifikasi akun admin, dan update status pengajuan belum punya sinyal monitoring yang eksplisit.
Batasan Klaim
Bagian ini penting supaya klaim monitoring sesuai dengan yang benar-benar dikerjakan.
Yang diklaim selesai:
- Backend mengekspos
/api/metricsdan custom metricgbm_*. - Prometheus/Grafana membaca metric backend dan metric k6.
- k6 smoke test tersedia sebagai script dan Kubernetes Job.
- Frontend mengirim
X-Correlation-ID, backend memvalidasi/menghasilkan ID, lalu mengembalikannya di response. - Backend log memakai
corr_idmelalui logging filter. - Frontend analytics helper GA4 tersedia dan dibatasi untuk host/environment yang diizinkan.
Solusi yang Dibangun
1. Backend Metrics
Backend menambahkan custom metric Prometheus untuk flow yang penting secara operasional. Metric utama berada di monitoring/metrics.py dan dinaikkan dari flow autentikasi, aktivasi, verifikasi akun admin, serta update status pengajuan admin.
Metric yang menjadi fokus:
gbm_auth_register_total{role,outcome}gbm_auth_activation_total{outcome}gbm_auth_reactivation_total{outcome}gbm_auth_email_send_duration_seconds{event,outcome}gbm_admin_account_verification_total{action,outcome}gbm_pengajuan_admin_status_update_total{status,outcome}
Selain itu, beberapa domain lain juga memiliki metric khusus seperti account verification, pengajuan service, kegiatan, dan document upload. Dengan metric ini, Grafana tidak hanya membaca request HTTP, tetapi juga bisa menjawab pertanyaan bisnis seperti:
- Berapa banyak registrasi yang sukses atau gagal validasi?
- Apakah aktivasi akun sering gagal karena token invalid, expired, atau rate limited?
- Apakah admin verification gagal pada list, detail, atau update status?
- Apakah update status pengajuan gagal karena validasi, data tidak ditemukan, atau error service?
2. Correlation ID End-to-End
Frontend menambahkan header X-Correlation-ID dari lib/api.ts pada request API normal dan refresh token. Backend memiliki CorrelationIdMiddleware yang:
- Membaca header
X-Correlation-IDdari request. - Menerima nilai yang valid jika berbentuk UUID.
- Mengganti nilai yang kosong/tidak valid dengan UUID baru.
- Menyimpan ID ke context logging.
- Mengembalikan ID yang sama di response header
X-Correlation-ID.
Log backend memakai CorrelationIdFilter, sehingga format log memiliki field corr_id. Dampaknya, ketika frontend mendapatkan error dari backend, correlation ID di response bisa langsung dipakai untuk mencari log request yang sama di backend.
3. k6 Smoke Test dan Dashboard Grafana
k6 dipakai untuk membuat telemetry performa yang bisa masuk ke dashboard Grafana. Implementasinya terdiri dari:
- Script
k6/monitoring-smoke.js. - Kubernetes Job
k8s/job/k6-monitoring-smoke.yaml. - Output k6
experimental-prometheus-rw. - Remote write ke
http://prometheus:9090/api/v1/write. - Tag
testid=monitoring-smokeagar metric k6 mudah difilter di Grafana. - Prometheus dijalankan dengan argumen
--web.enable-remote-write-receiver.
Smoke test k6 memukul endpoint yang relevan untuk monitoring:
/api/monitoring/health//api/metrics-
/api/auth/activation/?token=...untuk skenario token invalid/rate-limited - optional register Kaprodi jika
ENABLE_REGISTER_FLOW=true
Script k6 juga mengirim X-Correlation-ID dan X-Forwarded-Proto: https, sehingga request synthetic tetap mengikuti pola observability dan konfigurasi reverse proxy/SSL yang dipakai backend.
4. Frontend Analytics sebagai Sinyal Tambahan
Frontend menambahkan helper lib/analytics.ts untuk mengirim event GA4. Helper ini tidak mengirim event jika window.gtag tidak tersedia, dan hanya aktif jika:
-
NEXT_PUBLIC_GA_MEASUREMENT_IDtersedia. -
NEXT_PUBLIC_APP_ENVbernilaistagingatauproduction. - Host runtime masuk allowlist analytics, misalnya
gbim-staging.ppl.cs.ui.ac.id.
Event yang diinstrumentasi:
-
register_submitted,register_success,register_failed -
activation_verified,activation_expired,activation_used,activation_invalid,activation_rate_limited -
reactivation_requested,reactivation_success,reactivation_failed -
admin_verification_list_viewed,admin_verification_detail_clicked,admin_verification_status_updated pengajuan_admin_status_updated
Pada akhir implementasi, pipeline FE juga perlu meneruskan variable analytics ke Docker build karena variable NEXT_PUBLIC_* di Next.js dibaca saat build. Tanpa itu, tag GA tidak muncul di bundle staging walaupun kode analytics sudah ada.
[Placeholder SS-06] GA4 Realtime atau DebugView menampilkan page view/event dari staging setelah variable CI/CD FE terpasang dan frontend dideploy ulang.
Mapping ke CPL 6
Criterion 1: Built-in Platform Monitoring
Monitoring sudah masuk ke lifecycle aplikasi, bukan hanya screenshot manual. Backend mengekspos /api/metrics, Prometheus melakukan scrape, dan Grafana membaca data dari Prometheus. k6 juga dijalankan sebagai Job Kubernetes sehingga telemetry performa bisa masuk ke jalur monitoring yang sama.
Correlation ID memperkuat sisi platform monitoring karena request tidak hanya terlihat secara agregat di metric, tetapi juga bisa ditelusuri sampai log backend. Ini membuat investigasi error lebih operasional: dari error frontend, ambil X-Correlation-ID, lalu cari corr_id yang sama di backend.
Criterion 2: Standard Tool Setup with Live Data
Tool yang digunakan adalah tool standar industri:
- Prometheus untuk metrics.
- Grafana untuk dashboard.
- k6 untuk smoke/load telemetry.
- Django logging dengan correlation ID untuk investigasi request.
- GA4 sebagai sinyal tambahan aktivitas frontend.
Data yang ditampilkan bukan mock statis. Custom metric naik dari flow aplikasi, k6 mengirim metric hasil request synthetic, dan correlation ID muncul dari request yang benar-benar melewati frontend/backend.
Criterion 3: Kustomisasi Sesuai Pekerjaan
Kustomisasi monitoring dibuat berdasarkan flow GBIM yang memang penting:
- Registrasi akun.
- Aktivasi akun.
- Reaktivasi token.
- Verifikasi akun admin.
- Update status pengajuan admin.
- Durasi pengiriman email aktivasi/reaktivasi.
Label seperti role, outcome, action, dan status membuat dashboard bisa membedakan kasus sukses, validasi gagal, duplicate email, token invalid, token expired, not found, server error, dan service error. Ini lebih bermakna daripada hanya melihat CPU, memory, atau HTTP 200/500.
Criterion 4: Advanced Usage
Advanced usage pada implementasi final terletak pada gabungan telemetry performa dan traceability:
- k6 menghasilkan data performa yang masuk ke Prometheus remote write dan bisa divisualisasikan di Grafana.
- Correlation ID menghubungkan request frontend, response backend, dan log backend.
- Custom metrics menjelaskan outcome bisnis, bukan hanya status HTTP.
- Analytics frontend memberi sinyal tambahan untuk aktivitas pengguna di staging/production.
Kesimpulan
Hasil akhir monitoring GBIM bukan sekadar “Grafana sudah ada”, tetapi observability yang bisa menjawab pertanyaan operasional:
- Apakah registrasi sering gagal?
- Apakah aktivasi akun bermasalah?
- Apakah verifikasi admin menghasilkan error?
- Apakah update status pengajuan stabil?
- Apakah backend tetap responsif saat diuji k6?
- Request error tertentu bisa dicari di log backend lewat correlation ID apa?
Scope yang benar-benar selesai adalah metrics bisnis, k6 telemetry, correlation ID end-to-end, dan analytics frontend sebagai tambahan.
I Built an AI Land Fraud Detector for Kenya — Here’s the Full Engineering Story
“In God We Trust. In Land We Verify.”
The Problem Is Personal
In Kenya, land is not just an asset. It is identity. Families save for decades to buy a small shamba. It is the thing you show your children. The thing that says you made it.
And it is being stolen — systematically, at scale, with forged documents and complicit officials — from ordinary people who have no way to fight back.
The most brutal variant is called “air supply”: a fraudster markets a plot of land that does not legally exist. They have a polished brochure, a site visit to a real-looking location, and a convincing sale agreement. The buyer pays. The title deed never comes. By the time they discover the fraud — sometimes years later — the money is gone and the legal system offers little recourse.
The Lesedi Developers scandal is the most notorious recent example: thousands of prospective homeowners lost over Sh1 billion to phantom estates in Nairobi’s satellite towns. Juja. Ruiru. Thika. Real places. Fake plots.
This is the problem I set out to solve here using this Code
The Hackathon That Pushed Me to Build It
I submitted TitleTrust to the 2026 Google Gemini 3 Hackathon. The timing was right: Gemini 3 Pro’s native multimodality, two-million-token context window, and “Thinking Mode” made it the first model powerful enough to reason about the chain of title in the way a forensic auditor would — not just retrieve facts, but detect what is missing, what is temporally impossible, and what is legally void.
This is not a chatbot wrapper. This is an autonomous investigation agent.
What TitleTrust Actually Does
Let me describe the product as a user experiences it, then I’ll explain the engineering underneath each step.
1. The Investigator Opens a Session
A field investigator — a community advocate, a local official, a buyer’s agent — opens TitleTrust on their phone and starts a new investigation. They upload the “deal pack”: a Title Deed, a Green Card (the official registry history), a Mutation Form (subdivision records), and a Sale Agreement.
The session starts. A live timeline appears on screen. The agents go to work.
2. The Forensic Agent Reads the Documents
The ForensicEngine (backend/forensic_engine.py) takes the uploaded images and PDFs and runs them through Gemini 3 Pro with structured prompts that force chain-of-thought reasoning.
It does not just OCR the documents. It reasons about them.
It extracts every date, every transaction, every party name — and then checks:
- Can you transfer land before you legally own it? (No.)
- Can a Discharge of Charge predate the Charge itself? (No — but forged Green Cards try.)
- Is the Surveyor on the Mutation Form licensed? (Cross-referenced against gazette records.)
- Does the sum of the subdivided plots exceed the Mother Title’s area? (If yes: oversubscription fraud.)
Why Gemini Thinking Mode matters here: standard LLMs hallucinate compromises when laws conflict. A County Zoning map might say “Residential” while the National Land Act says “Riparian Reserve.” Gemini 3’s include_thoughts=True forces the model to reason through the hierarchy — National Law overrides County Law — and produce a defensible verdict with a visible reasoning trace. That trace is not a nice-to-have. In this context, the reasoning trace is the product. An investigator, a lawyer, or a judge needs to see why the AI flagged something, not just that it did.
3. The Location Agent Checks Physical Reality
The GeospatialEngine (backend/geospatial_engine.py) answers a different question: does the land exist where they say it does?
The most insidious fraud variant is the bait-and-switch: the buyer is taken to a beautiful, flat, accessible plot. The title deed they receive is for a swamp 5km away.
The investigator stands on the land, captures GPS and photos. The GeospatialEngine:
- Validates GPS traces against the parcel geometry from the deed
- Runs plausibility checks: distance-to-boundary, location confidence heuristics
- Detects riparian vegetation patterns that suggest the plot is in a protected river reserve
- Emits a
geospatial_verificationevent: either “Location verified” or “Location mismatch — please re-scan beacons”
If the Solar API data shows the claimed plot is in a flood zone. If the 30-metre riparian buffer overlay shows 60% of the plot is legally unbuildable. The investigator knows before they pay.
4. The Orchestrator Keeps the Investigation Moving
The MarathonLoop (backend/agent/marathon_loop.py) is the job state machine that coordinates everything. It:
- Starts when a session is created
- Advances through investigation stages
- Decides what to check next (without the investigator having to think about it)
- Retries failed API calls with exponential backoff
- Escalates to the user when human input is genuinely needed: “Please provide a clearer photo of the beacon in the northeast corner”
It is designed to behave like an assistant-led investigation. The field investigator should not need to understand conveyancing law. They follow prompts. The system reasons.
5. The Mobile Client Shows Everything, Live
The Flutter client maintains a live, deduplicated, sequence-aware timeline of all agent activity. Every finding. Every evidence registration. Every verification step.
This is not just UX polish. For an investigation tool, the live timeline is the audit trail that an investigator presents to authorities. It needs to be complete, ordered, and reproducible — even if the phone lost signal for ten minutes in the middle of a rural field check.
The Engineering Architecture — Every Decision Tied to the Product
Here is where most case studies go wrong: they describe the architecture and then separately describe the product. In TitleTrust, every engineering decision was made because of a product constraint. Let me walk through them.
Why SSE Instead of WebSockets
The field investigator is standing in Juja, on cheap mobile data, with an intermittent signal. WebSockets require a persistent bidirectional connection. When it drops, you rebuild state from scratch.
SSE (Server-Sent Events) with Last-Event-ID gives you something better: the browser (and Flutter client) automatically reconnects and sends the last event ID it received. The server replays from exactly that point. The investigator’s timeline heals itself without them noticing.
For a progress-update use case — which is all we need for server→client communication — SSE is simpler, more resilient on mobile networks, and natively supports replay semantics.
Why Redis Streams (Not Just a Message Queue)
A standard message queue delivers messages and forgets them. That is fine for background jobs. It is not fine for an investigation audit trail.
Redis Streams is an append-only, ordered log. Every event is stored with a stable offset. When the mobile client reconnects after a signal drop, the server can replay the exact sequence of agent actions from the last confirmed point.
More importantly: after an investigation closes, a lawyer needs to reconstruct exactly what the agent found, in what order, with what evidence. Redis Streams is that record. It is not just infrastructure — it is the chain of custody.
Why Two Cursors (event_id + stream_offset)
Every event carries two identifiers:
-
event_id: a stable application-level UUID the client tracks across reconnections -
stream_offset: the Redis Streams position for efficient server-side seeks
The client knows event_id. The server knows stream_offset. The resume logic maps between them.
Why both? Because event_id survives Redis restarts and re-ingestions — it is stable application identity. stream_offset gives the server an efficient seek into the durable log. Without both, you either replay too much (wasteful) or risk replaying from the wrong point (incorrect).
For an investigation where every event is a piece of evidence, incorrect replay is a correctness bug, not just a performance bug.
Why In-Process Broadcaster + Redis Streams (The Hybrid)
The Broadcaster (backend/realtime/broadcaster.py) maintains both an in-memory local fanout queue and a durable Redis Streams append.
The in-memory queue delivers events to the SSE client in milliseconds — even when Redis has a hiccup. The Redis Streams append persists the event for replay and audit.
In degraded mode (Redis unavailable), the system flips a flag, continues local delivery, and the client can recover authoritative state from Firestore when connectivity returns. The investigator’s timeline keeps updating. They never see a spinner.
The product constraint driving this: an investigator doing a site visit in a low-connectivity area should not have their session stall because a Redis instance is momentarily unreachable. Availability for the user is non-negotiable. But so is the audit trail. The hybrid gives you both.
Why Evidence Gets SHA256 Checksums and Trace IDs
Every piece of evidence the ForensicEngine registers — every photo, every document analysis result — gets:
- A SHA256 checksum of the content
- A
trace_idlinking it across services - A
sequence_idfor ordering within the session
This is not engineering over-engineering. This is chain of custody. If an investigator presents TitleTrust findings to a Land Control Board or a court, the evidence must be verifiable as unmodified and correctly attributed. The checksum proves content integrity. The trace ID proves provenance. The sequence ID proves ordering.
Why Deterministic Chaos Tests
Before any public deployment of a system that people will rely on to protect their life savings, I needed to be able to prove the system behaves correctly under failure — not just hope it does.
The test harness (tests/test_realtime_chaos.py, tests/support/fake_redis.py) includes:
- A fake Redis that can be programmatically failed, truncated, or made to reject writes
- A failure injector that simulates xadd failures, publish delays, and partial persistence
- Tests that validate: sequence monotonicity, correct replay after Redis restart, fallback to local buffer, client convergence to authoritative state after gap detection
Real bugs surfaced in this harness that would never have appeared in happy-path testing:
- Prometheus collector collisions when test instances reused metric names
- Replay mismatches when clients passed a non-Redis ID as the resume token
- Accidental use of non-durable items as the authoritative replay source
The product argument for this: stochastic integration tests find bugs sometimes. Deterministic failure injection finds bugs reproducibly. For a correctness-critical system, reproducible is the only acceptable standard.
Architecture Diagram
┌─────────────────────────────────────────────────────────┐
│ Flutter Mobile Client │
│ RealtimeController: dedupe, sequence, gap detection │
│ RecoveryCoordinator: authoritative Firestore recovery │
└────────────────────┬────────────────────────────────────┘
│ SSE (Last-Event-ID)
▼
┌─────────────────────────────────────────────────────────┐
│ FastAPI Backend │
│ /realtime/sse · /realtime/last-state/{session_id} │
└────────────────────┬────────────────────────────────────┘
│
▼
┌─────────────────────────────────────────────────────────┐
│ Broadcaster │
│ In-process bounded queues (low-latency local fanout) │
│ Redis Pub/Sub (cross-instance fanout) │
│ Redis Streams (durable ordered log + replay) │
└──────┬──────────────────────┬───────────────────────────┘
│ │
▼ ▼
┌─────────────┐ ┌──────────────────────────────────┐
│ Redis │ │ Agent Workers │
│ Streams │ │ MarathonLoop (orchestrator) │
│ (durable │ │ ForensicEngine (vision/docs) │
│ log) │ │ GeospatialEngine (GPS/maps) │
└─────────────┘ └──────────────┬───────────────────┘
│
▼
┌──────────────────┐
│ Firestore │
│ (canonical │
│ session state) │
└──────────────────┘
A Day in the Life: One Investigation
To make this concrete, here is the complete flow for a single field check:
- Investigator uploads a deal pack (Title Deed, Green Card, Mutation Form) via the Flutter app.
-
Session created in Firestore. MarathonLoop starts. A
session_startedevent is emitted, broadcast locally, appended to Redis Streams. -
ForensicEngine runs: Gemini 3 Pro reads the Green Card. It finds
Entry #4: Charge to Equity Bank, 12/01/2018andEntry #6: Discharge of Charge, 10/01/2018. The Discharge predates the Charge. Temporal anomaly flagged. Evidence registered with SHA256 checksum and trace ID.evidence_registeredevent emitted. - The timeline on the investigator’s phone updates instantly via SSE. They see: “⚠️ Temporal anomaly detected — Discharge of Charge predates Charge. Likely forgery.”
-
Investigator walks the plot boundary and captures GPS + photos. GeospatialEngine validates location. Finds: plot coordinates overlap 60% with the Athi River 30m riparian buffer. Critical risk flagged.
geospatial_verificationevent emitted. -
Phone signal drops for 4 minutes. Client reconnects with
Last-Event-ID. Server maps it to Redis stream offset. Replays the 3 events the client missed. Timeline is complete. -
Investigation complete. MarathonLoop emits
investigation_completewith a risk score of 91 (CRITICAL). The full event log — ordered, checksummed, traceable — is the audit trail the investigator presents to the Land Control Board.
What I Used Gemini 3 For Specifically
This is important because I did not use Gemini 3 as a chatbot. I used it as a reasoning engine embedded in a structured investigation workflow.
Thinking Mode (include_thoughts=True) — for legal conflict resolution. When a County Zoning map conflicts with the National Land Act, I cannot use a black-box verdict. The reasoning trace showing why one law overrides another is what makes the output usable in a legal context.
Native multimodality — for reading handwritten Green Cards. Kenya’s registry history is often handwritten, sometimes in cursive, on physical cards. Gemini 3 Pro reads these without a separate OCR step, preserving spatial context (stamps over signatures, marginal notes) that traditional OCR loses.
2M token context window — for tracing chain of title through decades of subdivisions. A Mother Title in Kiambu might have 50+ years of subdivision history. Fitting the complete legal history in a single context window enables the kind of deep chronological reasoning that was previously only possible for senior conveyancing lawyers charging Ksh 10,000+ per review.
Structured outputs — for emitting machine-readable findings. Every ForensicEngine result is a typed JSON finding, not free text. This is what allows the mobile timeline to render findings as UI components rather than just paragraphs.
The Numbers
| What | Why it matters |
|---|---|
| ~Ksh 500 per basic forensic check | vs Ksh 5,000–10,000 for a lawyer |
| ~3 minutes for a full audit | vs 30 days for traditional due diligence |
| SHA256 checksums on all evidence | Chain of custody for legal proceedings |
| Deterministic chaos tests | Correctness provable, not assumed |
| Degraded mode (Redis down) | Investigators never lose session continuity |
Key Engineering Takeaways
1. Tie every infrastructure decision to a user outcome.
Redis Streams exists because investigators need an audit trail, not because append-only logs are cool. SSE exists because mobile reconnection in rural Kenya needs to be seamless. When you can answer “why does this exist?” with a user story, your architecture stays honest.
2. The reasoning trace is the product.
For AI systems used in high-stakes decisions — land fraud, medical diagnosis, legal analysis — the output is not the verdict. The output is the evidence behind the verdict. Design your AI integration accordingly.
3. Deterministic failure injection is the only way to prove correctness.
Stochastic tests find bugs sometimes. Deterministic failure injection finds them reproducibly. For a system that people will rely on to protect their life savings, “probably works” is not good enough.
4. Hybrid realtime (local fanout + durable stream) is the right model for mobile-first AI systems.
Local in-memory fanout keeps UX responsive under partial failures. Redis Streams provides the durable, replayable log for recovery and audit. You do not have to choose between fast and correct.
What’s Next
- Shadow Registry: a crowdsourced, hashed double-allocation detector. When two independent investigators verify the same plot, the system flags a potential double sale — without exposing either party’s identity until a match is confirmed.
- Case Law RAG: grounding forensic reasoning in Kenya Law Reports (eKLR) for land dispute precedents.
- Blockchain title anchoring: publishing investigation hashes to an immutable ledger so findings cannot be retroactively modified.
- Hardware-backed device attestation: for high-assurance deployments where the physical device must be cryptographically verified.
The Repo
The codebase is organized around clear responsibility boundaries:
| File | Purpose |
|---|---|
backend/realtime/broadcaster.py |
In-process fanout, Redis Pub/Sub, degraded mode |
backend/realtime/store.py |
Redis Streams event store, two-cursor resume logic |
backend/agent/marathon_loop.py |
Orchestration, job lifecycle, event emission |
backend/forensic_engine.py |
Vision analysis, evidence registration, checksumming |
backend/geospatial_engine.py |
GPS/parcel validation, spatial event emission |
frontend/titletrust/lib/realtime/realtime_controller.dart |
Dedupe, sequence tracking, authoritative recovery |
tests/test_realtime_chaos.py |
Deterministic chaos suite |
tests/support/fake_redis.py |
Programmatic Redis failure injection |
Final Thought
Land fraud in Kenya is not a technology problem. It is a power problem: the people who commit it have access to systems, officials, and legal processes that ordinary buyers do not. TitleTrust does not fix that power imbalance by itself.
But it gives ordinary people — investigators, buyers, community advocates — the same forensic tools that a senior lawyer and a licensed surveyor would use. For Ksh 500 and three minutes instead of Ksh 10,000 and thirty days.
That is the point. The engineering exists to serve that point.
If you are building AI systems for high-stakes decisions in emerging markets, I would love to talk. The problems are real, the constraints are severe, and the standard tooling assumptions often do not hold.
Built with Gemini 3 Pro, FastAPI, Flutter, Redis Streams, and Firebase. Submitted to the Google Gemini 3 Hackathon, 2026.

Understanding MCP (Model Context Protocol): The Future of AI Integrations
Artificial Intelligence is rapidly moving beyond simple chatbots. Today, AI systems are becoming assistants that can search databases, read files, interact with APIs, automate workflows, and even operate business systems.
One of the technologies making this possible is MCP, short for Model Context Protocol.
If you are hearing about MCP for the first time, this article will help you understand what it is, why it matters, how it works, and why developers are paying close attention to it.
What is MCP?
MCP (Model Context Protocol) is a standardized way for AI models to connect with tools, applications, databases, APIs, and external systems.
In simple terms:
MCP acts like a bridge between AI and software systems.
Without MCP, AI assistants mostly rely on text conversations. They can answer questions, but they cannot naturally interact with real-world systems unless developers build custom integrations for every single tool.
MCP changes this by introducing a common communication standard.
Why MCP Matters
Modern AI systems are becoming more capable every day, but intelligence alone is not enough.
For AI to become truly useful in businesses and applications, it needs access to:
- Databases
- APIs
- File systems
- Cloud platforms
- CRMs
- Developer tools
- Internal company systems
The challenge is that every system works differently.
One application may use REST APIs.
Another may use GraphQL.
Another may require SQL queries.
Another may use completely custom workflows.
Without standardization, developers must create separate integrations for every tool.
MCP solves this problem.
A Simple Analogy
Think of MCP as a universal adapter for AI.
Different software systems are like different power sockets around the world.
Without an adapter:
- nothing connects properly.
MCP provides a standardized way for AI systems to communicate with all these tools using one common structure.
Another good analogy is:
- APIs are individual roads
- MCP is the traffic system organizing everything
How MCP Works
At a high level, MCP involves four main components:
- The User
- The AI Assistant
- The MCP Client/Server
- External Tools or Systems
The flow looks like this:
User
↓
AI Assistant
↓
MCP Client
↓
MCP Server
↓
Tools / APIs / Databases
Step-by-Step Example
Imagine a user asks:
“Show me all failed payments from today and summarize the issue.”
Here is what happens behind the scenes.
Step 1: AI Understands the Request
The AI realizes it needs payment transaction data.
Step 2: MCP Discovers Available Tools
The MCP server may expose tools such as:
[
"search_transactions",
"get_failed_payments",
"generate_report"
]
The AI can automatically discover what tools are available.
Step 3: AI Calls a Tool
The AI sends a structured request such as:
{
"tool": "get_failed_payments",
"date": "2026-05-20"
}
Step 4: MCP Server Executes the Request
The MCP server:
- connects to databases
- fetches data
- processes results
- returns structured information
Step 5: AI Responds Naturally
The AI finally responds:
“There were 37 failed transactions today. Most failures were caused by insufficient balance.”
The user gets a natural conversation experience while MCP handles the technical communication in the background.
MCP vs APIs
Many beginners confuse MCP with APIs, but they are different.
APIs
APIs are direct communication channels between software systems.
Example:
Application A → API → Application B
Each API has:
- different endpoints
- different authentication
- different request formats
- different documentation
Developers must learn every API separately.
MCP
MCP standardizes how AI interacts with these systems.
Instead of teaching AI how every system works individually, MCP provides one common structure.
You can think of it this way:
| APIs | MCP |
|---|---|
| Software-to-software communication | AI-to-software communication |
| Every integration is custom | Standardized integration approach |
| Focused on applications | Focused on AI agents and assistants |
| Different structures everywhere | Common protocol structure |
Why Developers Are Excited About MCP
MCP opens the door to a new generation of AI-powered systems.
Instead of building simple chatbots, developers can build:
- AI agents
- AI copilots
- Intelligent automation systems
- Operational assistants
- AI support systems
- AI developer tools
- Enterprise AI platforms
This is one reason why AI engineering is evolving so quickly.
Real-World Use Cases of MCP
1. Customer Support AI
An AI assistant can:
- check customer accounts
- search transactions
- issue refunds
- generate reports
all through MCP-connected systems.
2. Developer Assistants
AI coding assistants can:
- read repositories
- create pull requests
- analyze logs
- interact with CI/CD pipelines
through MCP integrations.
3. Business Automation
Companies can build AI systems that:
- automate workflows
- generate analytics
- manage operations
- monitor systems
- coordinate teams
using MCP servers connected to internal tools.
4. Banking and Fintech
A banking MCP server could expose:
- account lookup
- transaction history
- payment reversal
- fraud detection tools
- reporting systems
allowing AI systems to assist operations securely.
MCP and AI Agents
MCP is becoming extremely important in the world of AI agents.
AI agents are systems that can:
- reason
- make decisions
- use tools
- perform tasks
- execute workflows
For agents to work effectively, they need reliable access to tools and data.
MCP provides that infrastructure.
This is why MCP is frequently mentioned alongside topics like:
- RAG (Retrieval-Augmented Generation)
- AI workflows
- orchestration
- agent memory
- multi-agent systems
MCP for Backend Developers
If you are a backend developer working with frameworks like Django, Node.js, Laravel, or Spring Boot, MCP creates exciting opportunities.
For example, your backend can expose MCP-compatible tools such as:
- transaction search
- analytics generation
- user management
- reporting systems
- workflow automation
This allows AI systems to interact with your platform intelligently.
Traditional architecture:
Frontend → Backend API → Database
AI-enabled architecture with MCP:
AI Assistant → MCP Server → Backend → Database
This is one reason many developers believe MCP will become a major part of modern software architecture.
The Future of MCP
As AI systems continue to evolve, standardization becomes increasingly important.
MCP could become a foundational layer for:
- enterprise AI systems
- AI operating systems
- AI workplace assistants
- autonomous software agents
- intelligent business platforms
Just as APIs transformed web development, MCP may transform AI integration.
Final Thoughts
MCP is not replacing APIs.
Instead, it builds on top of existing systems and makes them easier for AI to understand and use.
The key idea is simple:
APIs help software communicate with software.
MCP helps AI communicate with software intelligently and consistently.
As AI continues moving from conversation to action, MCP is becoming one of the most important concepts for developers, businesses, and AI engineers to understand.
AI in QA and Native Mobile Performance: An Architectural Review
As a developer constantly evaluating software scalability, I frequently research how engineering teams bridge the gap between bleeding edge automation and optimized user experiences. Recently, I came across two technical deep dives published by the team at GeekyAnts. One article covers the evolution of AI-driven end to end testing, while the other outlines a framework for custom mobile image processing. Both pieces present compelling strategies for engineering leaders, but they also surface important architectural trade offs that require a critical look before production deployment.
Next Generation Automation with Testing Agents
The first development trend worth analyzing is the shift from rigid script writing to autonomous QA infrastructure. Traditional automated workflows are notoriously fragile, requiring extensive manual maintenance when element selectors or user flows change.
The research highlights Playwright version 1.56 and its native integration of specialized AI agents to address this maintenance bottleneck. This framework introduces a three part agentic loop that handles distinct phases of the testing lifecycle:
The Planner Agent: This component utilizes natural language prompts and reads the live application DOM to map out structured test scenarios.
The Generator Agent: It translates those planned scenarios into functional, structured Playwright automation code.
The Healer Agent: This module monitors test execution, catches runtime failures due to broken locators, and attempts to repair the scripts autonomously.
From an architectural standpoint, the use of a baseline seed test to provide the model with an active authenticated state is an excellent practice. It ensures the AI interacts with a deterministic environment rather than guessing code structures.
However, engineering leaders must approach autonomous self healing with caution. Allowing an AI agent to silenty rewrite assertion logic or modify selectors directly within a main repository can inadvertently mask genuine regression bugs. For an enterprise, the safest implementation is to treat healed scripts as isolated pull requests requiring human peer review. Additionally, running dense LLM inference loops across massive test suites inside a continuous integration pipeline will inevitably increase telemetry costs and prolong build times.
Bypassing Package Dependency Bloat in Mobile Frameworks
The second engineering study tackles a classic mobile performance hurdle: manipulating high resolution images within React Native without exhausting device memory. Many product teams rely heavily on external, unmaintained third party libraries for core UI tasks, which introduces security risks and dependency bloat.
The proposed alternative involves building a gesture driven crop component entirely from scratch utilizing the expo image manipulator package. This approach ensures that intensive bitmap transformations execute directly on the native thread rather than overloading the JavaScript runtime.
The core technical challenge here is coordinate mapping. When a mobile application renders an image using content fit properties, portions of the asset are often visually scaled or hidden outside the boundaries of the viewport. Calculating a precise crop requires translating screen space coordinates back into original image pixel space. The documentation provides a highly accurate five step mathematical scaling formula to handle this offset seamlessly.
The only production limitation to note is the reliance on the standard legacy PanResponder API for gesture tracking. While functional, modern premium mobile applications typically favor a combination of react native gesture handler and react native reanimated. This stack offloads gesture calculations entirely to the UI thread, preventing frame drops during rapid scaling operations.
Strategic Business Implications
For founders and technology executives looking to scale their platforms, these insights demonstrate the exact type of deep technical oversight required to build sustainable software. Successfully implementing AI agents without inflating operational costs, or optimizing mobile viewports without sacrificing device battery life, requires a sophisticated engineering team. Organizations looking to accelerate their development velocity while maintaining strict performance boundaries would benefit greatly from partnering with specialized software agencies that thoroughly understand these low level system architectural trade offs.
What are your thoughts on automated self healing pipelines? Do you trust AI agents to fix your breaking continuous integration builds, or do you prefer keeping test maintenance strictly manual? Let us know in the comments below.
Note: This architectural analysis is based on engineering articles originally published by GeekyAnts regarding Playwright Agents and React Native performance pipelines.