Data Virtualization and the Semantic Layer: Query Without Copying

Data virtualization — connecting sources to a unified semantic layer without copying

Data virtualization — connecting sources to a unified semantic layer without copying

Every data pipeline you build to move data from one system to another costs you three things: time to build it, money to run it, and freshness you lose while waiting for the next sync. Most analytics architectures accept this cost as unavoidable. It isn’t.

Data virtualization eliminates the movement. A semantic layer adds meaning and governance on top. Together, they give you a complete analytics layer over distributed data without copying a single table.

The Data Movement Tax

Traditional analytics architecture looks like this: data lives in operational databases, SaaS tools, and cloud storage. To analyze it, you extract it, transform it, and load it into a central warehouse. Every source gets an ETL pipeline. Every pipeline needs monitoring, error handling, and scheduling.

The result: your analytics are always behind your operational data. The warehouse reflects what happened as of the last sync, not what’s happening now. You pay for storage in both the source and the warehouse. And when you add a new source, you add a new pipeline.

This model made sense when compute was expensive and storage was local. In a cloud-native world where compute is elastic and storage is cheap, the calculus changes.

What Data Virtualization Does

ETL pipelines vs. data virtualization — physical movement vs. lightweight connections

Data virtualization lets you query data where it lives. Instead of copying data to a central location, you connect to each source and issue queries directly. A virtualization engine translates your SQL into the source’s native protocol (JDBC for databases, S3 API for object storage, REST for SaaS), retrieves the data, and combines results from multiple sources into a single result set.

From the user’s perspective, all data appears in one unified namespace. A PostgreSQL production database, an S3 data lake full of Parquet files, and a Snowflake analytics warehouse all look like tables in the same catalog.

The keyword is “no replication.” The data stays where it is. The queries go to the data, not the other way around.

What a Semantic Layer Adds on Top

Virtualization solves the access problem. But access without context is dangerous. Raw access to 50 federated sources means 50 sources where analysts can write conflicting metric formulas, join tables incorrectly, and query sensitive columns without authorization.

A semantic layer added on top of virtualization provides:

  • Metric definitions: “Revenue” is calculated the same way regardless of which source the data comes from
  • Documentation: Wikis describe what each federated table and column represent in business terms
  • Join paths: Pre-defined relationships prevent analysts from guessing how tables connect
  • Access policies: Row-level security and column masking enforced at the view level, even for sources that have no fine-grained access controls of their own

The combination is powerful: you get real-time access to all your data (virtualization) with consistent meaning and governance (semantic layer), and without data movement (no ETL).

Why They’re Stronger Together

Each technology is useful alone. Together, they cover gaps neither can fill individually:

Why They're Stronger Together

Virtualization without a semantic layer gives you raw SQL access to everything. Powerful for engineers. Risky for an organization. No metric consistency, no governance, no documentation.

A semantic layer without virtualization covers only the data that’s been moved to the platform’s native storage. Every source that hasn’t been ETL’d is invisible to the layer. You get great governance over a subset of your data, and no governance over the rest.

How It Works in Practice

Dremio is built on this architecture natively. It combines a high-performance virtualization engine (supporting 30+ source types including S3, ADLS, PostgreSQL, MySQL, MongoDB, Snowflake, and Redshift) with a full semantic layer (virtual datasets, Wikis, Labels, Fine-Grained Access Control).

A practical query flow:

  1. An analyst queries business.revenue_by_region — a virtual dataset (view)
  2. Dremio’s optimizer determines that this view joins data from PostgreSQL (customer records) and S3/Iceberg (order transactions)
  3. Predicate pushdowns push filter logic to each source (e.g., date range filters applied at the source)
  4. Results are combined using Apache Arrow’s columnar format (zero serialization overhead)
  5. Row-level security filters the results based on the analyst’s role
  6. If a Reflection (pre-computed copy) exists, Dremio substitutes it transparently for faster performance

The analyst sees one table. Behind it, two sources, one semantic layer, and automatic performance optimization.

When to Virtualize vs. When to Materialize

Virtualize vs. materialize decision framework

Not every query should hit the source directly. The right architecture uses both strategies:

Virtualize when:

  • The data changes frequently and freshness matters
  • The dataset is queried infrequently (monthly reports, ad-hoc exploration)
  • Compliance requires data to stay in its source system
  • You’re evaluating a new source before committing to a pipeline

Materialize when:

  • Multiple dashboards query the same dataset hundreds of times daily
  • Joins across sources are slow because of network latency
  • Table-level optimizations (compaction, partitioning, clustering) would improve performance
  • AI workloads need scan-heavy access to large datasets

The practical strategy: start every source as a federated (virtual) connection. Monitor query frequency and performance. When a dataset crosses the line into “queried daily by multiple teams,” materialize it as an Apache Iceberg table. Dremio’s Reflections automate this for the most common query patterns, creating materialized copies that the optimizer uses transparently.

What to Do Next

Count your current ETL pipelines. For each one, ask: does the destination system need a physical copy of this data, or does it just need to query it? Every pipeline that exists purely for query access is a candidate for virtualization. Replace the pipeline with a federated connection, add a semantic layer for context, and watch your infrastructure costs drop.

Try Dremio Cloud free for 30 days

Launching opub: donated compute for open-source maintainers

the above quote, graphed

First 20 open source maintainers with over 100 GitHub stars get to register at opub.dev receive $50 model credits!

Companies large and small are throwing as much cash as they can find at model tokens. The impacts are complex, massive, and everywhere.

In this new era, GitHub activity tells quite the story:

“[GitHub] platform activity is surging. There were 1 billion commits in 2025. Now, it’s 275 million per week … GitHub Actions has grown from 500M minutes/week in 2023 to 1B minutes/week in 2025, and now 2.1B minutes so far this week.”

— Kyle Daigle, COO, GitHub, April 4, 2026

the above quote, graphed

This flood brings a lot of good with it. It also brings swells upon swells of new maintenance pressure. New repository issues are long, numerous, and verbose. New contributors are zealous and plentiful, with large PRs full of massive new line counts.

Even with the resources and talent of a strong team, it is hard to keep up. It does not feel sustainable. And what about the projects run by volunteers? The open source maintainers and projects without whom software as we know it, and our beloved internet, would not work?

Open source and the agentic flood

Software depends on open source. The humble maintainer, historically underappreciated and underpaid, now has to struggle to stay afloat in this new world whether they use agentic coding tools or not.

As great as hyper-intelligent bug finders and contributors are, parsing through all of this information is often exhausting. Some of the more popular projects have turned off their issue queues and PR permissions outright in response.

For those that have embraced these new tools, the rising prices of quality compute mean that, along with their free time, they now need to burn their own cash to keep up. This makes us uneasy. Many of us cannot shake the feeling that this initial “generally affordable” period of frontier model usage will not last. What then?

Something has got to give. These people and projects need more support.

That’s where we come in…

Introducing Open Public (opub)

We link donors to open source projects. Donations fund donated compute for over 30 leading agentic coding models. Token usage is public. Donors know their generosity went toward the projects they support.

When donations are received, capped compute keys provide maintainers with a fast, reliable stream of compute to fuel whatever will help them keep up.

They might use GitHub’s Copilot CLI to manage GitHub issues and PRs, Continue to review and audit incoming PRs, or spend raw tokens for development and fixes through popular harnesses like Claude Code, OpenAI Codex, Mistral Vibe, or OpenCode.

Spend events roll back to the opub project page, so donor impact is visible in the project ledger. If a maintainer’s agentic session starts through the opub open source CLI, compute usage is considered Linked: donors can see that spend was tied to the compute key and project session they funded.

The juice to stay afloat

Maintainers already have work that donated compute can help with.

A donor might want to help a project close stale bugs, review a backlog of pull requests, improve tests before a release, investigate a security report, ship a desirable feature, or modernize documentation. Open Public provides a way to do so by directly empowering the maintainers at the heart of the project.

We turn donations into compute: tokens, the juice, the fuel of agentic coding.

Through opub, the unit of trust is at the project level:

  • an opub project represents and verifies a public GitHub repository + maintainer
  • a donation funds one project’s compute balance
  • maintainers make capped compute keys to consume the balance
  • token spend appears within the public project ledger
  • if the CLI is used, Linked sessions show funded compute was launched from the right project context

Donation to project balance to capped compute key to token spend and linked session

To correlate spend with the project, we do not need to observe prompts, responses, diffs, files, commits, or pull requests. It’s a clean, transparent way to ensure the projects you appreciate and rely on won’t fall behind the agentic flood.

The founding round

Our goal is to amplify the health of the open source ecosystem. Any public GitHub repository can register now. To celebrate our launch and welcome project maintainers, the first 20 eligible verified projects with 100 or more stars get $50 in starter donated compute from opub.

Register now

After registration, connect a GitHub repository to receive your own Open Public project page. Projects outside the starter donated compute offer are welcome too: register, share the page, receive donations, and create compute keys once the project has available balance.

Our next mission? Find you some generous donors. To help, you can share your project page on social media, put it into your README, and point your community to it when people ask how to support the project. We’ll do our best to surface projects and provide exposure wherever possible.

Once someone has donated to your project, you can create a key and securely apply that compute through leading models such as:

  • Claude Sonnet 4.6 (anthropic/claude-sonnet-4.6)
  • Claude Haiku 4.5 (anthropic/claude-haiku-4.5)
  • GPT-5.5 (openai/gpt-5.5)
  • GPT-5.4 (openai/gpt-5.4)
  • GPT-5.4 Mini (openai/gpt-5.4-mini)
  • GPT-5.3 Codex (openai/gpt-5.3-codex)
  • Codestral 2508 (mistralai/codestral-2508)
  • Devstral (mistralai/devstral-2512)
  • MiniMax M2.5 (minimax/minimax-m2.5)

There are over 30 models at various costs, all served at their standard rates.

See the documentation for the full list of Available models.

What maintainers can do

After a project has available balance, a verified maintainer creates a compute key with a dollar limit. The limit is chosen by the maintainer and reserved from the project balance. Multiple active compute keys are allowed, so a project can keep setup flexible, rotate keys, or separate workflows without exposing unlimited spend.

Each key is shown once in the browser. After that, the secret belongs in the maintainer’s local credential store or direct tool configuration.

The key can be used two ways:

  1. run a supported agent through the opub CLI for a Linked session paste the key into any compatible OpenAI-formatted workflow for direct, unlinked use
  2. Both paths spend from the project balance. The CLI path appends a Linked badge. That way, donors can see when compute was spent through a linked project session.

Linked sessions

Session linking is not required, but it sends a strong signal to donors.

The opub CLI wraps the agent harness launch:

opub setup codex --project owner/repo --compute-key-id ck_...
opub run codex

opub setup stores the capped compute key in the system credential store and writes non-secret agent configuration. opub run starts the agent with the right credentials and refreshes a local, secretless MCP session for project context.

That session context can say which project, compute key, and agent were launched. It does not prove what the maintainer typed, what the model answered, which files changed, or which issue was fixed.

We do not and will not observe, train on, or collect prompts or prompt responses. Our method of session linking is open source and relies on MCP and agent-side skills to report session state. Donors get a useful public signal without turning maintainers’ workspaces into surveillance systems.

The CLI supports popular agentic coding harnesses such as:

  • Claude Code (claude)
  • Codex (codex)
  • GitHub Copilot CLI (copilot)
  • Vibe (vibe)
  • OpenCode (opencode)
  • Continue (continue)

The API key can also be used directly with OpenAI-compatible tooling. That path is unlinked, but spend still accrues to the project balance.

What comes next

We’re excited to see what the creators of our favorite projects can do with greater access to today’s leading coding models. We know this isn’t for everyone, and there’s no pressure for project maintainers to register if they would rather not use agentic compute. But for those who are willing to use these new tools, we’re excited to work with you to eliminate or reduce your agent-based costs.

This blog will publish content to help maintainers get the most out of donated compute, and profile the maintainers using it to build and refine the great things we have relied on in the past and will rely on tomorrow.

May no maintainer be left behind.

Four iteration rounds on a security scanner I run, all of them visible. Here is what the loop actually looks like.

Four iteration rounds on a security scanner I run, all of them visible. Here is what the loop actually looks like.

This is a worked example of running a continuous security scanner on a public surface and being wrong, in both directions, in close succession. The scanner is AgentScore, which scans MCP packages on npm and publishes a public security record. Over four days in mid-May 2026 it went through three corrections: an over-flagged class, a too-broad mitigator pass that produced a false negative on a known-credential-leak package, and a fresh sample-check that uncovered new sanitiser patterns we had not yet recognised. Each correction is in the public changelog. None of them was silent.

The point of the post is the loop, not the resolution.

What the data looked like on 2026-05-15

A class-tracker counts how many MCP packages have HIGH command_injection findings in a rolling 7-day window. Mid-April that number was a handful. Mid-May it was 31 distinct packages. Most were in the browser, CLI, or terminal-automation segment, where shell execution is genuinely common because the packages drive other CLIs.

The first hypothesis was real maintainer drift: maybe enough package authors in this segment were writing unsafe ${...} shell wrappers that the public-record arc had a story.

The second hypothesis, which became more probable when one more advisory took the count to 31 distinct packages, was that the scanner’s regex was over-flagging legitimate template-literal patterns. Thirty distinct maintainers all genuinely shipping unsafe shell exec in 30 days, in a community of ~1,300 packages, would be an ecosystem failure. More likely the scanner had a false-positive class.

The actual answer, after four rounds of work over 96 hours, turned out to be mixed. Some of the 31 were false positives the scanner could downgrade with new context-aware mitigators. Some were real static-analysis hits in single-user CLI threat models that the scanner correctly continued to flag. The post is about how I got from “31 packages, hypothesis unclear” to “scanner correctly distinguishes which is which” and what each iteration round had to fix.

Round 1: the initial sample audit

The first move on 2026-05-16 was to manually inspect a sample of the flagged packages. Five were picked across the class: safari-mcp, brave-real-browser-mcp-server, memoir-cli, s3db.js, and claude-flow. Each was rescanned by hand against the regex that originally flagged them.

Of the five samples, four had patterns the scanner was catching incorrectly. Examples:

  • A postinstall script invoking codesign against an internal helper path constructed via path.join(__dirname, ...). Not user-controllable.
  • A this.exec(SELECT ${fields} FROM …) SQL query in a sqlite client. Not a child process call at all.
  • Hardcoded ALL_CAPS module constants like ${REPO_URL} interpolated for readability. Not user input.
  • A numeric ID from a GitHub webhook payload (event.pull_request.number). Cannot carry shell metacharacters.
  • A .md file titled v3-security-architect.md with the line literally annotated // ❌ Dangerous: shell injection possible as a teaching example. The scanner caught a security tutorial.

Initial estimated false-positive rate on the sample: high, but the number itself ended up being revised twice over the next 48 hours as the scope of “false positive” tightened.

Rounds 2 and 3: shipping the fix, then catching the fix’s bugs

Three corrective passes shipped within hours of each other on 2026-05-16. Each was followed by external review that caught a structural issue in the previous one.

Pattern-level mitigators (round 1 of these three). Seven extensions to the existing sanitizer category (recognise this.exec, __dirname, ${ALL_CAPS}, numeric coercion, code-signing toolchain, npm auto-update patterns) plus a new documentation_context category for markdown code fences and anti-pattern annotations. A local verifier reported 100% suppression on the five-package sample.

Per-file iteration (round 2, caught by review): the 100% was an artifact. The scanner had been reading the gunzipped tarball as one buffer and running mitigators against a ±2000 character window in that buffer. A README heading three files away could downgrade a real finding in another file. The fix: walk the tar archive entry-by-entry, run mitigators against each file’s own content only. Re-verification: still 100%.

All-matches per file (round 3, caught by review again): even per-file, single-match-per-file was masking. The scanner ran each pattern as a single .exec() per file, so an early benign shell call in a file would silently hide a later real unsafe one in the same file. Replaced with an all-matches walk that scores each match independently and keeps the worst-severity result. Re-verification: 75 percent, not 100.

The honest number was 75. [email protected] actually does contain exec(open “${url}”) in upgrade.js and execSync(git clone ${config.gitRepo} .) in diff.js. In a single-user CLI threat model these are benign because the user is attacking only themselves. But the scanner cannot infer the threat model from static analysis, and the flag is correct at that level.

The previous “100%” claim was a measurement bug, not progress.

What I did with the historic advisories

Two paths were possible.

Option A: rewrite each of the affected advisories to the corrected severity. Clean for the casual reader. But quietly editing past records contradicts the public-correction-loop principle that is literally on the methodology page.

Option B: keep the original advisories visible at their original severity, add a correction record at the top of the advisories page pointing readers to the mitigator changelog, and let the live /report/<package> pages reflect the corrected severity once the monitor cron re-scans each affected package over the following 3-4 days.

I took Option B. The yellow correction banner on /security/advisories reads:

The scanner shipped a precision pass on 2026-05-16 targeting a self-detected false-positive class in browser/CLI/terminal MCP packages. Advisories below published before that pass on the affected class remain visible at their original severity. The live /report/<package> page will reflect the corrected severity once the monitor cron rescans that package. Until then, the cached scan-history value on the report page may still show the pre-mitigator severity. We do not silently rewrite the public record.

The mitigator changelog at /scanner/precision carries the May 16 mitigator-pass entry AND a follow-up entry documenting the per-file iteration and the corrected 75 percent suppression number. Both are on the public surface. Neither was edited after the fact.

What rounds 1 to 3 proved

It did not prove the scanner was correct. It proved three other things.

One: the in-class running count plus a sample audit is enough to detect a false-positive class before it does serious damage to credibility. I caught this in a 30-day window with no maintainer pushing back.

Two: the iteration loop works on me, not just on the packages I scan. The same /scanner/precision page that documents mitigators shipped in response to maintainers like Agions and HomenShum now carries an entry where the trigger was my own internal review.

Three: refusing to silently rewrite history is uncomfortable but it is the only credibility move. A reader who finds an old advisory on a package and a corrected scan on the live report page can see the gap and the correction note explaining it. They do not have to trust that the system always told the truth. They can read both versions and decide.

Round 4 (the false-negative correction, 48 hours later)

The work above was substantially complete after the 2026-05-16 fix. Two days later it needed an update, because the fix itself had introduced a false negative.

The new documentation_context mitigator category shipped on 2026-05-16 included a markdown-heading pattern /^#{1,4}s+S/m. That regex matches markdown headings. It also matches YAML comments, shell-script comments, TOML headers, and anything else that starts with #. Without a filename gate, the category fired on any file that happened to contain a #-prefixed line within 2000 characters of a real finding.

Concrete miss: fa-mcp-sdk, the package whose config/local.yaml we publicly disclosed in late April for shipping credentials in the published tarball, scored 30 / HIGH on every scan from April 25 through May 13. On May 17 a fresh scan with the new v2.2 ruleset returned 65 / ELEVATED. The CRITICAL hardcoded_secret finding was now MEDIUM. Looking at it on May 18 morning, the digest showed a score recovery that looked like maintainer action after four weeks of silence. It was not. The YAML file’s own header comments matched the markdown-heading regex, the documentation_context mitigator fired, and the credentials we’d publicly disclosed were silently downgraded by our own scanner.

Two other packages had the same effect with materially-changed public severity (mcpbrowser and opencode-gitlab-dap). Four more had the same misfire but their findings were already correctly downgraded by parallel sanitizer mitigators, so the public score did not move.

The fix was a six-line patch: a CATEGORY_FILE_GATES table that requires documentation_context patterns to fire only on files whose extension is .md, .mdx, .markdown, .rst, .txt, .adoc, or .asciidoc. Other mitigator categories were not file-gated because their patterns are tied to language syntax that does not overlap with comment characters in other languages.

Within the same morning, I rescanned the seven affected packages with the fixed scanner and pushed the corrected scan_history rows. fa-mcp-sdk is back at 45 / HIGH with the CRITICAL credential finding restored. The /scanner/precision changelog carries a new entry documenting the fix exactly the same way the original false-positive entry was documented two days earlier.

So now the public correction record contains two entries: one for an over-correction on the false-positive side that affected 31 advisories, and one for an under-correction on the false-negative side that affected 3 public scores. Both visible. Neither rewritten silently.

The pattern this surfaces: precision passes on a scanner have a natural overshoot. You catch a class of false positives, you ship mitigators, the mitigators are slightly too broad, you catch the resulting false negatives, you tighten. The thing that makes this a credibility move rather than a credibility cost is doing all of it on the public surface, where readers can audit the shape of the correction loop rather than trust that we always told them the truth.

What’s reproducible

The mitigator commits are public. The 5-package sample is version-pinned in scripts/verify-mitigators.cjs so the precision claim can be reproduced. The pattern tracker is at scripts/track-command-injection-pattern.cjs. The corrected scanner is at SCANNER_VERSION = 2.2 in src/lib/kya/scanner.js, with the May 18 file-gate fix in the same file. The list of 7 affected packages and their corrected scores is in the /scanner/precision changelog entry dated 2026-05-18.

The 31 historic advisories are still at /security/advisories with the correction banner pointing at the changelog.

What the tracker count actually stabilised at

Three days after the May 16 mitigator pass, the running count in the browser/CLI command_injection class dropped from 31 to 14 in 48 hours. We expected it to keep dropping toward zero as the v2.2 scanner propagated through the corpus.

It did not. The count moved back up to around 20 and stayed there.

The naive read of that is “the fix did not work.” The honest read is different. The tracker counts packages with HIGH command_injection findings the scanner did NOT downgrade. If the v2.2 + file-gate mitigators are working, FPs disappear from the count and only real-pattern hits remain. The count stabilising at roughly 20 means the underlying rate at which real template-literal shell-exec patterns appear in new browser/CLI MCP publishes is about 20 packages per rolling 7-day window. That is the ecosystem’s actual signal, not our scanner’s failure.

To verify, we sampled 5 packages from the post-fix corpus: beecork, memex-mvp, @piyushdua/engram-dev, agentic-flow, @kevinrabun/judges. Manual inspection of each:

  • beecork wraps a user-config-derived bin name into execSync(${whichCmd} ${bin}) in dist/cli/doctor.js. Real static-analysis hit. The threat model is single-user CLI (the user is configuring their own tool), so the practical risk is low, but the scanner correctly cannot infer that.

  • memex-mvp does execSync(launchctl unload ${JSON.stringify(PLIST_PATH)}). JSON.stringify wraps the value in escaped double quotes, which is a shell-safe quoting technique. False positive that the scanner did not yet recognise as a sanitiser.

  • @piyushdua/engram-dev does execSync(git worktree remove ${shellQuote(record.path)}). The maintainer is explicitly wrapping input in shellQuote(). False positive that the scanner did not yet recognise as a sanitiser.

  • agentic-flow does execSync(gh ${args.join(‘ ‘)}) in .claude/helpers/github-safe.js. args is process.argv. Real static-analysis hit in a CLI threat model.

  • @kevinrabun/judges is a code-judging benchmark tool. The dangerous-looking code is embedded as STRING LITERALS in a fixture array (expectedRuleIds: ["AUTH-001", ...]), specifically as test corpus for the tool to detect. False positive that the scanner did not yet recognise as a fixture marker pattern.

3 of 5 are false positives the scanner could downgrade with additional mitigator patterns. 2 of 5 are real interpolation-into-shell patterns the scanner correctly keeps flagged at HIGH.

The third precision pass shipped today, 2026-05-19, adds the missing mitigators:

  • shellQuote(), shell_quote, shq.quote(, require('shell-quote') as sanitiser patterns
  • ${JSON.stringify(...)} directly inside the interpolation slot as a sanitiser pattern
  • expectedRuleIds:, dangerousPatterns:, benchmarkCases: as test-fixture markers
  • File-path heuristics for benchmark*.js, rules*.js, judges*.js that contain detection corpora
  • A meta-template marker: source containing both backslash-escaped backticks and backslash-escaped ${ interpolation markers in close proximity. That combination means the surrounding string is a template literal embedded as string data, e.g. a code-judging tool’s test fixture where the dangerous-looking code is corpus to be detected rather than executable code.

After this third pass, the 5-package post-fix sample suppression rate is 60 percent. Two stay at HIGH because they really are real-pattern hits in single-user CLI threat models. The remaining count in the tracker now reflects something closer to the genuine rate of real template-literal shell exec in new browser/CLI MCP publishes, not measurement noise.

What the iteration loop actually looks like

Four rounds of precision work in 96 hours:

Round Date What it corrected
1 2026-05-16 Initial mitigator set: this.exec, path.join, ALL_CAPS, numeric coercion, codesign, npm auto-update, plus a documentation_context category for markdown anti-pattern examples.
2 2026-05-16 Per-file iteration (mitigators only see same-file context), all-matches-per-file (an early benign call cannot mask a later real one), GNU/pax tar parsing, version-pinned verification.
3 2026-05-18 documentation_context only fires on .md, .mdx, .rst, .txt files. The previous loose form was matching YAML # comments as if they were markdown headings, which silently downgraded fa-mcp-sdk‘s CRITICAL credential finding to MEDIUM. False-negative correction, 7 packages re-scanned, public correction record kept.
4 2026-05-19 Sanitiser additions for shellQuote(), ${JSON.stringify(...)}, and benchmark fixture markers. False-positive correction on the post-fix sample.

Each round was prompted by either a fresh sample audit or a peer review noticing a structural issue with the previous round. None of the rounds were silent. Each one shipped a /scanner/precision changelog entry naming what was wrong and what changed.

The point is not that AgentScore got everything right. The point is that the iteration is visible. A reader who finds an old advisory on a package and a corrected scan on the live report page can see the gap and the correction note explaining it. They do not have to trust the system. They can read both versions and decide.

For anyone running continuous scanning at scale on a public surface, the lesson is: the loud direction (false positives) is easier to catch than the quiet direction (false negatives), the FN risk gets harder once you start tightening, and the only thing that compounds credibility through all of it is doing the corrections in public.

AgentScore continuously scans MCP packages on npm and publishes a public security record. Live data, advisories, and the full mitigator changelog are at agentscores.xyz.

Why Good Abstractions Make Debugging Harder

Good abstractions are great when you are building software.

They are much less great when you are debugging production.

The reason is simple: abstraction hides details, and debugging often depends on the details you hoped to ignore.

In small codebases, this is barely noticeable. In real systems, especially with caches, async flows, optimistic UI, and multiple state owners, it becomes a serious problem.

The core issue

The more layers you add, the easier it is for the system to become “locally correct” and “globally wrong”.

For example:

  • the frontend thinks the payment succeeded,
  • the backend committed the transaction,
  • the event was published,
  • the cache still serves the old value,
  • the UI shows stale data.

Every layer is doing something reasonable.

The problem is that they are not all talking about the same version of reality.

A simple example

Imagine this flow:

  1. User clicks Retry payment
  2. Frontend updates UI optimistically
  3. API returns 200 OK
  4. Database is updated
  5. Event is sent to downstream systems
  6. Redis still serves old state
  7. UI refreshes from cache and shows stale data

This is the kind of bug that wastes hours.

Not because any single line of code is hard, but because the truth is spread across several places.

Example in code

Let’s say the frontend uses optimistic updates:

const onRetryPayment = async () => {
  setPaymentStatus("PAID");

  try {
    const response = await fetch("/api/payments/retry", {
      method: "POST",
    });

    if (!response.ok) {
      throw new Error("Retry failed");
    }
  } catch (error) {
    setPaymentStatus("FAILED");
  }
};

At first glance, this looks fine.

But now imagine:

  • the API succeeds,
  • the DB is updated,
  • an event is emitted,
  • a consumer deduplicates the event incorrectly,
  • Redis still contains the old value,
  • the UI re-renders from stale cache.

The bug is no longer in this function.

The bug is in the propagation path.

Why abstractions make this worse

Abstractions hide the exact mechanics that matter during incidents.

They hide things like:

  • who owns the state,
  • when the state changes,
  • whether the update is synchronous or async,
  • whether caches are invalidated,
  • whether retries are safe,
  • whether events can arrive out of order.

That is useful in normal development.

It is terrible during debugging.

Because when something is wrong, you do not need another clean interface. You need visibility.

Typical failure patterns

These are the patterns I see most often in real systems.

1. Stale read

The data was updated, but one layer still serves an old version.

// DB updated successfully
await db.payment.update({
  where: { id: paymentId },
  data: { status: "PAID" },
});

// Cache not invalidated

Result:

  • DB = PAID
  • cache = PENDING
  • UI = PENDING

2. Lost update

Two writes happen close together, and one silently overwrites the other.

await updateProfile({ name: "Alex" });
await updateProfile({ name: "John" });

If the system uses last-write-wins without proper locking or versioning, the final state may not match user intent.

3. Ghost update

One layer changes, but another never receives the update.

dispatch(updateOrderStatus("PAID"));
// but query cache is never invalidated

The result is a UI that looks stuck even though the backend is correct.

4. Event reorder bug

Events arrive in a different order than they were produced.

// Event B processed before Event A
processEvent("payment_succeeded");
processEvent("payment_pending");

Now the final state may be wrong even if both handlers are valid.

The debugging trap

The trap is assuming this is a code bug.

Very often it is not.

It is a state ownership bug.

That means the real question is not:

  • “Which function crashed?”

The real question is:

  • “Which layer is the source of truth right now?”

If you cannot answer that clearly, debugging becomes guesswork.

A better way to think about it

Instead of thinking in terms of “where is the bug?”, think in terms of “where does state live?”

A useful checklist:

  • Where is the canonical value stored?
  • Which layer may cache it?
  • Which layer may derive it?
  • Which layer may overwrite it?
  • Which layer may delay it?
  • Which layer may retry it?

If the same value exists in five places, you now have five opportunities for disagreement.

Debugging strategy

When a bug crosses abstraction boundaries, I usually inspect it in this order:

Step 1: Check the source of truth

Confirm where the canonical data lives.

Step 2: Rebuild the timeline

Trace the state from user action to backend write to cache update to UI read.

Step 3: Check invalidation

If a cache exists, verify it is updated or cleared at the right moment.

Step 4: Check idempotency

If retries or events are involved, verify the operation can safely happen more than once.

Step 5: Check ordering

If events are async, verify the system does not depend on strict ordering unless it actually guarantees it.

When abstractions do help

This is not an anti-abstraction argument.

Good abstractions are still valuable when they:

  • reduce search space,
  • make ownership clear,
  • keep state local,
  • expose transitions explicitly.

For example, a small component with local state is easier to debug than three caches and two event consumers trying to keep the same value in sync.

function Counter() {
  const [count, setCount] = useState(0);

  return (
    <button onClick={() => setCount(count + 1)}>
      Count: {count}
    </button>
  );
}

This is easy to reason about because there is one owner of the state.

That is the difference.

What to do in real systems

If you want abstractions to stay helpful in production, make them observable.

That means:

  • add logs at boundaries,
  • use trace IDs,
  • keep ownership explicit,
  • invalidate caches intentionally,
  • design retries to be safe,
  • avoid hidden duplicated state.

A good abstraction should reduce complexity, not hide the mechanics that make incidents debuggable.

Final thought

The best abstractions are honest.

They do not pretend the system is simpler than it is. They make the system easier to understand without hiding where truth lives.

That is why debugging gets harder as systems grow: not because abstraction is bad, but because abstraction is often too successful at hiding the exact thing you need under pressure.

Found a Coordinated Inauthentic Network on GitHub: 24 Accounts, Fabricated History, and a Generator That Left Its PID in Three READMEs

A field report on tracking coordinated inauthentic behavior through commit signatures, backdated git history, and an automation tool that left its process ID embedded in three README files.

This is Part 3 of an ongoing investigation. Part 1 documented the initial discovery — 8 accounts with Jaccard following-list similarity of 0.99+ across ~29,800 entries each, evading cross-follow detection entirely. Part 2 expanded the cluster to 9 accounts and attributed the generation pipeline to a specific GitHub identity: hajigur69.

This part covers an earlier operation by the same operator, running nine months before the follow botnet was provisioned. The hajigur69 co-author fingerprint is present in both. So is the fallback_ generator artifact. The infrastructure was already running.

It started with a string.

66867581+hajigur69

That number-plus-username combination kept appearing in Co-authored-by commit trailers across thousands of commits from dozens of different GitHub accounts. Not as an author. Not as a committer. Embedded in the trailer block, like a watermark — or a coordination mechanism the operator never rotated.

That string became the fingerprint for an entire network.

What I Was Looking At

The network — I’m calling it HAJINET — operates across six distinct layers:

  1. Commit farming: Coordinated accounts mass-generate commits embedding the hajigur69 co-author signature to inflate contribution graphs
  2. Repo spam: 400+ procedurally generated repositories with LLM-written READMEs targeting crypto/Web3 search terms
  3. Fake engagement: Purchased stars from a third-party service to boost GitHub and Google search ranking
  4. Follow spam: Mass-following (30,000+ on the primary account) to appear legitimate
  5. SEO poisoning: Cloning the names of famous repos like system-design-primer and developer-roadmap
  6. GitHub as persistence backend: Using a repository’s commit history as a synthetic activity signal and data persistence mechanism — with fabricated timestamps going back seven months before the account existed

By the time I was done, I had 24 accounts, 33 confirmed star-service bot accounts, a root commit SHA proving a 213-day timeline impossibility, and three README files containing an automation tool’s process ID that it forgot to strip before pushing.

Here’s how I found it.

The 24 accounts: the 9-account follow botnet cluster (canestein, hazexone, domcomit, kylehyne, jaderytm, vierystein, hanyvert, mariwatts, lynewinter) plus Lyne6666, uhsr, mohammadtzs, and 12 additional commit-farming accounts identified via the hajigur69 co-author signature. Four of the botnet cluster accounts — canestein, hazexone, domcomit, and kylehyne — appear in both this operation and the follow botnet documented in Parts 1 and 2. They are the same operator’s assets across both deployments.

The Commit Fingerprint

When the 66867581+hajigur69 string first appeared in search results, the volume was the tell. GitHub’s commit search API showed it across thousands of commits from a cluster of 22 accounts — canestein, hazexone, domcomit, kylehyne, and 18 others — all generating commits in a tight July–August 2025 window:

2025-07-08..2025-07-14 :  1,738 hits
2025-07-15..2025-07-21 :    701 hits
2025-07-22..2025-07-31 :    949 hits
2025-08-01..2025-08-15 :  7,194 hits  ← peak
2025-08-16..2025-08-31 :      0 hits  ← hard stop

The August 16 cliff edge is significant. That’s not a developer going on vacation. That’s consistent with an account action or a deliberate operator pivot.

The hajigur69 account’s GitHub ID is 66867581. That numeric ID embedded alongside the username in the co-author string is what made it searchable. Whoever set up the automation configured it once and never rotated the signature.

The Satellite Account

Following the commit graph led to Lyne6666, an account created May 3, 2025 with 163 public repositories — all created on July 9, 2025 at 18:55 UTC. Multiple commits in the same minute. I pulled the LICENSE SHA from a sample:

8aa26455d23acf904be3ed9dfb3a3efe3e49245a

Same SHA across all 163 repos. That’s not a coincidence — it’s a file copy from a template directory that never changed. Git hashes content, not filenames. Identical SHA means identical bytes, which means the same LICENSE was stamped into every repo from a single source.

The repo names followed a template: {Tech}{Testnet}{Function}{Suffix}. TPUTestnetSystemSolutionsNext. DAOTestnetAIKitPro. IoTTestnetPlatformLabsX. Every README had this in the install section:

pip install git+https://github.com/Lyne6666/{RepoName}.git

163 repos. 163 pip install vectors. No postinstall hooks confirmed yet, but the infrastructure is there.

The Primary Operator

The Lyne6666 repos had an email in the commit headers: [email protected]. That’s a private burner domain — one user, WHOIS privacy-shielded via Identity Digital. The account it led to, uhsr, was created July 10, 2025 — one day after Lyne6666‘s mass repo creation.

At the time of investigation: 237 public repos, 2,972 followers, 30,778 following.

That following-to-follower ratio — 10.4:1 — is a follow-spam pattern. Mass-follow enough accounts and some percentage follow back, which makes the account look organically connected to a real community.

uhsr‘s commit volume shows the operation’s activity profile in four numbers:

July 2025:       1,382 commits  (71% of all-time activity)
August 2025:       247 commits
September 2025:     21 commits
October 2025:       96 commits

71% of an account’s entire commit history in a single month. That’s not a developer. That’s a deployment window.

The Impossible Timeline

uhsr/AssetMarket was the most interesting repository. It contained a .Logs file with ~365 entries running from January 1, 2025 through December 31, 2025. Daily entries, format: Logs: YYYY-MM-DD <8charToken>.

The repo was created August 2, 2025.

curl -s "https://api.github.com/repos/uhsr/AssetMarket" | python3 -c "
import json,sys; r=json.load(sys.stdin)
print(r['created_at'])
"
# 2025-08-02T16:29:22Z

So I pulled the commit history and paginated back to the earliest entries. The root commit:

SHA:            4f8f47697eb89c8818820ca92348be01c4544878
Message:        Logs on 2025-01-01
Author date:    2025-01-01T14:47:47Z
Committer date: 2025-01-01T14:47:47Z
Author email:   [email protected]

Repo created:   2025-08-02T16:29:22Z

A commit dated January 1 in a repo that didn’t exist until August 2. That’s 213 days of fabricated git history.

The technique is worth noting: both GIT_AUTHOR_DATE and GIT_COMMITTER_DATE were overridden simultaneously. Naive backdating only sets the author date, leaving the committer date as the real push timestamp — a detectable mismatch. This operator knew that. They set both fields identically on every commit in the fabricated window. The .Logs file with its 8-character daily tokens appears synthetically generated rather than organically accumulated — consistent with a bulk scripted push using pre-generated identifiers, designed to make the contribution graph look like 7 months of continuous activity.

The repository is consistent with use as a synthetic activity signal and lightweight persistence backend, not legitimate version control.

The Tool That Left Its Name in the File

The high-value repositories — AssetMarket, SmartContract, DigitalWallet, TokenLab, BlockchainKit — all had longer, LLM-generated READMEs. While pulling the raw content of AssetMarket‘s README, I found this at the top:

<!-- fallback_AssetMarket_20250802163009_95172 -->

An HTML comment. Invisible on the rendered page. Accidentally left in by the generation script.

Breaking it down:

  • fallback — the secondary template fired because the primary LLM generation path failed
  • AssetMarket — the repo name variable
  • 20250802163009 — generation timestamp: August 2, 2025, 16:30:09 UTC
  • 95172 — process ID from the generation script

I searched the rest of uhsr‘s repos and found two more:

uhsr/SmartContract  → <!-- fallback_SmartContract_20250802162757_83653 -->
uhsr/TokenLab       → <!-- fallback_TokenLab_20250802161931_80263 -->

Three repos, same machine, 38-minute window:

16:19:31  TokenLab      PID 80263
16:27:57  SmartContract PID 83653
16:30:09  AssetMarket   PID 95172

The PID gaps are irregular — consistent with a script iterating a repo list with API calls and sleep intervals between each generation run, with OS background processes accounting for the PID jumps. The fallback label on all three means the primary LLM path failed or timed out on all three in sequence, and the static fallback template was substituted. That’s why every feature bullet in all three READMEs contains the identical filler string:

“Advanced implementation with optimized performance and comprehensive error handling”

That’s the placeholder text for a template field that had no content. The script pushed it anyway.

The Star Service

The high-star repos had suspiciously uniform engagement. AssetMarket had 83 stars. SmartContract had 50. DigitalWallet had 49. Zero forks across all of them except one, which led to mohammadtzs — more on that shortly.

I pulled the stargazer lists and cross-referenced:

AssetMarket ∩ DigitalWallet ∩ SmartContract = 33 accounts

33 accounts starred all three repos. That’s 67% of DigitalWallet‘s total star count. Organic discovery doesn’t produce that overlap. This overlap pattern is consistent with a shared purchased-engagement pool being reused across repos.

The July 11 batch — 83 repos created in a single day — showed the purchase tier structure directly:

★2: 64 repos  (77%)
★1: 19 repos  (23%)
★0:  0 repos

Zero repos with zero stars. Every single one got at least one. The distribution has no organic variance. It reads like a bulk order: “2 stars each, downgrade 19 to 1.”

The August 2 high-value repos got proportionally more investment: AssetMarket at 83, SmartContract at 50, BlockchainKit at 36. The star spend correlates exactly with the repos that have pip install vectors in their READMEs — the ones most likely to get actually installed by a developer who finds them in search results.

The cross-network link: Two accounts from the 33 — SAPH1TE and ahnshy — also appear in the stargazer lists for Lyne6666 repos. The uhsr cluster and the Lyne6666 cluster were deliberately siloed (no social graph overlap, different account creation dates, different repo naming patterns). But they used the same star purchase service. That vendor relationship is the infrastructure bridge between the two otherwise separate network segments.

mohammadtzs

The one fork of DigitalWallet came from mohammadtzs, whose bio reads “Ex-gamer turned full-time Web3 airdrop hunter.” Created March 2025, 506 public repos, 100 forks — all from accounts that no longer exist (deleted or banned). The fork names included alork1, alork2, alork3, alorki1 — the cluster’s {name}{number} account generation pattern.

And mohammadtzs appeared in the 33-account star service pool.

Not a victim who stumbled onto a fake repo. A participant in the same engagement ecosystem, likely forking cluster repos to build social graph signals for airdrop qualification while the cluster provides the fake stars that make the airdrop worthwhile.

The October Pivot

When the August ban wave hit, the activity dropped to near zero in September. October brought 96 commits — almost entirely from a single scripted run on October 20, 2025, between 05:04 and 05:19 UTC:

awesomepythonTech        → impersonates vinta/awesome-python
freeprogrammingbooksHub  → impersonates EbookFoundation/free-programming-books
publicapisAI             → impersonates public-apis/public-apis
codinginterviewuniversityTools → impersonates jwasham/coding-interview-university
developerroadmapLab      → impersonates kamranahmedse/developer-roadmap
systemdesignprimerCloud  → impersonates donnemartin/system-design-primer
buildyourownxTools       → impersonates codecrafters-io/build-your-own-x

Seven repos in 15 minutes, all named after repositories with 230,000–340,000 stars. None contain any actual content. The descriptions are raw template output — developerroadmapLab has "enterprise enterprise-grade" in its description, a doubled template token that made it through with no human review.

This is the operation’s final documented phase: when the commit farming network got disrupted, the operator pivoted to pure SEO poisoning — trying to capture search traffic from developers looking for the real repositories.

What This Is

The full picture:

A scripted infrastructure generates accounts, populates them with LLM-written repositories targeting crypto and Web3 search terms, purchases stars to boost their GitHub search ranking, and mass-follows accounts to build a fake social graph. The high-value repos have pip install vectors ready. The primary operator’s account carries 7 months of fabricated commit history to look established. And when the commit farming network gets disrupted, the operation pivots to SEO poisoning of the most-searched developer repositories on the platform.

The generator tool left its process ID in three README files. The star service reused the same 33 accounts across every repo. The co-author fingerprint never rotated. For a technically sophisticated operation, the operational security was consistently poor — but that’s often how these get found.

Disclosure

This report has been submitted in full to GitHub Trust & Safety with API-verifiable evidence including the root backdated commit SHA (4f8f47697eb89c8818820ca92348be01c4544878), the generator artifact URLs, the 33-account star service fingerprint, and the complete account list.

All data was retrieved via the GitHub REST API v3 with authenticated requests. No accounts were accessed beyond their public API data. No systems were compromised.

The accounts canestein, hazexone, domcomit, and kylehyne documented here also appear in the follow botnet cluster identified in Parts 1 and 2. This report and those reports cover the same operator across two separate deployments.

If you recognize any of these accounts or have seen the hajigur69 co-author string in your own repos’ commit histories, that’s the network’s fingerprint — and worth reporting.

Cursor Just Released Composer 2.5. Here’s What Actually Changed for AI Coding Agents.

Cursor has spent the last year moving from “AI coding assistant” into something much more ambitious: a vertically integrated agentic software engineering stack. Yesterday’s release of Composer 2.5 makes that direction impossible to ignore.

This is not just a faster autocomplete model. Cursor is explicitly optimizing for long-horizon coding agents that can plan, execute, recover from failures, and stay coherent across large multi-step engineering tasks.

The Problem It’s Solving

Most coding models still break the moment a task stops being local.

They can generate a React component, patch a bug, or refactor a function. But once the task becomes multi-file, infrastructure-heavy, or operationally ambiguous, the cracks show quickly. Context drifts. Tool calls fail. The model loops. Terminal sessions become chaotic. Long-running execution loses coherence.

That is the real bottleneck in agentic software engineering right now.

Cursor says Composer 2.5 was specifically trained to improve “long-horizon agentic tasks” and follow complex instructions more reliably. The company also claims substantial behavioral improvements around effort calibration, communication style, and execution consistency. (Cursor)

This matters because the next phase of AI coding is no longer about code generation quality alone. It is about whether agents can operate inside real engineering environments without constantly collapsing under state management and execution complexity.

How Composer 2.5 Actually Works

Under the hood, Composer 2.5 continues Cursor’s strategy from Composer 2: domain-specialized reinforcement learning for software engineering workflows.

Cursor’s technical report for Composer 2 describes a two-stage training pipeline:

  1. Continued pretraining on a base model
  2. Large-scale reinforcement learning inside real software engineering environments and agent harnesses (arXiv)

The important detail is not the benchmark number. It is the training environment.

Cursor is training models directly inside the same operational harness used by deployed coding agents — including terminals, tools, multi-step execution chains, and realistic repository interactions. That creates a feedback loop where the model is optimized for actual agent workflows instead of isolated benchmark prompts. (arXiv)

Composer 2.5 reportedly improves:

  • Long-running task reliability
  • Multi-step execution planning
  • Instruction adherence
  • Agent communication behavior
  • Effort calibration during coding workflows (The Indian Express)

There is another important layer here: infrastructure economics.

Composer 2 originally gained attention because Cursor delivered strong coding performance at dramatically lower token costs than frontier proprietary models. Cursor positioned it as a cheaper alternative to systems from Anthropic and OpenAI. (Cursor)

That pricing advantage came with controversy.

After launch, developers discovered Composer 2 was built on top of Moonshot AI‘s open-weight Kimi K2.5 model. Cursor later acknowledged this publicly and admitted it should have disclosed the base model earlier. (Business Insider)

Composer 2.5 reportedly still builds on the same Kimi base checkpoint, but Cursor is increasingly differentiating through RL infrastructure, agent training environments, and deployment tooling rather than raw foundational pretraining. (The Indian Express)

That is a very different strategy from the “train everything from scratch” approach most frontier labs market publicly.

What Developers Are Actually Using It For

The interesting part about Cursor’s recent releases is that they increasingly resemble operational AI infrastructure rather than a standalone IDE.

Over the last few months, Cursor has launched:

  • Cursor SDK for programmatic agents
  • Cloud development environments for agents
  • Bugbot autonomous debugging systems
  • Multi-agent execution workflows
  • Cursor 3, a broader agentic workspace layer (Cursor)

Composer 2.5 sits in the middle of that stack.

The target use case is no longer “help me write code faster.” It is:

  • Autonomous repository maintenance
  • Long-running refactors
  • Infrastructure migration workflows
  • Multi-step debugging
  • Agent-managed terminal execution
  • PR generation and validation
  • Extended software tasks that may run for hours

That direction aligns closely with where the broader MCP and agentic ecosystem is heading.

The future competitive advantage is not just model intelligence. It is orchestration quality: tool reliability, memory handling, execution recovery, context persistence, and operational safety across long-running workflows.

This is exactly why infrastructure companies like Gentoro and MCP ecosystem players like Glama.ai matter increasingly in the stack. Models are becoming interchangeable faster than orchestration layers are.

Why This Is a Bigger Deal Than It Looks

Cursor is quietly proving something the broader AI market still underestimates:

Specialized agent training may matter more than raw frontier scale for real-world developer workflows.

Composer 2.5 is not trying to be a universal reasoning model. It is being optimized aggressively for software execution environments.

That shift has major implications.

The AI coding market is rapidly splitting into two layers:

  • Foundation model providers
  • Agent orchestration and execution platforms

Cursor appears to be betting the second layer becomes more defensible over time.

That also explains why the company is investing heavily in infrastructure. Reports indicate Cursor plans to train Composer 2.5 using xAI compute infrastructure with tens of thousands of GPUs. (Business Insider)

The strategic signal here is important:
AI coding is moving from “chatbot in an editor” toward persistent software agents operating inside full execution environments.

And once that happens, infrastructure quality becomes the actual moat.

Availability and Access

Composer 2.5 is now available through Cursor.

The release follows Cursor’s broader push into autonomous coding systems and arrives during intensifying competition from Claude Code, OpenAI, and other agentic developer tooling platforms. (WIRED)

The bigger story is not whether Composer 2.5 wins a benchmark cycle. It is that Cursor is steadily building an operational stack for autonomous software engineering.

The IDE war is turning into an agent infrastructure war.

Follow for more coverage on MCP, agentic AI, and AI infrastructure.

What Wrong Docs Cost Test Automation Teams

GitHub logo

You know the feeling. You copy a code example from the official docs, wire it into your test suite, and everything passes. Green across the board. Three months later, the framework ships a major version, that example uses a deprecated command, and suddenly 200 tests across 50 teams are failing on Monday morning.

Nobody changed the tests. Nobody changed the application. The docs were wrong, and the tests were built on them.

In test automation, a wrong code example does not break one test. It breaks every test that was modeled after it.

The ecosystem is bigger than you think

Test automation frameworks are infrastructure now, not niche tools.

GitHub logo

microsoft
/
playwright

Playwright is a framework for Web Testing and Automation. It allows testing Chromium, Firefox and WebKit with a single API.

🎭 Playwright

npm version Chromium version Firefox version WebKit version Join Discord

Playwright is a framework for web automation and testing. It drives Chromium, Firefox, and WebKit with a single API — in your tests, in your scripts, and as a tool for AI agents.

Get Started

Choose the path that fits your workflow:

Best for Install
Playwright Test End-to-end testing npm init playwright@latest
Playwright CLI Coding agents (Claude Code, Copilot) npm i -g @playwright/cli@latest
Playwright MCP AI agents and LLM-driven automation npx @playwright/mcp@latest
Playwright Library Browser automation scripts npm i playwright
VS Code Extension Test authoring and debugging in VS Code Install from Marketplace

Playwright Test

Playwright Test is a full-featured test runner built for end-to-end testing. It runs tests across Chromium, Firefox, and WebKit with full browser isolation, auto-waiting, and web-first assertions.

Install

npm init playwright@latest

Or add manually:

npm i -D @playwright/test
npx playwright install

Write a test

import { test, expect

…

GitHub logo

cypress-io
/
cypress

Fast, easy and reliable testing for anything that runs in a browser.

Cypress Logo

Documentation |
Changelog |
Roadmap

The web has evolved. Finally, testing has too.

Fast, easy and reliable testing for anything that runs in a browser.

Join us, we’re hiring.


npm


Discord chat


StackShare

What is Cypress?


Why Cypress Video

Installing

npm version

Install Cypress for Mac, Linux, or Windows, then get started.

npm install cypress --save-dev

or

yarn add cypress --dev

or

pnpm add cypress --save-dev

installing-cli e1693232

Contributing

cypress
CircleCI – develop branch

Please see our Contributing Guideline which explains repo organization, linting, testing, and other steps.

License

license

This project is licensed under the terms of the MIT license.

Badges

Configure a badge for your project’s README to show your test status or test count in the Cypress Cloud.

cypress

cypress

Or let the world know your project is using Cypress with the badge below.

Cypress.io

[![Cypress.io](https://img.shields.io/badge/tested%20with-Cypress-04C38E.svg)](https://www.cypress.io/)

Framework GitHub Stars Dependent Projects
Playwright 85,100+ 451,000+
Cypress 49,600+ 1,500,000+

Playwright publishes documentation across four languages: Node.js, Python, Java, and .NET. That is four times the surface area for documentation drift. Cypress has shipped 389 releases since its inception, and each release can deprecate commands, change default behaviors, or introduce new APIs.

A code example written for Cypress 12 may use cy.intercept() patterns that behave differently in Cypress 15. The example still runs. It just does not do what you expect.

The real cost, by the numbers

Here is where stale docs hit your team’s budget, velocity, and trust.

Test maintenance eats 40-60% of all testing effort

The Capgemini World Quality Report consistently finds that test maintenance consumes 40-60% of total testing effort. That is not writing new tests. That is fixing existing ones that broke because something changed underneath them.

When a QA engineer fixes a failing test, the first thing they check is the framework docs. If the docs still show the old pattern, the engineer cannot tell whether the test is wrong or the framework changed. They burn time debugging a problem that accurate documentation would have prevented.

The Katalon State of Software Quality Report 2025 found that only 11% of QA teams have reached an optimized level of test automation maturity. 56% of QA teams report they cannot keep up with testing demands. Documentation that adds friction instead of removing it makes this gap wider.

72% of developers abandon tools over bad docs

The Postman 2023 State of the API Report found that 72% of developers have abandoned an API due to poor documentation. 54% cite documentation as the number one factor when evaluating a tool.

The Stack Overflow Developer Survey 2023 found that 90.36% of developers use technical documentation as their primary learning resource. For test frameworks competing for adoption (Cypress vs. Playwright vs. Selenium vs. AI-powered tools like Mabl and Testim), your docs are the product evaluation. A developer who hits a broken quickstart example does not file a bug. They try the other framework.

CI pipeline failures: the cost nobody tracks

Each engineering-escalated support ticket costs $150 to $250 (DevRelCon / MetricNet). For a framework with thousands of users, a single stale example that generates 100 support tickets costs $15,000 to $25,000 in direct support alone. The real cost is the engineering hours spent debugging a documentation problem instead of shipping features.

What this looks like in your codebase

Your testing framework docs show this page object pattern:

// Cypress 12 page object pattern (outdated)
class LoginPage {
  visit() {
    cy.visit('/login')
  }

  fillUsername(username) {
    cy.get('#username').type(username)
  }

  fillPassword(password) {
    cy.get('#password').type(password)
  }

  submit() {
    cy.get('form').submit()
  }
}

But Cypress 15 recommends the App Actions pattern with cy.session() for authentication:

// Cypress 15 recommended pattern
Cypress.Commands.add('login', (username, password) => {
  cy.session([username, password], () => {
    cy.visit('/login')
    cy.get('[data-testid="username"]').type(username)
    cy.get('[data-testid="password"]').type(password)
    cy.get('[data-testid="submit"]').click()
    cy.url().should('include', '/dashboard')
  })
})

Both compile. Both run. But the first pattern creates a new browser session for every test, making the suite 3-5x slower. A team that follows the old docs builds 500 tests on the slow pattern before discovering the performance problem. Rewriting 500 tests is not a bug fix. It is a quarter of engineering time.

Three things that close the gap

1. Automated review on every PR. When framework code changes, check if documentation references the changed commands, selectors, or configuration options. Flag stale examples before they merge. For a framework shipping 30+ releases per year, manual review cannot keep pace.

2. Version-aware example validation. Your documentation linting should know which framework version each example targets. An example using cy.server() (removed in Cypress 12) or page.waitForNavigation() (deprecated in Playwright) should trigger a warning in the PR where the deprecation happens, not after a user reports it.

3. Cross-language freshness tracking. For frameworks like Playwright that publish docs in four languages, track which language variants have been updated when the underlying API changes. A Node.js example that gets updated while the Python equivalent stays stale creates an inconsistency that users of the less-maintained language will hit first.

The bottom line

If your testing framework documentation is the first thing a QA engineer reads when evaluating your tool, it needs the same quality bar as the framework itself.

How does your team keep test framework docs in sync? Drop your workflow in the comments. I am genuinely curious whether anyone has solved the version drift problem across multiple language SDKs.

If your team has this problem, where stale code examples in docs are creating downstream test failures, EkLine automates documentation review in your GitHub PR workflow. It catches stale code examples, broken links, and style violations before they reach developers. See how it works.

How I Built 4 AI-Assisted Projects Using Multiple AI Coding Tools

Most people ask:

“What’s the best AI coding tool?”

After building 4 AI-assisted projects, I realized the better question is:

“Which tool fits each stage of the workflow?”

My current workflow:

  • ChatGPT → ideas and prompts
  • Windsurf → rough project structure
  • Codex → fix and refactor logic
  • Cursor → production polish

Using this workflow, I built:

  1. Parent-child emotional connection app
  2. English learning platform
  3. AI video project
  4. Affiliate marketing system

Biggest lesson:

AI doesn’t magically replace developers.

It reduces friction between:
idea → prototype → working product.

That’s where the real leverage is.

Pushing Kiro’s Free Tier to Its Limits

50 credits a month, no credit card, and a lineup of models that actually ship code. How far can you push it?

Kiro’s Free Tier Just Got Clearer

If you’ve been watching the agentic IDE space, you know things move fast. Kiro launched in the summer of 2025 with something different from the pack: specs. Structured artifacts that formalize your development process so AI agents build the right thing instead of guessing.

Here’s what changed recently. The Kiro free tier now has an official model lineup, 50 credits per month, and zero credit card required. If you decide to upgrade to a paid plan later, you get a one time bonus of $20 worth of credits (1,000 credits).

In this post I’ll walk you through how to squeeze maximum value out of those 50 monthly credits. We’re talking model selection strategy, prompt efficiency, and the credit optimization tactics that let you build something real without spending a cent.

If you want to get started today you can download the Kiro IDE for Windows, Mac, and Linux or install the Kiro CLI for Mac and Linux using curl -fsSL https://cli.kiro.dev/install | bash

What’s on the Free Tier Now

The official breakdown for new users signing up today:

  • 50 credits per month, no credit card required
  • 4 Standout Models Including:

    • Claude Sonnet 4.5
    • Qwen3 Coder Next (70%+ on SWE-Bench Verified)
    • DeepSeek v3.2 (strong at agentic workflows)
    • MiniMax 2.1 (multi-language and frontend work)
  • Rate limits and weekly quota: check the docs for specifics

  • What’s NOT included: Premium models like Claude Opus 4.7 and Claude Sonnet 4.6 are reserved for paid plans

Previously it wasn’t clear which models were supported on the free tier. Now you know exactly what you’re working with. And these aren’t throwaway models. Qwen3 Coder Next scores above 70% on SWE-Bench Verified. DeepSeek v3.2 handles complex multi-step tasks well.

What is a Kiro Credit?

A credit is a unit of work in response to user prompts. Simple prompts can consume less than 1 credit. More complex prompts, like executing a spec task, typically cost more than 1 credit. Credits are metered to the second decimal point, so the least a task can consume is 0.01 credits.

Why does that matter? Different models consume credits at different rates. A given task that costs X credits with Auto model selection will cost you roughly:

Model Multiplier Credits for same task
Qwen3 Coder Next 0.05X Cheapest option
MiniMax 2.1 0.15X Budget-friendly
DeepSeek v3.2 0.25X Budget-friendly
Claude Sonnet 4.5 1.3X Full price

This means your 50 credits stretch much further if you’re intentional about model choice. Running DeepSeek for scaffolding and bulk code generation gives you roughly 4x more interactions than running everything through Sonnet.

Picking the Right Model for the Right Task

Not every prompt needs the most expensive model. I like to think about model selection on the free tier like so:

Qwen3 Coder Next – Your workhorse for scaffolding and complex logic

  • Multi-file project generation
  • Algorithm implementation
  • Code that needs to be correct on the first pass

DeepSeek v3.2 – The efficiency play for agentic workflows

  • Refactoring and restructuring existing code
  • Multi-step tasks where you’re iterating
  • When you need volume (lots of back-and-forth) without burning through credits

MiniMax 2.1 – The frontend and polyglot specialist

  • UI component generation
  • Projects spanning multiple languages
  • CSS-heavy work and layout tasks

Claude Sonnet 4.5 – Reserve for reasoning-heavy moments

  • Debugging tricky logic
  • Architecture decisions where you need nuanced analysis
  • Tasks where getting it wrong means burning more credits on corrections

My strategy: Start every session with DeepSeek or Qwen for the heavy lifting. Switch to Sonnet only when you hit a wall or need precise reasoning. This approach roughly doubles your effective interaction count.

Picking the Right Project

Not every project is a good fit for a 50-credit monthly budget. Here are some things to consider before you start building:

  • Bounded scope – A single-page app beats a multi-service platform. You want something you can describe in one or two paragraphs.
  • Familiar territory – If you already know the stack, you spend fewer credits asking “how does XYZ work?” and more credits writing actual code.
  • Clear deliverable – “Build a CLI that converts CSV to JSON” is better than “build something cool with data.” Remember, ambiguity costs credits.

The Art of the First Prompt

Your first prompt is the most important credit you’ll spend. A vague opener like “build me a todo app” will get you a generic scaffold, and then you’ll burn 10 more credits course-correcting.

What works

  • Be specific about the stack – “React with TypeScript, Vite, Tailwind CSS” saves a round trip.
  • Describe the end state – “A single page with a form that takes X and displays Y” gives Kiro a target.
  • Include constraints upfront – “No external APIs, no database, everything in-memory” prevents the agent from over-engineering.
  • Specify the model – Start with DeepSeek or Qwen for your initial scaffold. You can always switch to Sonnet later for refinement.

Example first prompt

Build a [project] using [stack]. It should [core behavior].
Keep it to [N] files. No tests unless I ask. No markdown summaries.

Credit Optimization Strategies

1. Front-load context with steering files

Kiro’s .kiro/steering/ directory lets you inject persistent instructions into every interaction. This is free. It doesn’t cost a single credit to set up, and it saves you from repeating yourself.

Things worth putting in steering:

  • Your preferred stack and conventions
  • “Don’t add tests unless asked”
  • “Don’t create summary markdown files”
  • “Use minimal code, no boilerplate”

2. Batch your requests

One prompt that says “add feature A, refactor component B, and fix the bug in C” is one credit. Three separate prompts is three credits. Group related changes whenever possible.

3. Use specs for multi-step features

Kiro’s spec mode lets you break a feature into tasks and iterate on the design before writing code. The planning phase helps you avoid wasted implementation credits on the wrong approach.

4. Lean on hooks for automation

Set up hooks to auto-lint or auto-format on save. This means you’re not spending credits asking Kiro to fix style issues when the tooling can handle it.

5. Do the easy stuff yourself

If you can write a CSS tweak or rename a variable faster than you can describe it, just do it. Save credits for the work where Kiro’s code generation actually saves you time.

6. Use #File and #Folder context

Dragging in the right file or referencing it with #File means Kiro doesn’t have to spend tool calls reading your codebase. Less exploration = fewer internal steps = more efficient credit usage.

What I Built

Over the last couple weeks I wanted to build two things to help my workflow as a developer advocate.

1/ An event resources website that I share during every event I present at (all links, QR codes, surveys, etc found in one place)
2/ A way to generate motion video that adheres to branding guidelines that I can use as B-roll in my videos

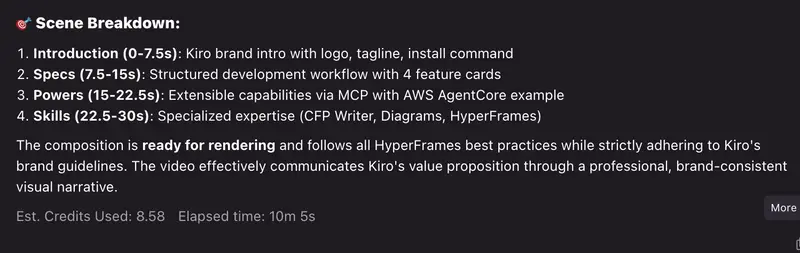
For this Kiro free tier demonstration I ran with #2 and still had leftover credits to attempt #1 later.

By the Numbers

  • Credits used: 17.87 / 50
  • Files created: 8
  • Lines of code: 799
  • Time spent: 36 minutes
  • Primary model used: DeepSeek v3.2, Claude Sonnet 4.5
  • Model switches: 2 times

My Prompt

/hyperframes using the #assets create a 30sec clip for a kiro promotional video. 
conform to all brand guidelines, render locally. 
clip should include aspects of what makes kiro standout like specs, powers, skills etc. 
You can augment your knowledge using the public site kiro.dev. 
Background has to be solid, no gradients. 
make sure all font in the clip is the branded diatype from the font folder.

Sample Clip Generated:

Where Credits Got Wasted

  • I hadn’t set up steering files for this project. DeepSeek created unnecessary validation files and summary markdowns, burning credits I could’ve saved

  • Opensource Hyperframes package was not installed globally before I started. Kiro agent could not render the video clip and wasted cycles trying to execute. With the initial prompt the agent was not able to render the video until I installed the package properly.

  • Should’ve switched models from DeepSeek to Sonnet once the initial video composition file was created so the model would have less trouble thinking through the next task. Sonnet was able to do that in one shot versus DeepSeek trying to iterate over and over on its mistake.

When to Upgrade: The $20 Paid Bonus Path

If 50 credits a month isn’t cutting it you can experiment with an upgrade to a paid plan. For the first time you do this, Kiro gives you $20 worth of credits (that’s 1,000 credits). You’ll need a valid credit card, and billing is prorated from your upgrade date.

What you unlock with paid:

  • Premium models: Claude Opus 4.7, Claude Sonnet 4.6
  • Higher rate limits
  • 1,000 bonus credits

Is it worth it? If you’ve exhausted your free tier and want to build something bigger, absolutely. But depending on the proof of concept you’re building, the free tier is enough to form a real opinion about whether Kiro fits your workflow.

Tips for Your Own 50-Credit Build

  1. Plan before you prompt. Spend 15 minutes with a notepad before you spend a credit.
  2. Write your steering file first. It’s the highest-ROI setup you can do.
  3. Pick your model intentionally. DeepSeek for volume, Sonnet for precision.
  4. Use specs for anything beyond a single feature. The upfront cost pays for itself.
  5. Don’t fight the agent. If Kiro’s going in a direction you don’t love, course-correct early. Letting it build the wrong thing and then asking for a rewrite is a two-credit penalty.
  6. Know when to type. Not everything needs to go through the agent. Small edits are faster by hand.

Don’t forget to give me a 🦄 if you got this far and let me know what you built with your 50 credits in the comments!

Additional Resources 📚

Microsoft Just Framed MCP as Part of the Open Agentic Stack. Here’s What That Actually Means.

For years, Microsoft’s open source strategy was mostly about cloud adoption and developer ecosystems. At Open Source Summit North America 2026, the company made something much bigger clear: it now sees open protocols and agent infrastructure as the next foundational layer of computing.

And buried inside that announcement was the real signal for the MCP ecosystem.

The Problem It’s Solving

Right now, most AI agents are still trapped inside fragmented execution environments.

Every framework has its own tooling model. Every cloud vendor has its own orchestration stack. Tool access, memory handling, governance, and runtime execution are all implemented differently depending on the platform. That fragmentation becomes a serious problem once agents move from demos into production infrastructure.

Microsoft’s latest messaging is essentially acknowledging that agentic systems need the equivalent of what Kubernetes became for containers: portable infrastructure primitives and open interoperability standards. ([Microsoft Open Source][1])

That is where MCP starts becoming strategically important.

Model Context Protocol was initially framed as a standardized interface for connecting models to tools and external systems. But the ecosystem around it has evolved rapidly. MCP is increasingly becoming a shared interoperability layer for agent execution environments, tool routing, UI delivery, and cross-platform orchestration. ([Wikipedia][2])

Microsoft’s Open Source Summit announcement strongly suggests the company understands that shift.

How Microsoft’s Open Agentic Stack Actually Works

In its official summit post, Microsoft explicitly described its vision around “frameworks, protocols, and governance for AI agents” and repeatedly emphasized the need for agents to operate “across frameworks, clouds, languages, and runtimes.” ([Microsoft Open Source][1])

That wording matters.

The company is no longer talking about isolated copilots. It is talking about infrastructure portability.

Microsoft’s announcement centered around several major layers:

  • Azure Linux 4.0
  • Azure Container Linux
  • Open governance tooling
  • Secure software supply chain infrastructure
  • Open agentic system interoperability ([SDxCentral][3])

The Linux layer is especially important here.

Microsoft says Azure Linux 4.0 is being positioned as a hardened operating system foundation for cloud-native and AI-native workloads. The company also confirmed that Linux infrastructure now underpins large parts of Azure’s AI stack, including services tied to GitHub, Microsoft 365, and ChatGPT-scale deployments. ([Cloud Native Now][4])

That changes the MCP conversation significantly.

MCP servers do not exist in isolation. Real-world deployment requires:

  • Sandboxed execution
  • Tool governance
  • Authentication layers
  • Runtime isolation
  • Observability
  • Secure software supply chains
  • Container orchestration
  • Cross-agent communication

In other words, MCP adoption eventually becomes an infrastructure problem, not just a protocol problem.

Microsoft’s summit positioning suggests the company increasingly sees agent interoperability and runtime portability as core platform primitives — similar to how Kubernetes standardized container orchestration a decade ago.

What Developers Are Actually Building With MCP

The MCP ecosystem has quietly moved far beyond simple tool calling.

Developers are now using MCP to build:

  • Multi-agent orchestration systems
  • Secure enterprise tool gateways
  • Agent memory layers
  • Remote execution environments
  • Interactive AI application interfaces
  • Cross-model tool portability
  • Agent observability pipelines

That evolution is happening fast across the open ecosystem.

The Agentic AI Foundation recently positioned MCP as a key interoperability layer for “secure, scalable agentic AI systems” operating across tools, models, and platforms. ([Linux Foundation][5])

At the same time, infrastructure companies are racing to operationalize the stack around it.

Platforms like Glama.ai are increasingly focused on MCP gateway quality, discoverability, and secure tool integration. Companies like Gentoro are working on orchestration and infrastructure layers for enterprise-grade agent systems.

This is the important shift:
the protocol itself is becoming less valuable than the operational ecosystem forming around it.

And Microsoft appears to be positioning Azure directly underneath that future stack.

Why This Is a Bigger Deal Than It Looks

The most important part of Microsoft’s announcement was not Linux.

It was the company openly framing agentic AI as an open systems problem rather than a proprietary model problem.

That is a major strategic distinction.

The AI industry spent the last two years competing almost entirely on model intelligence. But production agent systems introduce a completely different bottleneck:

  • interoperability
  • execution reliability
  • governance
  • runtime security
  • infrastructure portability
  • software supply chain trust

Those are open infrastructure problems.

That is also why Open Source Summit North America 2026 heavily centered discussions around AI infrastructure, supply chain security, embedded systems, and agentic AI on the same stage. ([Cloud Native Now][6])

The ecosystem is converging around a new reality:
agents are becoming distributed systems.

And distributed systems historically standardize around open protocols faster than proprietary interfaces.

That creates a very favorable environment for MCP.

Availability and Access

Microsoft’s announcements around Azure Linux 4.0 and Azure Container Linux were unveiled during Open Source Summit North America 2026, with broader rollout activity expected around Microsoft Build. ([SDxCentral][3])

The more important takeaway is strategic:
Microsoft is increasingly treating agent infrastructure as a first-class cloud layer.

And once cloud vendors start organizing around open agent interoperability, MCP stops looking like a niche protocol and starts looking like foundational infrastructure.

Follow for more coverage on MCP, agentic AI, and AI infrastructure.